

Abstract
Smoking is a risk factor for bladder cancer (BC), although the specific chemicals responsible for BC remain uncertain. Considerable research has focused on aromatic amines (AAs), including o-toluidine (o-tol), o-anisidine (o-anis), 2-naphthylamine (2-NA), and 4-aminobiphenyl (4-ABP), which are linked to human BC based on elevated BC incidence in occupationally exposed factory workers. These AAs arise at nanogram levels per combusted cigarette. The unambiguous identification of AAs, particularly low molecular weight monocyclic AAs in tobacco smoke extracts, by liquid chromatography/mass spectrometry (LC/MS) is challenging due to their poor performance on reversed-phase columns and co-elution with isobaric interferences from the complex tobacco smoke matrix. We employed a tandem liquid-liquid and solid-phase extraction method to isolate AAs from the basic fraction of tobacco smoke condensate (TSC) and utilized high-field asymmetric waveform ion mobility spectrometry (FAIMS) coupled to high-resolution accurate mass (HRAM) Orbitrap LC/MS2 to assay AAs in TSC. The employment of FAIMS greatly reduced sample complexity by removing precursor co-isolation interfering species at the MS1 scan stage, resulting in dramatically improved signal-to-noise of the precursor ions and cleaner, high-quality MS2 spectra for unambiguous identification and quantification of AAs in TSC. We demonstrate the power of LC/FAIMS/MS2 by characterizing and quantifying two low molecular weight carcinogenic AAs, o-tol and o-anis, in TSC, using stable isotopically labeled internal standards. These results demonstrate the power of FAIMS in trace-level analyses of AA carcinogens in the complex tobacco smoke matrix.
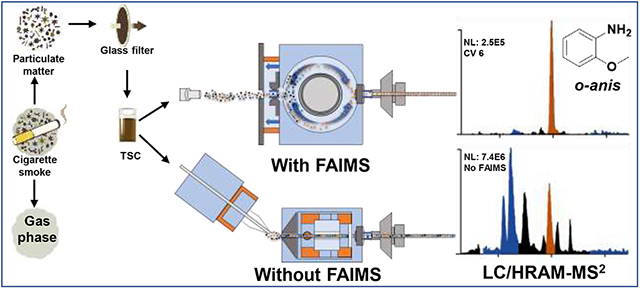
Graphical Abstract
Introduction
Tobacco smoke contains over 6000 chemicals,1 including over 60 known carcinogens, such as N-nitroso compounds, polycyclic aromatic hydrocarbons, aromatic amines (AAs), and heterocyclic aromatic amines (HAAs).2 Tobacco smoking is a well-established risk factor for bladder cancer (BC).3 Epidemiological studies reported factory workers in the textile dye and rubber tire industries exposed to high levels of the AAs, 4-aminobiphenyl (4-ABP), 2-naphthylamine (2-NA), and the alkyl anilines o-toluidine (o-tol) and o-anisidine (o-anis) had elevated risk of BC (Figure 1).4,5 4-ABP, 2-NA, and o-tol are classified as Group 1 carcinogens (carcinogenic to humans) and o-anis as a Group 2A carcinogen (probably carcinogenic to humans), by the International Agency for Research on Cancer. These AAs arise in tobacco smoke at levels from several nanograms (ng) up to ~50 ng per cigarette (cig),6 and are implicated in BC pathogenesis of smokers.3 The structurally related carcinogenic HAA, 2-amino-9H-pyrido[2,3-b]indole (AαC), is present at 50 to 100-fold higher levels than some AA carcinogens in tobacco smoke, and AαC also may be a risk factor for BC or other tobacco-associated cancers.7,8
Figure 1.

AAs and HAAs assayed in TSC.
The particulate phase of mainstream cigarette smoke contains over 3500 compounds, including AAs, which are separated from vapor phase chemicals by deposition of the particulates (0.1 to 1.0 μm in diameter) on glass fiber filters.1,6 The tobacco smoke condensate (TSC) collected on the filter pad is commonly extracted with acidic or ethanolic solutions and undergoes liquid/liquid extraction (LLE) and/or solid-phase extraction (SPE) before chemical analyses. Many primary AAs have historically been analyzed by gas chromatography-mass spectrometry (GC-MS) following chemical derivatization,9-11 and a recent automated method employing GC with tandem mass spectrometry was reported to measure several AAs in human urine.12
AAs are not typically analyzed by reversed-phase (RP)-LC because of their polarity and co-elution with isobaric interferents. However, LC-MS analysis is often more desirable than GC/MS due to more facile sample preparation and the ability to measure a broader range of compounds without chemical derivatization. TSC contains many low molecular-weight isobaric compounds that can interfere with monocyclic and bicyclic arylamines, making their characterization and quantitation challenging.13 Moreover, impurities found in LC mobile phases derived from solvents and buffer salts can produce high background signals that interfere with relatively low molecular weight analytes by LC-MS. Several studies have used RP-LC coupled to triple quadrupole (QqQ)-MS in the selected reaction monitoring (SRM) mode to measure AAs and HAAs in TSC.14-17 The analytes' identities and chemical purities are often based on the relative abundance of one target ion with a single qualifier ion; these spectral criteria may not be sufficient to rule out co-eluting isomers or other isobaric interferences. The full product ion scan mode of the QqQ-MS has not been employed to identify carcinogens in TSC because the low resolution and insensitivity of the full scan mode precludes the acquisition of high-quality MS2 scan spectra of carcinogens present at the ng per cig levels in TSC
Recent advances in Orbitrap high-resolution accurate mass spectrometry (HRAMS) technology have provided high selectivity for analyte LC-MS measurements at trace levels with parts-per-million accuracy (ppm).18 However, assaying analytes in complex matrices such as TSC remains challenging due to the co-isolation of isobaric species that interfere at the MS2 scan stage resulting in "chimera" mass spectra which precludes unequivocal analyte identification.19 Ion mobility spectrometry (IMS) is another analytical separation platform that has emerged over the past several decades and interfaced in GC-MS and LC-MS workflows.20 IMS separates ions based on their size, shape, and charge state in an inert gas under the influence of an electric field.20,21 High-field asymmetric waveform ion mobility spectrometry (FAIMS) is one of several IMS technologies22-24 that interface with LC-MS workflows.20,25,26 In FAIMS, the ions pass through a flow of nitrogen gas of the drift region of the planar or cylindrical device in an orthogonal direction between two electrodes which generate an electric field of alternating pulsed high-field and low-field dispersion voltage (DV) of opposite polarity. A secondary direct current compensation voltage (CV) is applied, and a subset of ions with stable trajectories at discreet CV values will exit the FAIMS into the vacuum region of the MS. Thus, FAIMS acts as a filtering device and can greatly increase the signal-to-noise ratio of targeted analytes by removing interfering chemicals and providing cleaner mass chromatograms and spectra.20
LC/FAIMS/MS is used extensively in proteomics to separate peptides by charge state.27-31 Often, only 3-4 discrete CVs are required to detect peptides at +2, +3, and +4 charge states, which have broad CV maxima, while eliminating undesirable species such as solvated clusters, singly-charged species, and chemical noise.29-31 FAIMS/MS analyses of small molecules are less common; however, applications in metabolite profiling, environmental monitoring, natural products, and MS imaging have been reported.21,26,32,33 For example, Regueiro and colleagues used differential ion mobility spectrometry (DMS), also known as planar field-asymmetric ion mobility spectrometry (p-FAIMS) coupled to QqQ-MS to rapidly quantitate several tobacco alkaloids and their carcinogenic N-nitroso derivatives in electronic cigarette refill liquids, which are simpler matrices than combusted tobacco smoke.34 Given the analytical challenges in conducting measurements and acquiring high-quality mass spectra of AAs at trace levels in the TSC matrix by QqQ-MS, we investigated the potential of FAIMS to reduce the analyte complexity of TSC for characterization, identification, and quantitation of carcinogenic AAs and HAAs with micro-flow LC coupled to the Orbitrap Lumos Tribrid MS.
Experimental Procedures
Materials.
o-Tol, p-toluidine (p-tol), 4-ABP, 3-aminobiphenyl (3-ABP), o-anis, m-anisidine (m-anis), p-anisidine (p-anis), and 2-NA were from Sigma Aldrich (St. Louis, MO). [13C6]o-Tol, [2H3C]o-anis, [2H9]4-ABP, 2-aminobiphenyl (2-ABP), and 1-naphthylamine (1-NA) were purchased from Toronto Research Chemicals (Toronto, CA). m-Toluidine (m-tol) was purchased from Acros Organics (Geel, Belgium). Optima™ LC-MS grade H2O, MeOH, MeCN, formic acid (FA) acetic acid, ammonium hydroxide, HPLC grade hexane, dichloromethane (DCM), and HCl (1.0 N stock solution) were purchased from Fisher Chemical Co. (Pittsburgh, PA). SOLA SCX SPE cartridges (10 mg/1 mL) were purchased from Thermo Fisher Scientific (San Jose, CA). Ethanol (200 proof) was purchased from Decon Labs (King of Prussia, PA).
TSC filter pad preparation.
Reference filtered cigarettes (1R6F) were obtained from The Center for Tobacco Reference Products, University of Kentucky, Lexington, KY. Commercial Marlboro-filtered cigarettes were purchased from a retail store in Taiwan. The cigarettes were stored at −20 °C and then conditioned at 22 °C in a 60% relative humidity environment for 48 h before use.35 The cigarettes were smoked using a Borgwaldt LX1 linear single port smoking machine (Borgwaldt KC, Hamburg, Germany) under a Canadian Intense smoking regiment (55 mL puff volume, 2 sec per puff, 30-sec puff interval and 100% blocked ventilation holes).35 Mainstream smoke was collected on 44 mm Cambridge glass fiber filter pads (5 cigs per pad). Total particulate matter was measured by gravimetric analysis.
Isolation of basic TSC fraction.
Filter pads were immersed in ethanol (10 mL) and sonicated for 60 min using an ultrasonic water bath (Branson Ultrasonics Corp, Danbury, CT). The ethanol extracts were centrifuged at 3,000 x g for 10 min to remove glass fiber filaments; the supernatant was transferred to a fresh 15 mL tube containing 1.0 N HCl (1 mL) and concentrated under a stream of nitrogen to a final vol of 1 mL in a 37 °C water bath. The equivalent of one cigarette was extracted twice with 2 vol of DCM, and the organic phase containing neutral compounds was discarded. A 0.1N NaOH solution was added to the aqueous phase (final pH 10) and extracted twice with two vol of hexane. The basic hexane fraction was collected, and the aqueous phase was extracted again with 2 vol of DCM twice. The hexane and DCM fractions were each back-extracted twice with 2 vol of 0.1 N HCl, and the organic phases were discarded. The acidic aqueous extracts were applied to SOLA SCX SPE cartridges, which were pre-washed with MeOH/5% NH4OH (1 mL) followed by H2O/2% FA (1 mL) before loading samples. Cartridges were washed sequentially with H2O containing 2% FA (1 mL) twice, followed by MeOH containing 2% FA (1 mL), H2O (1 mL), and 5% NH4OH (1 mL). The cartridges were eluted with MeOH containing 5% NH4OH (1 mL) and left in a fume hood for 1 h to allow the ammonia to evaporate. Then, HOAc (10% solution; 50 μL) was added to eluents, which were concentrated under a stream of nitrogen at room temperature until ~75 μL remained. Adding HOAc to the basic fraction extract SPE eluents before concentration under nitrogen gas was required to recover the AAs as their salts, mitigating their volatility. Without acidification, the AAs were poorly recovered (Figure S-1). The SPE eluents were diluted to 100 μL final volume with H2O. Blank filter pads were extracted using the same procedure. All compounds were assayed from the hexane fraction except AαC, which was from the DCM fraction.
LC/HRAM-MS parameters.
LC-MS analyses were performed on an Orbitrap Fusion Lumos MS (Thermo Fisher Scientific, San Jose, CA) equipped with a HESI-II source, interfaced with a Dionex UltiMate 3000 RSLCnano Ultra-high performance liquid-chromatography (UHPLC) System (Thermo Fisher Scientific, San Jose, CA). Electrospray ionization (ESI) was done in the positive ion mode. MS source parameters were as follows: spray voltage, 3500; ion transfer tube temperature, 350 °C; sheath gas, 25 (Arb); aux gas, 5 (Arb); sweep gas, 0; vaporizer temperature, 75 °C. Analyte separations were carried out on a Hypersil Gold AQ column (1.0 x 150 mm; 2.6 μm) (Thermo Fisher Scientific, San Jose, CA) using the UHPLC loading pump for chromatography. The injection volume was 2.5 μL (2.5% equivalent of one cig). The mobile phases were A, 0.1% FA in H2O, and mobile phase B, 0.1% FA in MeCN. The 1% B was held for 3 min, followed by a linear gradient from 1% B to 22% B over 14 min, followed by a linear gradient from 22% B to 99% B over 9 min, returning to 1% B over one min, and 9 min equilibration time. The flow rate was 75 μL/min. Several synthetic AA standards' retention times differed slightly from those in the TSC samples. We ascribe this phenomenon to a matrix effect of the TSC extract or the imprecision of the loading pump of the UHPLC capillary system used for higher flow rate analytical separations.
Data were acquired by Xcalibur version 4.4 (Thermo Fisher Scientific, San Jose, CA). Targeted MS scan parameters were as follows: RF lens, 50%; Orbitrap resolution, 60,000; scanning range, m/z 90 – 350; automatic gain control (AGC) target, 4E5. Targeted MS2 parameters using high-energy collision dissociation (HCD) were as follows: RF lens, 50%; Orbitrap resolution, 30,000; AGC target, 5E4; maximum injection time, 54 ms; quadrupole isolation; isolation width was 1.6 m/z. The HCD collision energies are reported in Table 1. Extracted ion chromatograms (EICs) were constructed with a 5 ppm mass tolerance.
Table 1.
Peak CV (V), normalized HCD energy (%), and precursor ion m/z ([M+H]+) values for AA and HAA analytes.
| Compound | CV | HCD | [M+H]+ |
|---|---|---|---|
| 4-ABP | 5 | 55 | 170.0964 |
| 2-ABP | 5 | 55 | 170.0964 |
| 3-ABP | 0 | 55 | 170.0964 |
| 1-NA | 14 | 60 | 144.0808 |
| 2-NA | 10 | 60 | 144.0808 |
| o-tol | 16 | 50 | 108.0801 |
| m-tol | 16 | 50 | 108.0801 |
| p-tol | 18 | 50 | 108.0801 |
| o-anis | 6 | 50 | 124.0757 |
| m-anis | 14 | 50 | 124.0757 |
| p-anis | 16 | 50 | 124.0757 |
| AαC | 0 | 55 | 184.0869 |
FAIMS optimization and LC/FAIMS/MS2 analysis.
The FAIMS Pro Duo High-Field Asymmetric Waveform Ion Mobility Spectrometry System (Thermo Fisher Scientific, (San Jose, CA) was interfaced between the heated-electrospray ionization (H-ESI-II) probe and ion transfer tube. The optimal FAIMS CVs were determined by infusion of freshly prepared stock solutions of the analytes (500 pg/μL, 1:1 H2O:MeCN containing 0.1% FA) by syringe at 7.5 μL/min utilizing a mixing tee connected to the loading pump of the UHPLC, using the same mobile phase solvents as stated above, at 67 μL/min flow rate at 10% B for monocyclic AAs and 50% B for bicyclic AAs and HAAs. The MS source parameters were the same as stated above without FAIMS. Peak CVs and HCD energies for MS2 spectra generation are reported in Table 1. Optimal CVs were tuned online for targeted analytes each time the FAIMS housing was removed and drifted by no more than ±2 CV from the values in Table 1. FAIMS carrier nitrogen gas was kept constant at 6 L/min using the high-resolution electrode temperature settings: the inner electrode was set at 80 °C, and the outer electrode was set to 100 °C. At most six unique CVs were used for online MS1 and MS2 FAIMS experiments. The remaining UHPLC, MS1, and MS2 parameters were conducted using the same LC-MS method without FAIMS, as reported above. The extracted ion chromatograms (EICs) were constructed with 5 ppm mass tolerance.
Calibration curve generation for o-tol and o-anis, quantitative measures, and performance of the method.
Calibration curves for o-tol and o-anis were constructed with synthetic unlabeled and stable, isotopically labeled standards ([13C6]o-tol and [2H3C]o-anis). The standards were added to ethanolic extracts of the blank filters at five calibration levels and processed with the same tandem solvent SPE workup employed for the TSC described above. The quantitation of o-tol and o-anis in TSC was also done by adding the isotopically labelled internal standards to the ethanolic TSC extracts. The FAIMS CV of 6 and 16 were used for o-anis and o-tol, respectively. Calibrant samples contained [2H3C]o-anis and [13C6]o-tol concentrations at the equivalent of 5 ng/cig and 50 ng/cig, respectively. The o-anis calibration levels ranged from 0 to 15 ng/cig and o-tol calibration levels ranged from 0 to 75 ng/cig. Each calibration level was processed assayed in triplicate, injecting 2.5 of the 100 μL SPE eluent (2.5% equivalent of one cig). Linear regression was performed using GraphPad Prism software employing the ordinary least-squares analysis with equal weightings (San Diego, CA, V 8.4.3). The LOQ values were estimated by the slope (S) of the regression and its Y-intercept SE (σ) using the formula LOQ = 10σ/S.36,37
The inter- and intra-day CVs were calculated from o-tol and o-anis levels measured over three days (4 replicates/day) in commercial Marlboro brand cigarettes. The acid ethanolic TSC extract was obtained from a single filter pad and stored at −80 °C until assayed. The liquid-liquid extraction and SPE steps were done on three different days. The rationale for not excising a portion of the pad for each analysis was that the filter pad may not have had a uniform distribution of the chemicals entrapped from the particulate phase. The internal standards were added to ethanolic extracts of TSC filter pads before any extractions were done.
Results and Discussion
Analysis of AAs in TSC by LC/FAIMS/MS.
The incorporation of FAIMS in qualitative and targeted analyses of TSC extracts showed a remarkable ability to remove isobaric interferences at the MS1 scan stage, greatly increasing the MS1 signal-to-noise ratio for o-tol (Figure 2A, B), o-anis (Figure 2C, D), and 1-NA and 2-NA isomers (Figure 2E, F). Applying FAIMS achieved MS1 baseline resolution of these AAs from interferents.
Figure 2.

(A) MS1 EIC of toluidine isomers (m/z 108.0808) in TSC without FAIMS, and (B) with FAIMS at CV 16. (C) MS1 EIC of o-anis (m/z 124.0757) in TSC without FAIMS and (D) with FAIMS at CV 6. (E) MS1 EIC of naphthylamines (m/z 144.0808) in TSC without FAIMS and (F) with FAIMS at CV 11. EICs were constructed at 5 ppm mass tolerance.
Product ion spectra are required for unambiguous identification of AAs and other carcinogens in TSC. Without FAIMS, even the more abundant toluidine isomers were poorly resolved from the interfering background signals at the MS2 scan stage, and the quality of the product ion spectra of toluidine isomers was poor and contained interfering fragment ions (Figure 3A). An abundant interfering ion eluting before p-tol in the MS2 total ion chromatogram (TIC) tailed across all toluidine isomers (Figure 3A). The precursor ion of the isobaric interferent(s) at m/z 108.0808 was identical to the toluidine precursors, and it shared a common MS2 fragment ion, the anilinium radical cation at m/z 93.0572, with all toluidine isomers (Figure 3A). The spill-over of the interfering compound(s) greatly distorted the relative abundances of the MS2 fragment ion ratios for all three toluidine isomers, particularly for p-tol, which was closest in retention time to the interferent(s). Applying a FAIMS CV of 16 removed all interfering species in the chromatograms (Figure 3B), and the MS2 spectra for the three isomers closely matched those MS2 spectra of the pure standards (Figure 3, right panel).
Figure 3.

MS2 TIC of toluidine isomers (m/z 108) (left panel) (A) TSC without FAIMS, (B) TSC with FAIMS at CV 16. The MS2 spectra (right panel) shown for toluidine isomers in TSC with no FAIMS (top panel), with FAIMS (middle panel), and with FAIMS (pure standards).
The analysis of o-anis in TSC without FAIMS also showed isobaric interferences at MS1 and MS2 scan stages. The o-anis precursor ion at m/z 124.0757 is a minor component of the peak eluting at 9.9 min without FAIMS (Figure 2C). These isobaric interferences are removed when applying a FAIMS CV of 6 (Figure 2D). The TIC of o-anis at the MS2 scan stage without FAIMS is obscured by co-isolated ions (Figure 4A). Applying a CV of 6 removed interfering compounds in the MS2 TIC trace (Figure 4B). The MS2 EIC of the primary fragment ion of o-anis (m/z 124.0757>109.0521, loss of CH3•, 5 ppm mass tolerance) without FAIMS is shown in Figure 4C. The co-isolated chemicals added significant complexity to the EIC and contributed to a chimera MS2 spectrum of o-anis (Figure 4C, right panel). Applying a CV of 6 removed all interfering peaks in the MS2 EIC (Figure 4D), and the MS2 spectrum matched the spectrum of the o-anis standard (Figure 4E). The peak was identified as o-anis and not the m-anis or p-anis isomers, which differed in retention times, and had disparate CV values (Table 1) and by MS2 spectra (Figure S-2). The differences in the peak optima CVs of anisidine isomers are larger than for the other AA isomers assayed (Table 1). Intramolecular hydrogen bonding between the NH3 and methoxy groups of o-anis may influence its ion mobility, similar to the effect of intramolecular hydrogen bonding on pH in salicylic acid substituted derivatives.38 The isobaric compounds at the MS2 stage containing the fragment ions at m/z 109.0521 [M+H-CH3•]+ are possible isomers of other AAs present in TSC.1,39 These data show the ability of FAIMS to discriminate between structural isomers of certain AAs based on ion mobility.
Figure 4.

(A) MS2 TIC of anis isomers at m/z 124 of TSC with FAIMS off. (B) MS2 TIC m/z 124 of TSC with FAIMS at CV 6. (C) MS2 EIC of o-anis m/z 124>109.0521 and MS2 spectrum (right) of TSC without FAIMS. (D) MS2 EIC of o-anis m/z 124>109.0521 and MS2 spectrum (right) of TSC with FAIMS at CV 6. (E) MS2 EIC of o-anis m/z 124>109.0521 and MS2 spectrum (right) of 200 pg o-anis standard with FAIMS at CV 6. EICs were constructed at 5 ppm mass tolerance.
A similar reduction in the background signals was obtained when utilizing FAIMS to analyze 1-NA and 2-NA isomers. Both compounds were resolved from interferences at the MS1 level when applying a CV of 11 (Figure 2E, F). The NA isomers were free of interfering peaks at the MS2 EIC level without FAIMS (Figure 5A); however, FAIMS increased the signal-to-noise and dramatically improved the cleanliness of the 2-NA MS2 spectrum, which closely matched that of the pure standard (Figure 5A, B). A high-quality MS2 spectrum was also obtained for 1-NA using FAIMS (Figure S-3).
Figure 5.

MS2 EIC of naphthylamine isomers m/z 144>127.0548 (left panel) and MS2 spectrum spectra (right panel) of (A) TSC without FAIMS, (B) TSC with FAIMS at CV 11, and (C) 200 pg each 1-NA and 2-NA standards with FAIMS at CV 11. The MS2 spectra are shown for 2-NA. EICs were constructed at 5 ppm mass tolerance.
FAIMS did not improve the signal-to-noise for all analytes. In the case of aminobiphenyl isomers, the modest reduction of background signal by FAIMS did not significantly improve the quality of the MS2 spectrum (Figure S-4). The limiting factor in assaying 4-ABP was the inability to completely resolve it chromatographically from 2-ABP, which also had an overlapping CV optimum (Figure S-4). In the case of AαC, LC/MS without FAIMS was sufficient for detection at the MS2 scan stage due to AαC's high ion abundance and the overall robustness of HAA performance on RP-LC, which was superior to the AAs (Figure S-5). Using FAIMS did not appreciably improve the cleanliness of the MS2 spectrum of AαC (Figure S-5C, D and right panel), but applying a CV of 0 did reduce the compounds co-isolated with AαC, allowing baseline resolution by MS2 TIC (Figure S-5A, B).
Performance of the Analytical Method and Quantitation of o-Tol and o-Anis in TSC extracts using LC/FAIMS/MS2.
Calibration curves were constructed for o-anis and o-tol analytes using isotopically labeled internal standards ([2H3C]o-anis and [13C6]o-tol) in blank filter pad extracts. Both analytes displayed linearity in signal responses over their calibration ranges (Figure S-6). The average signal intensities using FAIMS, compared to the signal intensities with the FAIMS housing removed, for o-tol and o-anis were 27% and 24%. The signal intensities of o-tol and o-anis, and other AAs assayed with FAIMS, were comparable to those obtained with the FAIMS housing on but with the DV and CV off. LOQs were estimated using the slope (S) of the regression curve, and it's Y-intercept SE (σ) using the formula LOQ = 10σ/S.36,37 Calculated LOQs for o-anis and o-tol were 2.3 ng/cig and 5.8 ng/cig, respectively, when assaying an extract equivalent to 2.5% of one cig. Although the amount of the cig equivalent extract assayed is low, the LOQs in the TSC matrix may be higher due to ion suppression matrix effects. o-Anis and o-tol were quantitated in 1R6F reference cigarettes and commercial Marlboro cigarettes. o-Anis was present at 5.9 ± 0.4 ng/cig and o-tol was present at 63.3 ± 3.2 ng/cig and in Marlboro cigarettes, and o-anis was present at 3.0 ± 0.3 ng/cig and o-tol was present at 65.1 ± 3.8 ng/cig in 1R6F reference cigarettes, in agreement with previous data.9,11
The intra- and inter-day method performance are reported for o-tol and o-anis using Marlboro TSC extracts which were processed on three different days (N = 4 per day). The intra-day CVs for o-anis and o-tol were 5.3% and 4.3%, and the inter-day CVs were 6.7% and 5.9%, respectively (Table S-1).
Conclusion
FAIMS operates by varying the CV, whereby only ions with specific ion mobilities pass through the device. This filtering technology removes chemical noise, making LC/FAIMS/Orbitrap MSn well-suited for targeted analyses but less ideal for untargeted experiments.40 The FAIMS interfaced with LC/HRAM-MS2 markedly increased the signal-to-noise and removed most isobaric interferences in AA analyses at the MS1 and MS2 scan stages. The MS2 spectra obtained by LC/FAIMS/MS2 were essentially free of interfering peaks and closely matched the spectra of pure standards, allowing for unambiguous characterization and providing critical identification features when searching against a spectral library. Previous studies measuring AAs and HAAs by QqQ-MS often employed SRM with a single transition for quantification and qualifier ion for identity confirmation.14-16 Given the complexity of TSC with overlapping isobaric and isomer interferences, identifying and quantifying some AAs and other carcinogens in TSC by the low-resolution QqQ-MS in the SRM mode can be challenging. Thus, LC/FAIMS/MSn is a significant analytical advance for screening carcinogens in tobacco smoke.
A limitation of LC/FAIMS/MSn Orbitrap MS is that the duty cycle increases with the number of static CVs employed for analyses. Many low molecular weight molecules have narrow and unique CV optima. Thus, the number of chemicals with unique CVs that can be quantitatively measured in a single run is limited by the overall CV residence time of FAIMS, the MS transient time, and the duty cycle of the MS. A time-scheduled triggering of different CVs or the MS2 scan of targeted analytes could be implemented to increase the number of chemicals assayed with different CV optima. However, the employment of FAIMS Orbitrap LC/MSn in untargeted metabolomics and exposomics studies, where thousands of features are scanned in a single run, is challenging, and many compounds may be missed due to the slow duty cycle of LC/FAIMS/MS.
Our results show FAIMS can be successfully employed for complicated targeted analyses of carcinogens in TSC. LC/FAIMS/MS may facilitate the analyses of tobacco carcinogen biomarkers in biological matrices such as plasma or urine of individuals where current analytical methods are laborious or fail to remove interferences. FAIMS can be coupled to nano-LC/HRAM-MSn for improved selectivity and sensitivity needed to measure urinary biomarkers of tobacco smoke (or other environmental carcinogens), their metabolites, and DNA adducts in humans to link exposures to cancer risk, extending our knowledge of chemicals involved in bladder carcinogenesis of smokers.41,42
Supplementary Material
Acknowledgements
We thank Dr. Irina Stepanov's laboratory for preparing tobacco smoke condensate (TSC) and Dr. Peter Villalta, University of Minnesota, for helpful comments on this manuscript. The Turesky laboratory gratefully acknowledges the support of the Masonic Chair in Cancer Causation.
Funding
This research was supported by R01ES030559 (RJT) from the National Institute of Environmental Health Sciences, and Mass spectrometry was supported by Cancer Center Support Grant CA077598 from the National Cancer Institute.
Footnotes
Supporting Information
The Supporting Information is available free of charge on the ACS publication website at DOI:
Recovery of AAs from evaporation step of methanol eluent under a stream of nitrogen gas; LC-MS and mass spectra of anisidine isomers, LC/MS2 EIC of 1-NA and LC/MS2 EIC of ABP isomers in TSC; LC/MS2 TIC and spectra of AαC; Calibration curves for o-tol and o-anis; Table S-1 Inter- and intraday measurements of o-tol and o-anis in TSC.
References
- 1.Rodgman A, and Perfetti TA (2013) The Chemical Components of Tobacco and Tobacco Smoke, Second Edition, 2 ed., CRC Press, Boca Raton, Fl. [Google Scholar]
- 2.Hoffmann D, Hoffmann I, and El-Bayoumy K (2001) The Less Harmful Cigarette: A Controversial Issue. A Tribute to Ernst L. Wynder. Chem. Res. Toxicol 14, 767–790. [DOI] [PubMed] [Google Scholar]
- 3.(2004) Tobacco Smoke and Involuntary Smoking, IARC Monographs on the Evaluation of Carcinogenic Risks to Humans. Vol. 83, IARC, Lyon, France. [PMC free article] [PubMed] [Google Scholar]
- 4.(2010) Some aromatic amines, organic dyes, and related exposures., IARC Monographs on the Evaluation of Carcinogenic Risks to Humans. Vol. 99, IARC, Lyon, France. [PMC free article] [PubMed] [Google Scholar]
- 5.Ward E, Carpenter A, Markowitz S, Roberts D, and Halperin W (1991) Excess Number of Bladder Cancers in Workers Exposed to Ortho-Toluidine and Aniline. J. Nat. Cancer Inst 83, 501–506. [DOI] [PubMed] [Google Scholar]
- 6.Patrianakos C, and Hoffmann D (1979) Chemical Studies on Tobacco Smoke LXIV. On the Analysis of Aromatic Amines in Cigarette Smoke. J. Anal. Toxicol 3, 150–154. [Google Scholar]
- 7.Yoshida D, and Matsumoto T (1980) Amino-alpha-carbolines as mutagenic agents in cigarette smoke condensate. Cancer Lett. 10, 141–149. [DOI] [PubMed] [Google Scholar]
- 8.(1992) Some Naturally Occurring Substances: Food Items and Constituents, Heterocyclic Aromatic Amines and Mycotoxins, IARC Monographs on the Evaluation of Carcinogenic Risks to Humans. Vol. 56, IARC, Lyon, France. [Google Scholar]
- 9.Stabbert R, Schäfer K-H, Biefel C, and Rustemeier K (2003) Analysis of aromatic amines in cigarette smoke. Rapid Commun. Mass Spectrom 17, 2125–2132. [DOI] [PubMed] [Google Scholar]
- 10.Smith CJ, Qian X, Zha Q, and Moldoveanu SC (2004) Analysis of α- and β-carbolines in mainstream smoke of reference cigarettes by gas chromatography–mass spectrometry. J. Chromatog. A 1046, 211–216. [DOI] [PubMed] [Google Scholar]
- 11.Ji H, and Jin Z (2022) Analysis of six aromatic amines in the mainstream smoke of tobacco products. Anal. Bioanal. Chem 414, 4227–4234. [DOI] [PMC free article] [PubMed] [Google Scholar]
- 12.Mazumder S, Ahamed RA, McGahee E, Wang L, and Seyler TH (2019) A New Automated Method for the Analysis of Aromatic Amines in Human Urine by GC-MS/MS. J. Anal. Toxicol 43, 25–35. [DOI] [PMC free article] [PubMed] [Google Scholar]
- 13.Arndt D, Wachsmuth C, Buchholz C, and Bentley M (2020) A complex matrix characterization approach, applied to cigarette smoke, that integrates multiple analytical methods and compound identification strategies for non-targeted liquid chromatography with high-resolution mass spectrometry. Rapid Commun. Mass Spectrom 34, 1–13. [DOI] [PMC free article] [PubMed] [Google Scholar]
- 14.Saha S, Mistri R, and Ray BC (2009) Rapid and sensitive method for simultaneous determination of six carcinogenic aromatic amines in mainstream cigarette smoke by liquid chromatography/electrospray ionization tandem mass spectrometry. J Chromatogr. A 1216, 3059–3063. [DOI] [PubMed] [Google Scholar]
- 15.Bie Z, Lu W, Zhu Y, Chen Y, Ren H, and Ji L (2017) Rapid determination of six carcinogenic primary aromatic amines in mainstream cigarette smoke by two-dimensional online solid phase extraction combined with liquid chromatography tandem mass spectrometry. J. Chromatog. A 1482, 39–47. [DOI] [PubMed] [Google Scholar]
- 16.Zhang L, Ashley DL, and Watson CH (2011) Quantitative analysis of six heterocyclic aromatic amines in mainstream cigarette smoke condensate using isotope dilution liquid chromatography-electrospray ionization tandem mass spectrometry. Nicotine Tob. Res 13, 120–126. [DOI] [PubMed] [Google Scholar]
- 17.Xie F, Yu J, Wang S, Zhao G, Xia Q, Zhang X, and Zhang S (2013) Rapid and simultaneous analysis of ten aromatic amines in mainstream cigarette smoke by liquid chromatography/electrospray ionization tandem mass spectrometry under ISO and "Health Canada intensive" machine smoking regimens. Talanta 115, 435–441. [DOI] [PubMed] [Google Scholar]
- 18.Eliuk S, and Makarov A (2015) Evolution of Orbitrap Mass Spectrometry Instrumentation. Annu. Rev. Anal. Chem 8, 61–80. [DOI] [PubMed] [Google Scholar]
- 19.Guo J, Yonemori K, Le Marchand L, and Turesky RJ (2015) Method to Biomonitor the Cooked Meat Carcinogen 2-Amino-1-methyl-6-phenylimidazo[4,5-b]pyridine in Dyed Hair by Ultra-Performance Liquid Chromatography-Orbitrap High Resolution Multistage Mass Spectrometry. Anal. Chem 87, 5872–5877. [DOI] [PMC free article] [PubMed] [Google Scholar]
- 20.Dodds JN, and Baker ES (2019) Ion Mobility Spectrometry: Fundamental Concepts, Instrumentation, Applications, and the Road Ahead. J. Am. Soc. Mass Spectrom 30, 2185–2195. [DOI] [PMC free article] [PubMed] [Google Scholar]
- 21.Lapthorn C, Pullen F, and Chowdhry BZ (2013) Ion mobility spectrometry-mass spectrometry (IMS-MS) of small molecules: Separating and assigning structures to ions. Mass Spectrom. Rev 32, 43–71. [DOI] [PubMed] [Google Scholar]
- 22.Buryakov IA, Krylov EV, Nazarov EG, and Rasulev UK (1993) A new method of separation of multi-atomic ions by mobility at atmospheric pressure using a high-frequency amplitude-asymmetric strong electric field. Int. J. Mass Spectrom. and Ion Proc 128, 143–148. [Google Scholar]
- 23.Guevremont R. (2004) High-field asymmetric waveform ion mobility spectrometry: A new tool for mass spectrometry. J. Chromatog. A 1058, 3–19. [PubMed] [Google Scholar]
- 24.Shvartsburg AA, Li F, Tang K, and Smith RD (2006) High-Resolution Field Asymmetric Waveform Ion Mobility Spectrometry Using New Planar Geometry Analyzers. Anal. Chem 78, 3706–3714. [DOI] [PMC free article] [PubMed] [Google Scholar]
- 25.Purves RW, and Guevremont R (1999) Electrospray Ionization High-Field Asymmetric Waveform Ion Mobility Spectrometry–Mass Spectrometry. Anal. Chem 71, 2346–2357. [DOI] [PubMed] [Google Scholar]
- 26.Liu L, Wang Z, Zhang Q, Mei Y, Li L, Liu H, Wang Z, and Yang L (2023) Ion Mobility Mass Spectrometry for the Separation and Characterization of Small Molecules. Anal. Chem 95, 134–151. [DOI] [PubMed] [Google Scholar]
- 27.Kolakowski BM, and Mester Z (2007) Review of applications of high-field asymmetric waveform ion mobility spectrometry (FAIMS) and differential mobility spectrometry (DMS). The Analyst 132, 842. [DOI] [PubMed] [Google Scholar]
- 28.Canterbury JD, Yi X, Hoopmann MR, and MacCoss MJ (2008) Assessing the Dynamic Range and Peak Capacity of Nanoflow LC–FAIMS–MS on an Ion Trap Mass Spectrometer for Proteomics. Anal. Chem 80, 6888–6897. [DOI] [PMC free article] [PubMed] [Google Scholar]
- 29.Swearingen K, Hoopmann M, Johnson R, Saleem R, Aitchison J, and Moritz R (2011) Nanospray FAIMS Fractionation Provides Significant Increases in Proteome Coverage of Unfractionated Complex Protein Digests. Mol. Cell. Proteomics 11, M111.014985. [DOI] [PMC free article] [PubMed] [Google Scholar]
- 30.Cooper HJ (2016) To What Extent is FAIMS Beneficial in the Analysis of Proteins? J. Am. Soc. Mass Spectrom 27, 566–577. [DOI] [PMC free article] [PubMed] [Google Scholar]
- 31.Hebert AS, Prasad S, Belford MW, Bailey DJ, McAlister GC, Abbatiello SE, Huguet R, Wouters ER, Dunyach J-J, Brademan DR, Westphall MS, and Coon JJ (2018) Comprehensive Single-Shot Proteomics with FAIMS on a Hybrid Orbitrap Mass Spectrometer. Anal. Chem 90, 9529–9537. [DOI] [PMC free article] [PubMed] [Google Scholar]
- 32.Purves RW, Prasad S, Belford M, Vandenberg A, and Dunyach J-J (2017) Optimization of a New Aerodynamic Cylindrical FAIMS Device for Small Molecule Analysis. J. Am. Soc. Mass Spectrom 28, 525–538. [DOI] [PubMed] [Google Scholar]
- 33.Dodds JN, Alexander NLM, Kirkwood KI, Foster MR, Hopkins ZR, Knappe DRU, and Baker ES (2021) From Pesticides to Per- and Polyfluoroalkyl Substances: An Evaluation of Recent Targeted and Untargeted Mass Spectrometry Methods for Xenobiotics. Anal. Chem 93, 641–656. [DOI] [PMC free article] [PubMed] [Google Scholar]
- 34.Regueiro J, Giri A, and Wenzl T (2016) Optimization of a Differential Ion Mobility Spectrometry-Tandem Mass Spectrometry Method for High-Throughput Analysis of Nicotine and Related Compounds: Application to Electronic Cigarette Refill Liquids. Anal. Chem 88, 6500–6508. [DOI] [PubMed] [Google Scholar]
- 35.Jain V, Alcheva A, Huang D, Caruso R, Jain A, Lay M, O'Connor R, and Stepanov I (2019) Comprehensive Chemical Characterization of Natural American Spirit Cigarettes. Tob. Regul. Sci 5, 381–399. [DOI] [PMC free article] [PubMed] [Google Scholar]
- 36.Dolan JW (2009) Calibration Curves, Part II: What are the Limits? LCGC North America 27, 306–312. [Google Scholar]
- 37.Konorev D, Yao L, and Turesky RJ (2022) Multi-DNA Adduct and Abasic Site Quantitation In Vivo by Nano-Liquid Chromatography/High-Resolution Orbitrap Tandem Mass Spectrometry: Methodology for Biomonitoring Colorectal DNA Damage. Chem. Res. Toxicol 35, 1519–1532. [DOI] [PMC free article] [PubMed] [Google Scholar]
- 38.Dunn G, and Kung F.-l. (2011) Effect of Intramolecular Hydrogen Bonding on Ionization Constants of Substituted Salicylic Acids. Canadian J. Chem 44, 1261–1269. [Google Scholar]
- 39.Schmeltz I, and Hoffmann D (1977) Nitrogen-Containing Compounds in Tobacco and Tobacco Smoke. Chemical Reviews 77, 295–311. [Google Scholar]
- 40.Paglia G, Smith AJ, and Astarita G (2022) Ion mobility mass spectrometry in the omics era: Challenges and opportunities for metabolomics and lipidomics. Mass Spectrom. Rev 41, 722–765. [DOI] [PubMed] [Google Scholar]
- 41.Hecht SS (2002) Human urinary carcinogen metabolites: biomarkers for investigating tobacco and cancer. Carcinogenesis 23, 907–922. [DOI] [PubMed] [Google Scholar]
- 42.Kafle A, Klaene J, Hall AB, Glick J, Coy SL, and Vouros P (2013) A differential mobility spectrometry/mass spectrometry platform for the rapid detection and quantitation of DNA adduct dG-ABP. Rapid Commun. Mass Spectrom 27, 1473–1480. [DOI] [PMC free article] [PubMed] [Google Scholar]
Associated Data
This section collects any data citations, data availability statements, or supplementary materials included in this article.