

Summary
To maintain genome integrity, cells must accurately duplicate their genome and repair DNA lesions when they occur. To uncover genes that suppress DNA damage in human cells, we undertook flow cytometry-based CRISPR/Cas9 screens that monitored DNA damage. We identified 160 genes whose mutation caused spontaneous DNA damage, a list enriched in essential genes, highlighting the importance of genomic integrity for cellular fitness. We also identified 227 genes whose mutation caused DNA damage in replication-perturbed cells. Among the genes characterized, we discovered that deoxyribose-phosphate aldolase DERA suppresses DNA damage caused by cytarabine; and that GNB1L, a gene implicated in 22q11.2 syndrome, promotes biogenesis of ATR and related phosphatidylinositol 3-kinase-related kinases (PIKKs). These results implicate defective PIKK biogenesis as a cause of some phenotypes associated with 22q11.2 syndrome. The phenotypic mapping of genes that suppress DNA damage therefore provides a rich resource to probe the cellular pathways that influence genome maintenance.
eTOC Blurb
Zhao et al. performed phenotypic CRISPR screens to uncover genes and pathways that suppress spontaneous and DNA replication stress-associated DNA damage in human cells. Among the identified genes, GNB1L, which is deleted in the 22q11.2 syndrome, is essential for the biosynthesis of kinases of the ATM/ATR family.
Graphical Abstract

Introduction
To minimize the impact of DNA replication perturbations on the stability of the genome, cells have systems that ensure a robust replication process. For example, stretches of single-stranded DNA (ssDNA) produced following uncoupling of the replicative helicase and DNA polymerases can be sensed by the kinase ataxia telangiectasia and Rad3-related (ATR), which mediates cellular responses to replication stress through the phosphorylation of proteins that include CHK1, RPA, histone H2AX and SMARCAL1.1–4 ATR is recruited to ssDNA via the ATR-interacting protein ATRIP and is activated through TOPBP1- or ETAA1-dependent pathways.5–7 ATR counteracts replication stress at multiple levels, including stabilizing replication forks, regulating DNA replication origin firing, ensuring dNTP availability and mediating cell cycle checkpoint signaling.8
ATR belongs to the family of phosphatidylinositol 3-kinase-related kinases (PIKKs). In mammalian cells, PIKKs have diverse functions in the biology of the DNA damage response (ATR, ATM, DNAPK-cs), cellular metabolism and proliferation (mTOR), nonsense-mediated mRNA decay (SMG1), and transcription control (TRRAP).9,10 PIKKs are large proteins with HEAT repeat-containing N-termini followed by C-terminal kinase domains. The protein stability of PIKKs depends on the chaperone HSP90 and the TELO2-TTI1-TTI2 (TTT) co-chaperone complex11–14. The biogenesis of PIKK complexes is known to be essential for genome stability maintenance.15
We previously undertook the chemogenomic profiling of 27 genotoxic agents using CRISPR/Cas9 genetic screens to identify uncharacterized genome maintenance factors.16 The resulting dataset identified DNA repair factors and new drug mechanisms of action, but we noted an under-representation of essential genes in the dataset. For example, the gene RAD51, which encodes the essential DNA recombinase, was not identified in these screens, most likely because the scoring scheme required single guide (sg) RNA representation in the control (untreated) population. Given that genome stability is an essential cellular process, it is likely that other cell-essential genes with roles in genome maintenance were also missed.
To address this shortcoming, we surmised that a screen performed shortly after gene inactivation and that used a readout that relies on a DNA damage-linked phenotype would allow the capture of essential genes. We established a phenotypic CRISPR/Cas9 screen pipeline that monitors the level of DNA damage and performed screens in two colon epithelial cell lines, either in the absence of treatment or in the presence of the following replication perturbing agents: aphidicolin (Aph), an inhibitor of B family DNA polymerases17; hydroxyurea (HU), an inhibitor of ribonucleotide reductase that causes depletion of the cellular dNTP pool18; and cytarabine (Ara-C), a nucleoside analog that inhibits ribonucleotide reductase activity and blocks DNA replication elongation.19 These screens revealed insights into the processes that protect cells from endogenous DNA damage and identified a number of genes not previously linked to genome maintenance. In particular, we found that the schizophrenia/autism candidate gene GNB1L protects cells from replication catastrophe under mild replication perturbation.20–22 We uncovered that GNB1L promotes the biogenesis of ATR, ATM and other related PIKKs in collaboration with the TTT complex. The dataset generated in this study therefore offers insights into the processes that prevent the induction of DNA damage under unchallenged conditions as well as under DNA replication stress.
Results
Phenotypic CRISPR/Cas9 screens based on γ-H2AX levels
To probe the processes that prevent the formation of DNA damage independently of their impact on cellular fitness, we established a CRISPR/Cas9 screening strategy based on detecting γ-H2AX by flow cytometry23 (Fig 1A). The serine 139 residue of histone variant H2AX is quickly phosphorylated in response to DNA lesions and replication blockage, making it a useful marker of DNA damage.24
Figure 1. Phenotypic CRISPR screens for genes that suppress spontaneous DNA damage.

(A) Schematic of the phenotypic CRISPR screens based on γ-H2AX staining and cell sorting. (B) Manhattan dot plots of γ-H2AX screen results in untreated (UT) RKO TP53−/− cells. The top 15 genes are highlighted. (C) Gene Ontology (GO) analysis of Biological Process for 160 γ-H2AX suppressors in RKO TP53−/− cells, visualized by GO-Figure! (D) STRING network analysis of 138 γ-H2AX suppressors in RKO TP53−/− cells. Pathways were manually curated and labeled with different colors: green, Fe-S cluster assembly; orange, nucleotide biosynthesis; brown, mitochondrial function; yellow, RNA metabolism and transcription; pink, telomere maintenance; purple, DNA repair; blue, DNA replication; red, ATR signaling; grey, others. (E) Distributions of gene essentiality scores (BF values) of γ-H2AX suppressors (brown) and whole genome reference (blue) in RKO TP53−/− cells. Kernel density estimation is used for the probability density function. Dashed lines indicate the median for each population. (F) Distributions of gene essentiality scores of hits from 27 dropout genotoxic screens (brown) and whole genome reference (blue) in RPE-hTERT TP53−/− cells.
We carried out CRISPR/Cas9 screens in the RKO colon carcinoma cell line and an hTERT-immortalized, colon epithelial cell line, referred to here as COL-hTERT. The TP53 gene was knocked out in both cell lines to prevent the potential confounding effects of p53 activation by genotoxic stress. The cell lines are hereafter referred to as RKO TP53−/− and COL-hTERT TP53−/− (Fig 1A). We carried out 4 screens in the RKO TP53−/− cell line: one screen where cells were left untreated and one screen each in which cells were treated with low doses of Aph, HU and Ara-C. The COL-hTERT TP53−/− cell line was only screened in the untreated condition. The screens were carried with the TKOv3 sgRNA library25, and cells with the highest 5% of γ-H2AX fluorescence intensity were sorted. Following sgRNA cassette sequencing, gene-level enrichment scores were computed using MAGeCK comparing sgRNA abundance in the sorted population to that of unsorted cells26 (Figs 1A, B, S1A, S2, Supplementary Table 1).
Suppressors of γ-H2AX in RKO TP53−/− cells
We identified 160 genes whose mutation caused spontaneous high γ-H2AX levels in RKO TP53−/− cells (Supplementary Table 2). This number was obtained by combining 142 genes that scored in the untreated screen with a false discovery rate (FDR) value < 0.05 along with any other gene with FDR values between 0.05 to 0.1 that were also a hit in the drug-treated screens. Gene ontology (GO) analysis of these hits revealed a strong enrichment for terms associated with DNA replication (such as GO:0006260), DNA repair (GO:0006281), iron-sulfur cluster metabolism (GO:0016226), DNA damage signaling (GO:0000076), telomere maintenance (GO:0000723), nucleotide metabolism (GO:0009165) and transcription or splicing (GO:0006366; Fig 1C and Supplementary Table 3). Most of these biological processes are known to promote genome stability, confirming the ability of γ-H2AX screens to probe pathways involved in genome maintenance.
Gene-level analysis using STRING27 mapped 138 of 160 genes into a network characterized by 4 connected subnetworks enriched in distinct biological processes (Fig 1D). Manual curation of the network nodes revealed a major and dense subcluster of genes with roles in DNA replication, DNA repair, telomere maintenance, and ATR signaling. We also identified subclusters of genes that are involved in nucleotide biosynthesis, RNA metabolism and transcription, as well as iron-sulfur (Fe-S) cluster assembly (Fig 1D).
Inspection of the gene list revealed the presence of many essential genes, such as those encoding components of the replicative CMG helicase (GINS1–4, MCM2–6) and replisome proteins (POLA1, POLD1, POLE, PRIM1, etc.). This observation suggested that the γ-H2AX screens succeeded in identifying essential genes. To explore this possibility further, we plotted the Bayes factor (BF) values of the 160 genes and compared them with the BF value distribution of all genes included in the TKOv3 library. BF values represent the likelihood of gene essentiality, with positive BF values indicating probable essential genes.28 The distribution of the 160 genes is remarkably shifted to large positive BF values (median value: 64) compared to the median of all genes (−29; Fig 1E). This is consistent with the notion that genes required to prevent endogenous DNA damage are essential for cell survival. In contrast, analysis of gene hits from our previous fitness-based chemogenomic screens16 showed both a distribution and a median BF value similar to that of the library (Fig 1F). These results indicate that the phenotype-based γ-H2AX screens did probe the contribution of essential genes to genome maintenance.
Suppressors of γ-H2AX in COL-hTERT TP53−/− cells
Analysis of the single screen undertaken in COL-hTERT TP53−/− cells identified 95 genes whose mutation causes elevated γ-H2AX levels (at FDR < 0.25; Supplementary Table 2). We employed a more relaxed FDR threshold for this screen because of a lower number of replicates undertaken. GO analysis and network-based representation using STRING showed a similar set of pathways involved in preventing spontaneous γ-H2AX, including DNA replication and iron-sulfur cluster assembly (Fig S1B, C and Supplementary Table 3). Interestingly, this analysis also identified a unique cluster of genes involved in mitochondrial respiration (such as GO:0042775), suggesting that this pathway contributes to genome stability in this cell line. Similarly, analysis of BF values distribution indicated that suppressors of spontaneous γ-H2AX formation in COL-hTERT TP53−/− cells are also enriched in essential genes (Fig S1D).
A total of 32 genes increased γ-H2AX levels in both cell lines when disrupted (Fig S1E). Using a hypergeometric distribution, the probability of having 32 genes co-occurring by chance alone is 1 × 10−42. Among such genes are those encoding the PRMT5-WDR77 complex, a cancer drug target29, and multiple genes coding proteins involved in nucleotide metabolism and Fe-S cluster assembly. Together, these results suggest that there are both universal and cell type-restricted genes that prevent spontaneous DNA damage formation, similar to what has been observed with gene essentiality.30
Validation of genes that prevent endogenous DNA damage
To visualize results at the gene level, we employed radar plots where gene ranking is plotted across the 5 screens. For example, disruption of CIAO1, which encodes a protein involved in Fe-S cluster incorporation31, caused high levels of γ-H2AX in 4 of 5 screen conditions, and disruption of CFAP298 led to high γ-H2AX levels in 3 of 4 screens performed in RKO TP53−/− but not in COL-hTERT TP53−/− cells (Fig 2A, B). CFAP298 is an example of a gene not previously linked to genome maintenance. Mutations in CFAP298 cause primary ciliary dyskinesia, implicating its product in motile cilium function by acting on the outer dynein arm assembly.32
Figure 2. Characterization of genes that prevent spontaneous DNA damage.

(A) Radar plot showing the ranking of CIAO1 in the five γ-H2AX screens. Custom scaling was used for five rings: 1, 10, 100, 1000, 18052, and linear scaling was used within each section. The grey shaded area indicates the top 100 ranking in each screen. (B) Radar plot showing the ranking of CFAP298 in five screens. (C) Flow cytometry analysis of RKO TP53−/− cells infected with lentiviruses expressing the indicated sgRNA. Left, representative plots. Red numbers indicate the percentage of γ-H2AX positive cells. Right, quantification of the experiment shown on the left. Bars represent the mean ± s.d. (n=3). Comparisons are made to the sgAAVS1 control, using an unpaired t-test. (D) Immunofluorescence analysis of cells described in (C) with γ-H2AX and 53BP1 antibodies. The images presented are representative of three immunostainings. Dashed lines indicate the nuclear area determined by DAPI staining. (E) Quantification of mean γ-H2AX intensity (left), mean γ-H2AX focus number (middle) and mean 53BP1 focus number (right) of three independent experiments as shown in (D). Each experiment includes a minimum of 500 cells for analysis. Bars represent the mean ± s.d. Comparisons were made to the sgAAVS1 condition using an unpaired t-test. A.U., arbitrary units.
To validate the results obtained in unchallenged RKO TP53−/− cells, we selected 5 genes whose mutation increases γ-H2AX levels: the aforementioned CIAO1 and CFAP298 genes (Fig 2A, B), the gene encoding the AP-2 complex component AP2S1, the gene coding for the transferrin receptor TFRC involved in iron uptake and GART, which codes for an enzyme involved in de novo purine biosynthesis (Fig S3). Using independent sgRNAs, we observed that disruption of all five genes caused a higher γ-H2AX signal compared to the AAVS1-targeting sgRNA control, confirming the screen results (Fig 2C). Examination of the γ-H2AX subnuclear localization using immunofluorescence microscopy revealed varied staining patterns for γ-H2AX and for 53BP1, a marker of DNA double-strand breaks (DSBs; Fig 2D, E). These results suggest that these genes impact genome maintenance via distinct mechanisms. For example, disruption of CFAP298 caused mainly γ-H2AX and 53BP1 subnuclear foci, which are indicative of DSBs. In contrast, sgRNAs targeting AP2S1 and TFRC induced a pan-nuclear γ-H2AX signal with little increase in foci, suggesting DNA replication stress rather than DSBs. Depletion of CIAO1 and GART produced both pan-nuclear and focal staining of γ-H2AX, suggesting that these genes guard against replication stress and DSB formation.
Validation of genes that prevent replication-associated DNA damage
To identify genes that protect cells against replication stress-induced DNA damage, we searched for genes that increased γ-H2AX levels specifically under conditions when cells were treated with DNA replication inhibitors. This analysis identified 227 genes (Supplementary Table 2), and we subjected the following genes to validation using independent sgRNAs: PGD, which encodes the enzyme 6-phosphogluconate dehydrogenase, the third enzyme in the oxidative pentose phosphate pathway that converts 6-phosphogluconate to ribulose 5-phosphate and produces NADPH 33 (Fig 3A); DDX5, encoding an RNA helicase involved in splicing and transcription regulation 34,35 (Fig 3B); DDX46, coding for an RNA helicase that is essential for spliceosome assembly and proofreading of the branch site36 (Fig 3C); ZNHIT1, which promotes histone H2A.Z chromatin incorporation to regulate gene expression via its role with the SRCAP complex37,38 (Fig 3D); BRAP, which encodes a regulator of Ras signaling and cell cycle control39,40 (Fig S3K); and GAS6, coding for a ligand of TAM receptors41 (Fig S3L). Four of the six genes tested (PGD, DDX5, DDX46, ZNHIT1) showed replication stress-dependent induction of γ-H2AX, with loss of DDX5 causing a remarkably selective increase in γ-H2AX following Ara-C treatment (Fig 3B). As DDX5 resolves R-loops42, one possibility is that DDX5-dependent R-loop resolution protects cells from Ara-C-induced DNA damage.
Figure 3. Validation of genes that suppress replication-associated DNA damage.
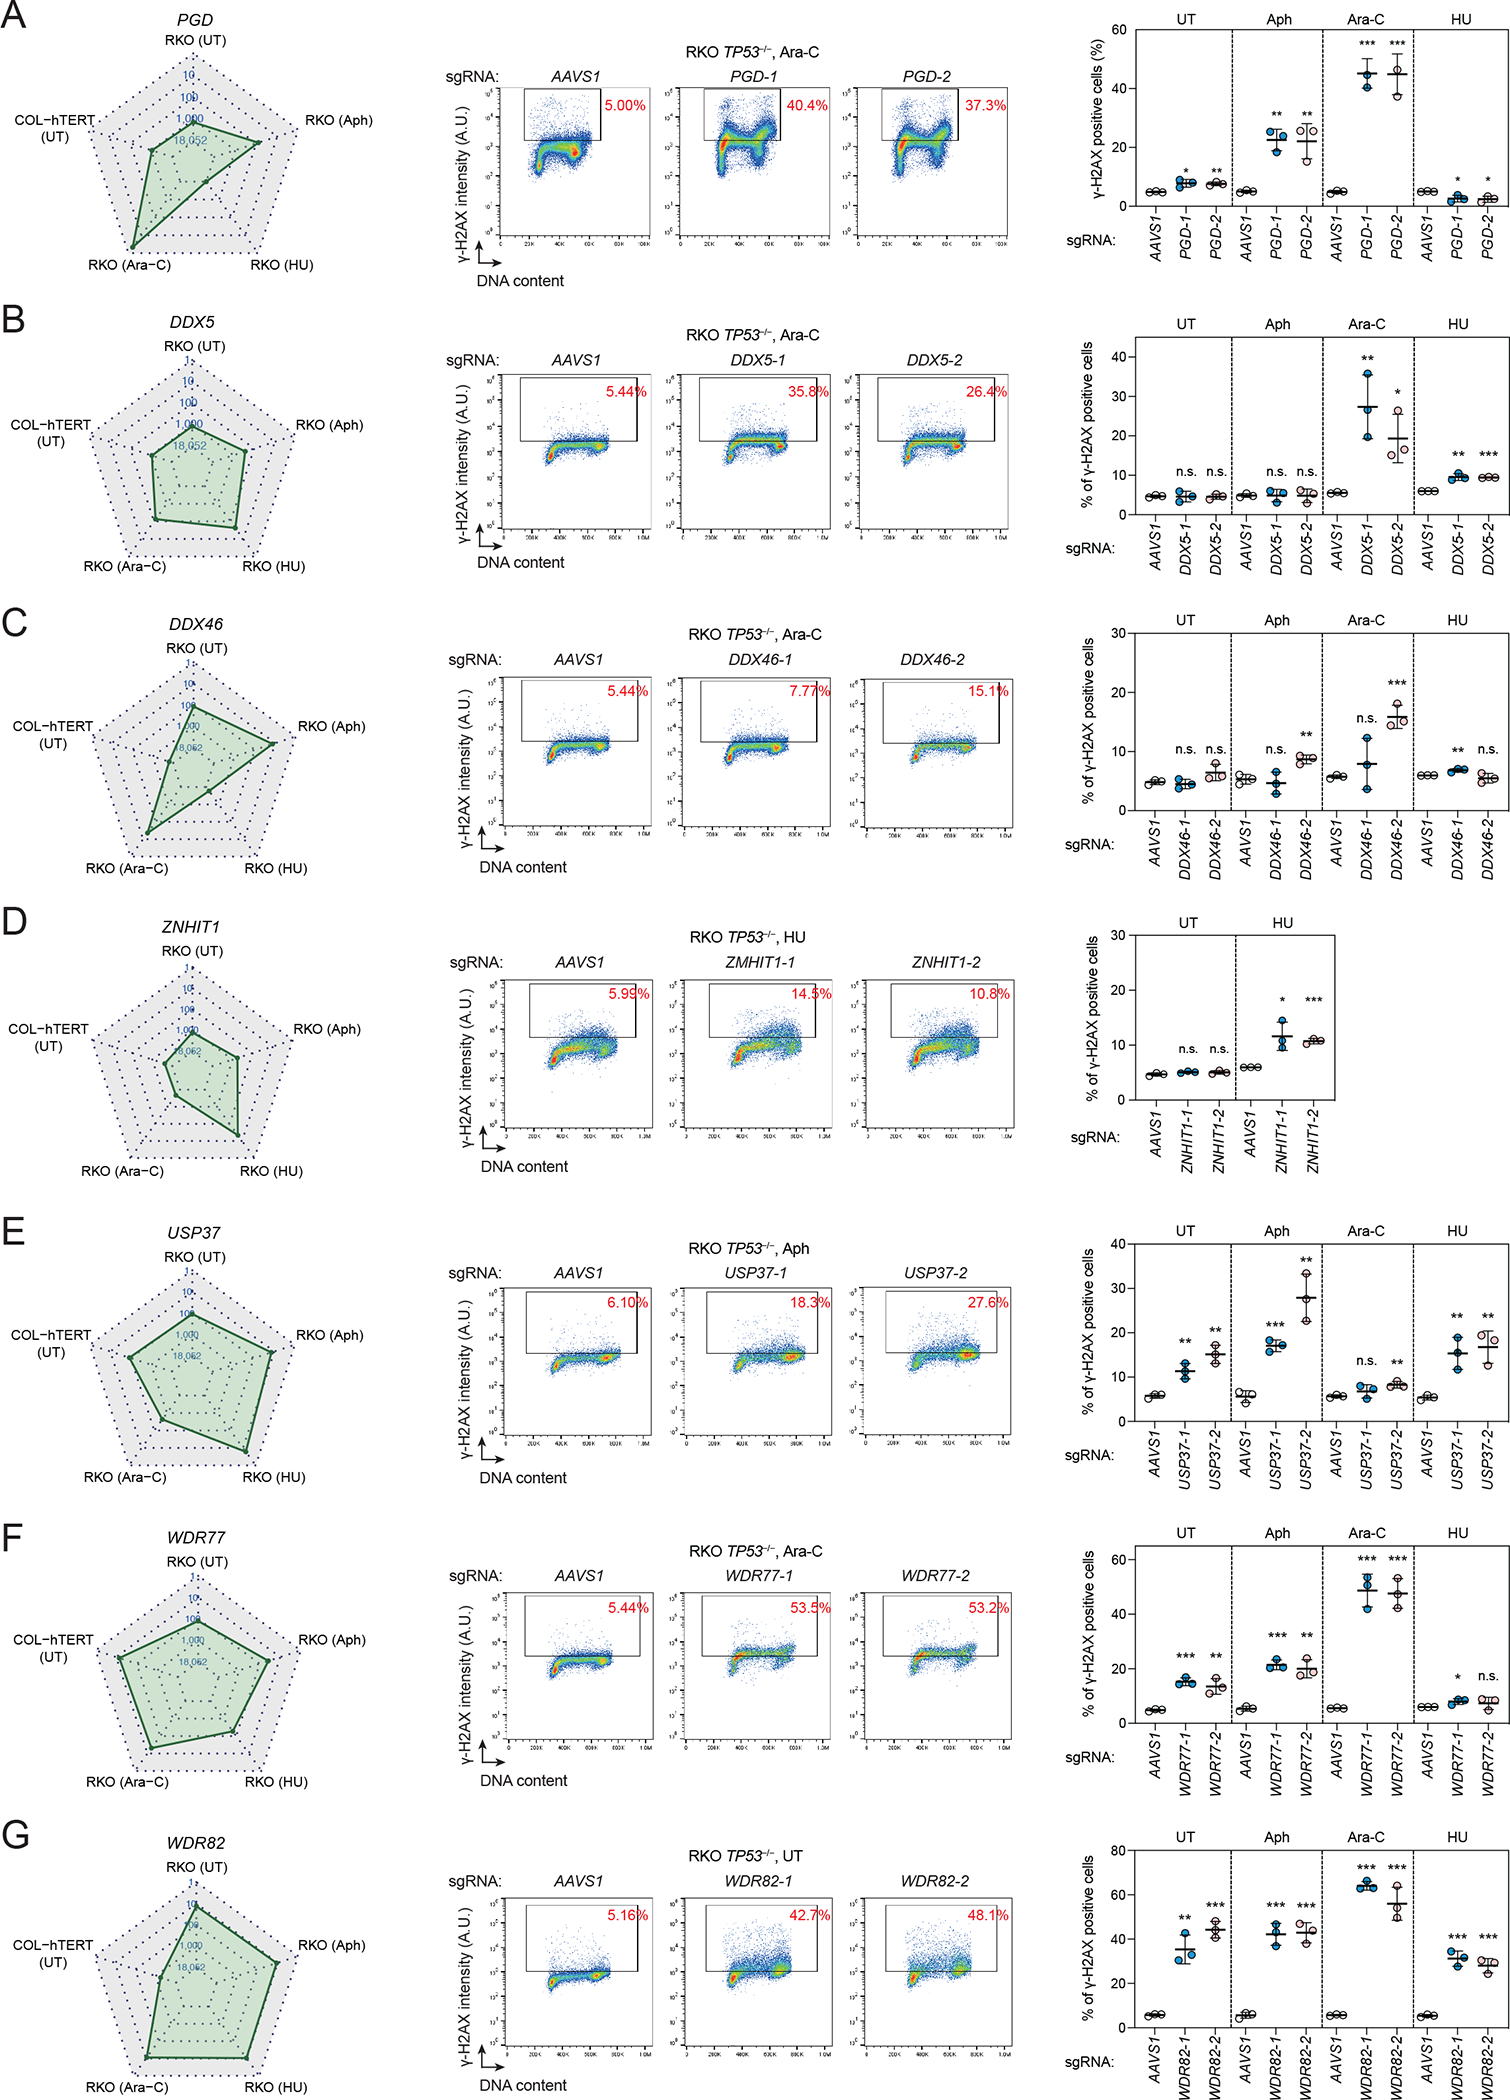
(A)-(G) Validation of the screens. Left, the radar plot showing the ranking of each gene in five screens. Middle, representative flow cytometry plots of RKO TP53−/− cells expressing the indicated sgRNA. Cells were treated with the indicated replication inhibitor for 24 h or left untreated (UT). 300 nM Aph, 200 nM Ara-C, and 200 μM HU were used in this experiment, and the same drug concentrations were used for subsequent experiments unless otherwise specified. Right, quantification of γ-H2AX positive cells in all conditions. Bars represent the mean ± s.d. (n=3). Comparisons are made to the sgAAVS1 control within each treatment condition using an unpaired t-test. The Ara-C experiments in (B), (C) and (F) were performed simultaneously with the same sgAAVS1 control.
We also validated three genes that prevent high γ-H2AX levels in both the untreated condition and conditions with replication stressing agents: USP37, which encodes a deubiquitinase possibly involved during DNA replication43,44 (Fig 3E); WDR77, coding for a component of the PRMT5-WDR77 methylosome45 (Fig 3F); and WDR82, which encodes a member of the SET1 methyltransferase complex46 (Fig 3G). Together, this validation effort suggests that the γ-H2AX screen dataset can be mined for genes and pathways that promote genome integrity. Below we highlight a few genes identified in the screens, along with a deeper characterization of GNB1L.
FANCJ protects cells from Aph-induced replication stress
FANCJ (also known as BACH1 or BRIP1) was a top-ranking gene in the Aph γ-H2AX screen (Fig 4A). FANCJ is a well-characterized DNA helicase first identified as a BRCA1-interacting protein.47 We confirmed that cells expressing FANCJ-targeting sgRNAs display a large increase in γ-H2AX following Aph treatment, with a comparatively smaller increase following Ara-C treatment (Fig 4A). Interestingly, a parallel CRISPR/Cas9 fitness screen in RKO TP53−/− cells identified sgRNAs targeting FANCJ as the top sensitizer to a low-dose Aph treatment (Fig S4A), indicating that FANCJ plays a key role in mitigating the impact of DNA polymerase inhibition in human cells.
Figure 4. FANCJ protects cells from Aph-induced replication stress.

(A) Left, radar plot showing the ranking of FANCJ in the five γ-H2AX screens. Middle, flow cytometry analysis of RKO TP53−/− cells expressing the indicated sgRNA. Right, quantification of γ-H2AX positive cells in all four conditions. Bars represent the mean ± s.d. (n=3). Comparisons are made to the sgAAVS1 control within each treatment condition using an unpaired t-test. (B) Immunoblot analysis of FANCJ expression in RKO TP53−/− parental (WT) and FANCJ-KO cells. α-actinin was used as a loading control. (C) Aph dose-response assays using confluency as a readout 6 d post-treatment. Bars represent the mean ± s.d. (n=3). (D) Left, immunofluorescence analysis of γ-H2AX and chromatin-bound RPA2. Right, quantification of normalized mean intensities of γ-H2AX and RPA2. Bars represent the mean ± s.d. (n=3). Results of unpaired t-test between WT and FANCJ-KO cells are shown. A.U., arbitrary units. (E), (F) Recovery assay from Aph treatment. Cells were left untreated (−) or treated with 300 nM Aph for 24 h, then released into cell growth medium without the drug for the indicated time before harvesting. (E) Immunoblot analysis using the indicated antibodies. α-actinin, loading control. (F) Cell cycle distributions as determined by DAPI staining. UT, untreated. Brackets indicate S-phase cells. (G) Schematic of DNA fiber experiments. (H) Quantification of IdU/CIdU ratio. Each dot represents one fiber; at least 120 fibers are quantified from three independent experiments. Red bars represent the median. Results of the unpaired t-test are shown. (I) Model of FANCJ at the DNA replication fork.
We next generated CRISPR knockout (KO) clones of FANCJ in RKO TP53−/− cells (Fig 4B) that were hyper-sensitive to Aph, as expected (Fig 4C). Under Aph challenge, FANCJ-KO cells accumulate in S phase (Fig S4B) and show a striking increase in pan-nuclear γ-H2AX staining accompanied by a concomitant increase in chromatin-bound RPA2, which is part of the ssDNA-binding complex RPA (Fig 4D). These results suggest that FANCJ loss causes widespread replication perturbation characterized by the generation of ssDNA.
The formation of ssDNA in FANCJ-KO cells following a 24 h Aph treatment was accompanied by increased ATR signaling, as monitored through CHK1-S345 and RPA2-S33 phosphorylation (Fig 4E) that gradually decreased to reach baseline levels 8 h post-Aph washout. Similarly, the striking S-phase accumulation of FANCJ-KO cells in the presence of low-dose Aph was resolved within 8 h, with cell cycle profiles becoming undistinguishable from parental cells (Fig 4F). These observations suggest that the DNA lesions in FANCJ-KO cells are largely reversible, although some lesions must persist to cause the hypersensitivity of FANCJ-KO cells to Aph treatment.
The ssDNA accumulation in FANCJ-KO cells under Aph treatment could be either in the form of ssDNA gaps or long ssDNA tracts. To discriminate between these possibilities, we performed DNA fiber experiments with or without S1 nuclease, which converts ssDNA gaps to DSBs48 (Fig 4G, H). In the absence of S1 nuclease, FANCJ-KO cells had shorter IdU tracts than WT cells under Aph treatment, consistent with a slower proliferation rate (Fig 4C). The S1 nuclease treatment led to shorter IdU tracts in the parental cells, indicating the presence of ssDNA gaps. However, the S1 nuclease did not further shorten IdU tracts in FANCJ-KO cells, suggesting either that the ssDNA gaps were generated in a FANCJ-dependent manner, as in49,50, or that ssDNA in FANCJ-KO cells was in the form of longer ssDNA tracts (Fig 4G, H, I).
In budding yeast, ssDNA is repaired following recruitment of translesion synthesis (TLS) polymerases51 in a PCNA ubiquitylation-dependent manner.52 We monitored monoubiquitylation of PCNA Lys164 after Aph treatment and release, and observed that FANCJ-KO cells displayed a transient increase in PCNA ubiquitylation that peaked 1 h post-release (Fig 4E). These observations suggest that under Aph challenge, FANCJ-deficient cells accumulate ssDNA tracts that may be reversed in part by the action of TLS polymerases.
The γ-H2AX accumulation displayed by FANCJ-KO cells during Aph treatment is rescued by lentiviral expression of wild-type FANCJ (Fig S4C–E). This allowed us to functionally profile the following FANCJ mutants: K52R, which disrupts helicase activity47; K141A/K142A, which impairs interaction with MLH153; S990A, which abolishes interaction with BRCA154; and T1133A, which blocks binding to TOPBP155. Reintroduction of these mutants, with the notable exception of FANCJ-K52R, completely suppressed γ-H2AX accumulation in the presence of Aph (Fig S4C–E). Identical results were obtained in RPE1-hTERT cells where the FANCJ mutations were introduced at the chromosomal locus via gene editing (Fig S4F, Supplementary Table 4). These results suggest that the FANCJ helicase activity, but not its roles in ICL repair, HR or DNA damage signaling, is essential to protect cells from DNA replication stress. We surmise that under conditions of perturbed replication, such as under Aph challenge, FANCJ resolves DNA obstacles with its helicase activity, thereby allowing DNA synthesis to bypass the obstacle and generating the ssDNA gap that can be repaired later (Fig 4I).
DERA protects cells from Ara-C
DERA was a top-ranking gene in the Ara-C γ-H2AX screen, which we validated with independent sgRNAs (Fig 5A). DERA is a deoxyribose phosphate aldolase, which participates in nucleotide catabolism and the pentose phosphate pathway.56 DERA is specifically required to prevent DNA damage induced by Ara-C but not by Aph or HU (Fig 5A), and DERA-targeting sgRNAs impair cell proliferation in the presence of low-dose Ara-C but not in untreated cells (Fig 5B). Introduction of wild-type DERA in DERA-depleted cells, but not a catalytic-dead (K254A) variant, restored normal γ-H2AX levels following Ara-C treatment, suggesting that the aldolase activity of DERA prevents DNA damage formation (Fig 5C, D). We also assessed γ-H2AX formation in response to two other related nucleoside analogs, gemcitabine or fludarabine (Fig 5E, F). Ara-C and fludarabine share an arabinose backbone but differ by the nitrogenous base, whereas gemcitabine and Ara-C share the cytosine base but differ in their sugar moieties (Fig 5E). We found that DERA-deficient cells display higher γ-H2AX levels following treatment with fludarabine but not gemcitabine (Fig 5F), suggesting that DERA specifically protects cells from arabinoside analogs. While we have not determined the exact mechanism of action of DERA on Ara-C, we anticipate that it may relate to the action of DERA on a cytarabine metabolite, possibly 5-deoxyarabinose-phosphate.56
Figure 5. DERA protects cells from Ara-C.

(A) Left, radar plot showing the ranking of DERA in the five γ-H2AX screens. Middle, flow cytometry analysis of RKO TP53−/− cells expressing the indicated sgRNA. Right, quantification of γ-H2AX positive cells in all four conditions. Bars represent the mean ± s.d. (n=3). Comparisons are made to the sgAAVS1 control within each treatment condition using an unpaired t-test. (B) Proliferation curves of RKO TP53−/− cells expressing sgAAVS1 control or sgDERA in the presence of 80 nM Ara-C. Confluency is normalized to the untreated condition for each genotype. Data is presented as mean ± s.d. (n=3). (C) Flow cytometry analysis of sgDERA-expressing cells complemented with sgRNA-resistant wildtype (WT) or catalytic dead (K254A) mutant of DERA. Cells were treated with 200 nM Ara-C for 24 h. Left, representative flow cytometry plots. Right, quantification of γ-H2AX positive cells. Bars represent the mean ± s.d. (n=3). Comparisons are made to the sgAAVS1 control using an unpaired t-test. (D) Immunoblot analysis of DERA expression in cells described in (C). α-actinin, loading control. (E) Chemical structures of cytarabine (Ara-C), gemcitabine, and fludarabine. (F) Flow cytometry analysis of sgAAVS1 or sgDERA-expressing cells treated with 20 nM gemcitabine or 5 μM fludarabine for 24 h. Bars represent the mean ± s.d. (n=2).
RECQL5 protects cells from replication-associated DSBs
RECQL5 is representative of a gene whose mutation increased γ-H2AX levels under the three types of DNA replication stress tested (Fig S5A). RECQL5 encodes a RecQ-type 3’-5’ DNA helicase implicated in DNA repair and replication.57 Independent sgRNAs targeting RECQL5 caused increased γ-H2AX in response to Aph, HU or Ara-C compared to controls, confirming the screen results (Fig S5A). RECQL5-deficient cells accumulated γ-H2AX and 53BP1 foci following Aph treatment, suggesting the formation of DSBs (Fig S5B). A clonal knockout of RECQL5 also showed elevated γ-H2AX levels following Aph treatment, a phenotype that we could suppress by reintroducing RECQL5 with lentiviral transduction (Fig S5C, D). This system allowed us to test RECQL5 variants that disrupt either its helicase activity (K58R), its phosphorylation by CDK1 (S727A) or its interaction with RAD51 (F666A) or RNA polymerase II (RNAPII; E584D).57–59 To our surprise, every RECQL5 point mutant complemented RECQL5-KO cells to the same extent as wild-type RECQL5 (Fig S5C–E). To narrow down the RECQL5 domain involved in suppressing Aph-induced H2AX phosphorylation, we tested a series of RECQL5 truncation mutants and found that a RECQL5 C-terminal region (residues 491–991) was both sufficient and necessary for full suppression of the γ-H2AX phenotype (Fig S5F–H). These results suggest that both the internal RNAPII interaction domain (IRI, located between the 491–620 residues) and the SET2-RPB1-interacting domain (SRI, 901–991) participate in the suppression of DSB formation following replication stress (Fig S5E).
GNB1L prevents replication catastrophe under mild replication stress
Disruption of GNB1L caused high γ-H2AX levels following treatment with replication inhibitors, with a particularly strong response in the HU screen (Fig 6A). GNB1L was of particular interest since it has been repeatedly linked to schizophrenia and autism in genetic association studies.20,22,60 GNB1L encodes a protein of unknown function consisting of seven predicted WD40 repeats.61,62
Figure 6. GNB1L protects cells under replication stress and promotes PIKK protein stability.

(A) Radar plot showing the ranking of GNB1L in five screens. (B) Representative flow cytometry analysis of RKO TP53−/− cells expressing the indicated sgRNA. Cells were treated with the indicated replication inhibitor for 24 h or left untreated (UT), then fixed and stained with a γ-H2AX antibody and DAPI. (C) Quantification of the experiment shown in (B). Bars represent the mean ± s.d. (n=3). Comparisons are made to the sgAAVS1 control within each treatment condition using an unpaired t-test. (D) QIBC analysis of γ-H2AX and chromatin-bound RPA2 signal intensities in RKO TP53−/− cells. Cells were treated with 200 μM HU or 250 nM CD437 for 24 h, then extracted, fixed and stained with antibodies to γ-H2AX and RPA2. Red numbers indicate the percentage of cells with high γ-H2AX and high RPA2 signal for each condition. A.U., arbitrary units. (E) Immunoblot analysis of PIKKs in lysates from RKO TP53−/− and RPE-hTERT TP53−/− cells expressing sgAAVS1 control or sgGNB1L. α-actinin, loading control. Asterisk denotes non-specific bands. (F) Immunoblot analysis of PIKKs in lysates from RKO TP53−/− cells expressing the indicated sgRNA. (G) Quantitative RT-PCR experiments to detect the mRNA levels of ATM, ATR, and DNA-PKcs using TaqMan assays. Bars represent the mean ± s.d. (n=3). Comparisons are made to the sgAAVS1 control using an unpaired t-test.
RKO TP53−/− and RPE1-hTERT TP53−/− cells expressing GNB1L-targeting sgRNAs display a massive increase in γ-H2AX in S-phase cells, specifically under conditions of mild replication stress (Figs 6B, C and S6A). This γ-H2AX induction was reminiscent of replication catastrophe, a condition caused by extensive ssDNA that triggers exhaustion of the RPA pool, leading to unprotected ssDNA and subsequent DSB formation.63 GNB1L loss also greatly potentiated γ-H2AX induction under low doses of CD437, a DNA polymerase α inhibitor64 that is particularly efficient at eliciting replication catastrophe65 (Figs 6B, C and S6A). Quantitative image-based cytometry (QIBC) monitoring H2AX phosphorylation and the extent of RPA-bound ssDNA indicated that GNB1L depletion caused the accumulation of cells with both high γ-H2AX and chromatin-bound RPA signals under mild replication stress (Figs 6D and S6B), a phenotype that could be rescued by inhibiting origin firing with CDK2 or CDC7 inhibitors (PF-06873600 and TAK-931, respectively; Figs S6B, C). Together, these results indicate that GNB1L guards against DNA replication catastrophe. Consistent with this, GNB1L-deficient cells display impaired proliferation in the presence of HU or gemcitabine (Fig S6D).
GNB1L interacts with PIKKs and the TTT complex
To gain insights into the mechanism by which GNB1L protects cells under replication stress, we searched for interacting proteins with affinity purification coupled to mass spectrometry (AP-MS) and proximity-based interaction proteomics using the miniTurbo system.66 After filtering hits with SAINT67, TELO2 was the only high-confidence protein interacting with GNB1L in the AP-MS experiment (Fig S7A and Supplementary Table 5). In contrast, proximity interaction proteomics not only retrieved TELO2 but also identified TTI1 and all six members of the PIKK family (DNA-PKcs, ATM, ATR, mTOR, SMG1 and TRRAP; Fig S7A and Supplementary Table 5). Streptavidin pulldowns followed by immunoblotting in cells expressing miniTurbo-tagged GNB1L (Fig S7B) confirmed that the TTT complex and each PIKK protein reside in the proximity of GNB1L. Similarly, the same proteins, except SMG1, could be retrieved in GNB1L immunoprecipitates, suggesting more intimate interactions than anticipated from the AP-MS experiment (Fig S7C). Finally, we used the NanoBRET assay68 to confirm a physical interaction between GNB1L and TELO2 in cells (Fig S7D).
GNB1L promotes PIKK protein biogenesis
The identification of TTT, RUVBL1/2 and PIKKs as GNB1L-interacting proteins was revealing because the replication catastrophe seen in GNB1L-deficient cells is a phenocopy of ATR loss or inhibition.63 Given that TTT and RUVBL1/2 promote ATR (and PIKK) biogenesis, these results suggested that GNB1L may also participate in the same process. Indeed, transduction of GNB1L-targeting sgRNAs caused a reduction in the steady-state levels of all PIKKs, with the DNA damage-related factors, ATM, ATR and DNA-PKcs being the most affected (Fig 6E). The reduction in PIKK levels was similar to that observed in cells depleted of TTT complex members (Figs 6F and S7E), which also caused a replication catastrophe-like phenotype under replication stress (Fig S7F). The reduced PIKK levels in GNB1L-depleted cells were not due to reduced mRNA levels, at least for the 3 PIKKs tested (Fig 6G). To assess if the reduction of PIKKs impaired function, we assessed the integrity of ATM, ATR and mTOR signaling by immunoblotting. Substrate phosphorylation by ATR, ATM, and mTOR was compromised in GNB1L-depleted cells after stimulation (Fig S7G). Together, these results indicate that GNB1L promotes the biogenesis of functional PIKK proteins.
TELO2 stabilizes newly synthesized but not pre-existing PIKKs.12 To test whether GNB1L promotes the biogenesis of newly synthesized PIKKs, we first generated a cell line in which the GNB1L protein can be rapidly depleted using the dTAG system69,70 (Fig S8A). Over time, GNB1L depletion caused a reduction in the protein levels of ATM, ATR, DNA-PKcs, and sensitized cells to replication catastrophe (Fig S8A, B). To monitor ATR biogenesis, we expressed Halo-tagged ATR, which enabled us to follow the abundance of newly synthesized or pre-existing ATR using label-switch strategies (Fig S8C, D). We found that GNB1L depletion selectively impacted the accumulation of newly synthesized ATR (Fig S8C, D). We conclude that GNB1L, like TELO2, promotes the biogenesis of newly synthesized PIKKs, including that of ATR.
Deep mutational scanning of GNB1L
The observation that GNB1L is predicted to form a single WD40 repeat propeller as a folded unit suggested that deletion mutagenesis to identify functionally important regions of GNB1L would be impossible. As an alternative, we applied deep mutational scanning to identify variants of GNB1L that promote replication catastrophe.71 We constructed a lentiviral GNB1L mutant library of 5529 mutants in which GNB1L is expressed as a C-terminal GFP fusion (Fig S9A). After library transduction, we sorted for GFP-positive cells to remove variants that caused loss of GNB1L expression. Endogenous GNB1L was then inactivated with an sgRNA. The resulting pool of cells was treated with HU and subsequently sorted for cells with high γ-H2AX (Fig. S9A). Mutant frequency was determined using Tileseq.72,73 A “functional” score was assigned to each mutant (Supplementary Table 6), where mutations enriched in the high γ-H2AX population were assigned low functional scores.
To validate this analysis, we examined the relationship between the median functional score for each GNB1L residue and a corresponding median change in Gibb’s free energy (ΔΔG) computed with FoldX74 (Fig S9B and Supplementary Table 6). We observed an inverse correlation between functional scores and the median ΔΔG (Pearson correlation −0.61), suggesting that substitutions that perturb folding are functionally impaired, as expected. Similarly, using conservation computed with ConSurf (Fig S9B and Supplementary Table 6), where negative values indicate conservation, we observed a positive correlation between functional and conservation scores (Pearson correlation 0.58). Together, these analyses indicate that our mutational scanning pipeline is effective at identifying variants that impair GNB1L function.
We next mined this dataset to identify variants with low-to-medium ΔΔG scores (i.e. minimal impact on protein folding) but that negatively impact GNB1L function. We selected 6 high-confidence variants for retesting: S42L, G43M, A271E, G272R, D274G and D315R (Supplementary Table 6). Reintroduction of each variant failed to rescue HU-induced γ-H2AX levels, indicating they were all functionally defective (Fig S9C, D). While the expression of these GNB1L variants was lower than that of exogenously expressed GNB1L, they were all expressed at levels higher than endogenous GNB1L in the parental cell line (Fig S9C), displayed lower levels of ATM, ATR and DNA-PKcs proteins (Fig S9C) and all were impaired in their interaction with TELO2 and ATM (Fig S9E), suggesting that the integrity of the GNB1L-TELO2 complex is critical for PIKK biogenesis. Exactly how these mutations impact GNB1L function is unclear but as they are not concentrated on any one area of the proteins, we surmise that a subset of them act by subtly destabilizing GNB1L.
GNB1L-TELO2 promotes PIKK levels
In parallel, we mapped the region of TELO2 involved in its interaction with GNB1L. The region of TELO2 that is necessary and sufficient to interact with GNB1L is encompassed by residues 460–545 (Figs 7A and S10A, B), consistent with an AlphaFold2 model of the GNB1L-TELO2 complex that identified a TELO2 loop encompassing these residues as directly interacting with GNB1L75 (Fig 7B, S10C, D, and Supplementary Table 7). Alanine scanning of this region identified a TELO2 mutant we designated as M2 (498YMDS501-AAAA) that was completely deficient in GNB1L binding, in protecting cells against replication catastrophe, and which displayed impaired PIKK levels (Fig 7C, D). This was in contrast to the corresponding single point mutants, which were impaired in TELO2 binding but displayed both normal PIKK levels and responses to CD437 treatment (Fig S10E–G). These results indicate that a minimal TELO2-GNB1L interaction is both sufficient and necessary for PIKK stability and guards against replication catastrophe.
Figure 7. GNB1L-TELO2 interaction promotes PIKK levels.

(A) Left, Schematic of TELO2 truncations and mutations. Right, Flag immunoprecipitation in lysates of 293T cells expressing full length (FL) or mutant 3xFlag-TELO2 and probed for GNB1L. (B) Left, AlphaFold2-predicted structure of full-length GNB1L binding to a TELO2 fragment (residues 460–640). Purple, surface structure of GNB1L. Beige, ribbon structure of the TELO2 fragment. Right, magnified view of binding surface. Residues 498–501 of TELO2 are labeled and highlighted in green. (C), (D) RKO TP53−/− cells were infected with lentiviruses expressing sgTELO2 and sgRNA-resistant TELO2 variant constructs as indicated. WT, wild type. (C) Immunoblot analysis of cell lysates with the indicated antibodies. α-actinin, loading control. (D) Cells were treated with 250 nM CD437 for 24 h, then fixed and stained with a γ-H2AX antibody and DAPI. Red numbers indicate the percentage of γ-H2AX positive cells. The results are representative of two independent experiments. A.U., arbitrary units.
Discussion
This work presents a genome-scale survey of the genes and pathways that protect cells against DNA damage using H2AX phosphorylation as a readout. This dataset can be mined for the identification of genes not previously associated with genome maintenance. For example, we identified CFAP298, a gene previously linked to ciliogenesis32, as suppressing the formation of spontaneous DSBs.
One of the most surprising findings of this study was that the genes suppressing spontaneous DNA damage were functionally enriched in only a handful of biological processes. Those include DNA replication, DNA repair, RNA metabolism and a few biosynthetic pathways such as nucleotide metabolism and Fe-S cluster biogenesis. These results may imply that the genome is insulated from a majority of cellular processes, which would effectively minimize the impact of their dysfunction on the integrity of the genome.
Among the genes that suppress spontaneous γ-H2AX formation in RKO TP53−/− cells, 14 encode proteins participating in Fe-S cluster assembly and three (AP2S1, TFRC, FCHO2) code for factors involved in iron uptake by endocytosis. This observation further highlights a key role of iron metabolism in genome stability, which can be explained by the fact that many DNA replication and repair proteins require a Fe-S cluster as their cofactor.76 Furthermore, while mitochondrial dysfunction is often assumed to cause nuclear DNA damage solely due to oxidative stress,77 defective Fe-S cluster assembly may be another important mitochondrial source of nuclear genome damage. This is consistent with work done in yeast that linked genome instability caused by age-related mitochondrial dysfunction to defective Fe-S cluster assembly.78 These observations also suggest that modulating iron uptake or Fe-S cluster assembly could be used to induce DNA damage for therapeutic purposes but such strategies would need to be optimized to avoid an impact on physiological processes that require iron uptake, such as erythropoiesis.
Our structure-function studies indicate that the roles of RECQL5 and FANCJ in suppressing replication-associated DNA damage may be distinct from some of their better-described functions. However, as the motor/helicase activity of FANCJ was the sole activity necessary to suppress ssDNA accumulation in response to Aph treatment, our results are clearly consistent with the recently described model of FANCJ action at forks stalled with DNA-protein crosslinks.79 FANCJ uses its motor activity in concert with RTEL1 to overcome the barrier to leading-strand replication. Interestingly, RTEL1 drives the formation of an ssDNA substrate by translocating on the undamaged strand, and we predict that in the absence of FANCJ, RTEL1 action may result in the long ssDNA tracts we have observed in FANCJ-KO cells.
Finally, we describe GNB1L as a PIKK biogenesis factor that cooperates with the TTT-RUVBL1/2 co-chaperone complex. In budding yeast, the Tel2-Tti1-Tti2 complex promotes the protein stability of the homologs of ATR and ATM (Mec1 and Tel1, respectively) through an Asa1-dependent pathway.80 Asa1 is a WD40 repeat protein with limited homology to GNB1L, but as noted previously,81 GNB1L likely represents the Asa1 homolog in vertebrates. Since GNB1L haploinsufficiency is a candidate gene for the neuropsychiatric disorders associated with the 22q11.2 deletion syndrome20–22,60,61, it is likely that defective PIKK biogenesis contributes to the pathophysiology of this disorder. In support of this possibility, mutations in TELO2 and TTI2 also cause intellectual disability disorders.82,83
In addition to GNB1L, TELO2 also interacts with the PIH1D1 and RPAP3 proteins, which have also been implicated in PIKK biogenesis.14 PIH1D1 binds to the same region of TELO2 that associates with GNB1L, but mutations in the key phosphoacceptor residues (S487/S491) on TELO2 required for the PIH1D1 interaction did not affect GNB1L binding, indicating that GNB1L forms a complex with TELO2 independent of PIH1D1 (Fig S10G). Similarly, depletion of PIH1D1 and RPAP3 did not cause a marked decrease in PIKK protein levels in RKO TP53−/− cells (Fig S10H), suggesting that the GNB1L-TTT-RUVBL1/2 pathway may be the dominant PIKK biogenesis route in human cells.
Limitations of the study
The study employed CRISPR screens using γ-H2AX formation as a readout to identify genes that suppress DNA damage accumulation in human cells. While powerful, CRISPR screens have blind spots, and they need to be considered when interpreting results. In particular, false negatives are not uncommon and can be caused by the lack of efficient targeting, the presence of redundant genes such as paralogs, or simply the lack of guides targeting that particular gene. Furthermore, it is important to state that we used a marker of DNA damage, γ-H2AX, rather than monitoring DNA damage per se. Therefore, some of the genes scored in our screens may affect the formation or dephosphorylation of H2AX itself. Finally, γ-H2AX is not induced by every kind of DNA lesion similarly, and different readouts of DNA damage would certainly find overlapping as well as distinct gene sets.
RESOURCE AVAILABILITY
Lead Contact
Further information and requests for resources and reagents should be directed to and will be fulfilled by Daniel Durocher (durocher@lunenfeld.ca).
Materials Availability
Materials included in this manuscript will be shared upon request.
Data and Code Availability
The datasets generated and analyzed during this study are available at Mendeley Data (DOI: 10.17632/z4ht3txn2k.1), NCBI BioProject (PRJNA948427) and ProteomeXchange (PXD043028/PXD043029). These data are publicly available as of the date of publication.
All original code generated in this study is available at Zenodo (DOI: 10.5281/zenodo.7833858) and are publicly available as of the date of publication.
Any additional information required to reanalyze the data reported in this paper is available from the lead contact upon request.
Experimental Model and Study Participant Details
Human cell lines used in this manuscript are summarized in the Key Resources Table.
Key resources table.
| REAGENT or RESOURCE | SOURCE | IDENTIFIER |
|---|---|---|
| Antibodies | ||
| Polyclonal rabbit anti-H2AX | Cell Signaling | Cat#2595; RRID:AB_10694556 |
| Monoclonal mouse anti-γ-H2AX | Millipore | Cat#05-636; RRID:AB_309864 |
| Monoclonal mouse anti-γ-H2AX-Alexa Fluor 647 | Millipore | Cat#05-636-AF647 |
| Polyclonal rabbit anti-γ-H2AX | Cell Signaling | Cat#2577; RRID:AB_2118010 |
| Polyclonal rabbit anti-53BP1 | Santa Cruz | Cat#sc22760; RRID:AB_2256326 |
| Monoclonal mouse anti-RPA2 | Abcam | Cat#ab2175; RRID:AB_302873 |
| Polyclonal rabbit anti-pRPA2 (S33) | Bethyl Laboratories | Cat#A300-246A-3; RRID:AB_2180847 |
| Monoclonal mouse anti-CHK1 | Santa Cruz | Cat#sc8408; RRID:AB_627257 |
| Monoclonal rabbit anti-pCHK1 (S345) | Cell Signaling | Cat#2348; RRID:AB_331212 |
| Monoclonal mouse anti-PCNA | Santa Cruz | Cat#sc56; RRID:AB_628110 |
| Polyclonal rabbit anti-ubiquityl PCNA (Lys164) | Cell Signaling | Cat#2577; RRID:AB_2118010 |
| Polyclonal rabbit anti-GNB1L | Sigma-Aldrich | Cat#HPA034627; RRID:AB_10600662 |
| Polyclonal rabbit anti-TELO2 | Proteintech | Cat#15975-1-AP; RRID:AB_2203337 |
| Polyclonal rabbit anti-TTI1 | Bethyl Laboratories | Cat#A303-451A; RRID:AB_10953982 |
| Polyclonal rabbit anti-TTI2 | Bethyl Laboratories | Cat#A303-476A; AB_10948973 |
| Polyclonal rabbit anti-RUVBL1 | Proteintech | Cat#10210-2-AP; RRID:AB_2184405 |
| Polyclonal anti-RUVBL2 | Abcam | Cat#ab36569; RRID:AB_2301439 |
| Polyclonal rabbit anti-PIH1D1 | Proteintech | Cat#19427-1-AP; RRID:AB_10640423 |
| Polyclonal rabbit anti-RPAP3 | Bethyl Laboratories | Cat#A304-854A-T; RRID:AB_2621049 |
| Polyclonal goat anti-ATR | Santa Cruz | Cat#sc1887; RRID:AB_630893 |
| Polyclonal goat anti-DNA-PKcs | Santa Cruz | Cat#sc1552; RRID:AB_2172847 |
| Monoclonal rabbit anti-ATM | Cell Signaling | Cat#2873; RRID:AB_2062659 |
| Monoclonal rabbit anti-mTOR | Cell Signaling | Cat#2983; RRID:AB_2105622 |
| Polyclonal rabbit anti-TRRAP | Bethyl Laboratories | Cat#A301-132A; AB_2209668 |
| Polyclonal rabbit anti-SMG1 | Bethyl Laboratories | Cat#A300-394A; RRID:AB_386105 |
| Monoclonal mouse anti-α-Actinin | Millipore | Cat#05-384; RRID:AB_309709 |
| Monoclonal mouse anti-α-Tubulin | Calbiochem | Cat#CP06; RRID:AB_2617116 |
| Monoclonal mouse anti-GAPDH | Sigma-Aldrich | Cat#G9545; RRID:AB_796208 |
| Polyclonal rabbit anti-GFP | Gift from Laurence Pelletier | N/A |
| Monoclonal rat anti-HA | Roche | Cat#ROAHAHA; RRID:AB_2687407 |
| Monoclonal mouse anti-Flag M2-Peroxidase (HRP) | Sigma-Aldrich | Cat#A8592; RRID:AB_439702 |
| Monoclonal rat anti-BrdU [BU1/75 (ICR1)] | Abcam | Cat#ab6326, RRID:AB_305426 |
| Monoclonal mouse anti-BrdU (B44) | BD Biosciences | Cat#347580, RRID:AB_10015219 |
| Polyclonal rabbit anti-RECQL5 | Abcam | Cat#ab91422; RRID:AB_2050245 |
| Monoclonal rabbit anti-FANCJ | R&D Systems | Cat#MAB6496; RRID:AB_10719145 |
| Polyclonal rabbit anti-DERA | Sigma-Aldrich | Cat#HPA055897; RRID:AB_2682963 |
| Monoclonal HRP-sheep anti-mouse IgG | Cytiva | Cat#NA9310-1ml; RRID:AB_772193 |
| Polyclonal HRP-goat anti-rabbit IgG | Jackson Immunoresearch Labs | Cat#111-035-144; RRID:AB_2307391 |
| Polyclonal HRP-bovine anti-goat IgG | Jackson Immunoresearch Labs | Cat#805-035-180; RRID:AB_2340874 |
| Polyclonal Alexa Fluor 488-donkey anti rat IgG | Thermo Fisher | Cat#A21208, RRID:AB_2535794 |
| Polyclonal Alexa Fluor 555-donkey anti mouse IgG | Thermo Fisher | Cat#A31570, RRID:AB_2536180 |
| Polyclonal Alexa Fluor 488-goat anti mouse IgG | Thermo Fisher | Cat#A11029; RRID:AB_2534088 |
| Polyclonal Alexa Fluor 647-goat anti mouse IgG | Thermo Fisher | Cat#A21236; RRID:AB_2535805 |
| Polyclonal Alexa Fluor 488-goat anti rabbit IgG | Thermo Fisher | Cat#A11034; RRID:AB_2576217 |
| Polyclonal Alexa Fluor 647-goat anti rabbit IgG | Thermo Fisher | Cat#A21244; RRID:AB_2535812 |
| Bacterial and virus strains | ||
| XL1-Blue competent cells | Agilent | Cat#200249 |
| Chemicals, peptides, and recombinant proteins | ||
| Lipofectamine 2000 | Thermo Fisher | Cat#11668030 |
| Lipofectamine RNAiMAX | Thermo Fisher | Cat#13778100 |
| Puromycin | InvivoGen | Cat#ant-pr |
| Blasticidin | InvivoGen | Cat#ant-bl |
| Nourseothricin (clonNAT) | Gold Biotechnology | Cat#N-500-5 |
| Polybrene | Sigma-Aldrich | Cat#TR-1003 |
| Penicillin and streptomycin (Pen Strep) | GIBCO | Cat#15140122 |
| Fetal Bovine Serum (FBS) | Wisent Bioproduct | Cat#080-150 |
| Phosphate Buffer Saline (PBS) | GIBCO | Cat#10010023 |
| Dulbecco’s Modified Eagle’s Medium (DMEM) | GIBCO | Cat#C11965500BT |
| Trypsin | Sigma-Aldrich | Cat#T1426 |
| FLAG M2 Magnetic Beads | Millipore | Cat#M8823-5ML |
| ChromoTek GFP-Trap® Magnetic Agarose | Proteintech | Cat#gtma |
| Streptavidin Sepharose High Performance | Cytiva | Cat#17-5113-01 |
| Aphidicolin | Focus Biochemicals | Cat#10-2058 |
| Hydroxyurea | Sigma-Aldrich | Cat#H8627 |
| Ara-C | Sigma-Aldrich | Cat#C1768 |
| CD437 | Sigma-Aldrich | Cat#C5865 |
| Gemcitabine | Cayman chemical | Cat#9003096 |
| dTAGV-1 | Gift from Benham Nabet (PMID: 32948771) | N/A |
| TBB (4,5,6,7-tetrabromobenzotriazole) | Selleckchem | Cat#S5265 |
| PF-06873600 | MedChemExpress | Cat#HY-114177 |
| TAK-931 | Chemietek | Cat#CT-TAK931 |
| 5-Chloro-2’-deoxyuridine (CIdU) | Sigma-Aldrich | Cat#C6891 |
| 5-Iodo-2’-deoxyuridine (IdU) | Sigma-Aldrich | Cat#I7125 |
| ProLong Gold Antifade Mountant | Invitrogen | Cat#P36930 |
| Critical commercial assays | ||
| QIAamp Blood Maxi Kit | QIAGEN | Cat#51194 |
| Q5 High-Fidelity 2X Master Mix | New England Biolabs | Cat#M5044L |
| NextSeq 500/550 High Output Kit v2.5 | Illumina | Cat#20024906 |
| NanoBRET™ PPI Starter Systems | Promega | N1811 |
| TaqMan Gene Expression Assay of ATM | Thermo Fisher | Cat#Hs00175892_m1 |
| TaqMan Gene Expression Assay of ATR | Thermo Fisher | Cat#Hs00992123_m1 |
| TaqMan Gene Expression Assay of PRKDC | Thermo Fisher | Cat#Hs00179161_m1 |
| Deposited data | ||
| Raw sequencing reads of the CRISPR screens | This paper | BioProject: PRJNA948427 |
| Raw image data | This paper | Mendeley Data: DOI: 10.17632/z4ht3txn2k.1 |
| Original code | This paper | Zenodo: DOI: 10.5281/zenodo.7833858 |
| Proteomics data | This paper | ProteomeXchange: PXD043028/PXD043029 |
| Experimental models: Cell lines | ||
| Human: RPE1-hTERT Cas9 TP53−/− | PMID: 29973717 | N/A |
| Human: RPE1-hTERT Cas9 TP53−/− FANCJ-KI clones | Gift from Arne Nedergaard Kousholt | Table S4 |
| Human: 293T | ATCC | Cat#CRL-3216 |
| Human: COL-hTERT | abmGood | Cat#T0570 |
| Human: COL-hTERT Cas9 TP53−/− | Gift from Repare Therapeutics | N/A |
| Human: RKO TP53−/− | Gift from Agnel Sfeir | N/A |
| Human: RKO TP53−/− FANCJ-KO#1 | This paper | N/A |
| Human: RKO TP53−/− FANCJ-KO#2 | This paper | N/A |
| Human: RKO TP53−/− RECQL5-KO#1 | This paper | N/A |
| Human: RKO TP53−/− RECQL5-KO#2 | This paper | N/A |
| Oligonucleotides | ||
| TKOv3 CRISPR libraries | PMID:28655737 | N/A |
| PCR#1 library primer forward V3_2_F: CTGCGTGCGCCAATTCTG | PMID: 32516598 | N/A |
| PCR#2 library primer reverse V3_1_R2: AGAACCGGTCCTGTGTTCTG | PMID: 32516598 | N/A |
| sgRNA sequences and TIDE PCR primers | This paper | Table S4 |
| Recombinant DNA | ||
| LentiCRISPRv2 | PMID:25075903 | Addgene Cat#52961 |
| pVSVg | PMID: 12717450 | Addgene Cat#14888 |
| pRSV-Rev | PMID: 9765382 | Addgene Cat#12253 |
| pMDLg/pRRE | PMID: 9765382 | Addgene Cat#12251 |
| pHIV-NAT-T2A-hCD52 | Gift from R. Scully. | N/A |
| pHIV-NAT-T2A-hCD52-FANCJ | This paper | N/A |
| pHIV-NAT-T2A-hCD52-FANCJ-K52R | This paper | N/A |
| pHIV-NAT-T2A-hCD52-FANCJ-K141A/K142A | This paper | N/A |
| pHIV-NAT-T2A-hCD52-FANCJ-M299I | This paper | N/A |
| pHIV-NAT-T2A-hCD52-FANCJ-R707C | This paper | N/A |
| pHIV-NAT-T2A-hCD52-FANCJ-S990A | This paper | N/A |
| pHIV-NAT-T2A-hCD52-FANCJ-T1133A | This paper | N/A |
| pHIV-NAT-T2A-hCD52-DERA | This paper | N/A |
| pHIV-NAT-T2A-hCD52-DERA-K254A | This paper | N/A |
| pHIV-NAT-T2A-hCD52-RECQL5-K58R | This paper | N/A |
| pHIV-NAT-T2A-hCD52-RECQL5-E584D | This paper | N/A |
| pHIV-NAT-T2A-hCD52-RECQL5-F666A | This paper | N/A |
| pHIV-NAT-T2A-hCD52-RECQL5-S727A | This paper | N/A |
| pHIV-NAT-T2A-hCD52-RECQL5 | This paper | N/A |
| pHIV-NAT-T2A-hCD52-RECQL5(1–490) | This paper | N/A |
| pHIV-NAT-T2A-hCD52-RECQL5(1–620) | This paper | N/A |
| pHIV-NAT-T2A-hCD52-RECQL5(1–900) | This paper | N/A |
| pHIV-NAT-T2A-hCD52-RECQL5(491–991) | This paper | N/A |
| pHIV-NAT-T2A-hCD52-RECQL5(491–900) | This paper | N/A |
| pHIV-NAT-T2A-hCD52-RECQL5(621–900) | This paper | N/A |
| pHIV-NAT-T2A-hCD52-TELO2-N1(1–460) | This paper | N/A |
| pHIV-NAT-T2A-hCD52-TELO2-N2(1–640) | This paper | N/A |
| pHIV-NAT-T2A-hCD52-TELO2-C1(640–837) | This paper | N/A |
| pHIV-NAT-T2A-hCD52-TELO2-C2(460–837) | This paper | N/A |
| pHIV-NAT-T2A-hCD52-TELO2-C3(460–640) | This paper | N/A |
| pHIV-NAT-T2A-hCD52-TELO2-C4(460–545) | This paper | N/A |
| pHIV-NAT-T2A-hCD52-TELO2-del1(Δ460–545) | This paper | N/A |
| pHIV-NAT-T2A-hCD52-TELO2-del2(Δ482–545) | This paper | N/A |
| pHIV-NAT-T2A-hCD52-TELO2-M1(490DSDD493-AAAA) | This paper | N/A |
| pHIV-NAT-T2A-hCD52-TELO2-M2(498YDMS501-AAAA) | This paper | N/A |
| pHIV-NAT-T2A-hCD52-TELO2-M3(503DRE505-AAA) | This paper | N/A |
| pHIV-NAT-T2A-hCD52-TELO2-M4(516RDC518-AAA) | This paper | N/A |
| pcDNA5-FRT/TO-3xFLAG | LTRI OpenFreezer | Cat#V4978 |
| pcDNA5-FRT/TO-3xFLAG-GNB1L | This paper | N/A |
| pcDNA5-miniTurbo-3xFLAG | Gift from Anne-Claude Gingras | N/A |
| pcDNA5-miniTurbo-3xFLAG-EGFP | Gift from Anne-Claude Gingras | N/A |
| pcDNA5-miniTurbo-3xFLAG-GNB1L | This paper | N/A |
| pLVU/GFP | PMID: 20132838 | Addgene Cat#24177 |
| pLVU/GFP-GNB1L | This paper | N/A |
| pLVU/GFP-GNB1L-S42L | This paper | N/A |
| pLVU/GFP-GNB1L-G43M | This paper | N/A |
| pLVU/GFP-GNB1L-A271E | This paper | N/A |
| pLVU/GFP-GNB1L-G272R | This paper | N/A |
| pLVU/GFP-GNB1L-D274G | This paper | N/A |
| pLVU/GFP-GNB1L-D315R | This paper | N/A |
| pLEX_305-N-dTAG | PMID: 29581585 | Addgene Cat#91797 |
| pLEX_305-N-dTAG-GNB1L | This paper | N/A |
| pNLF1-N-Nanoluc-CMV | Promega | N1811 |
| NLF1-N-Nanoluc-CMV-GNB1L | This paper | N/A |
| pHTN HaloTag CMV-neo | Promega | Cat#G7721 |
| pHTN HaloTag CMV-neo-ATR | This paper | N/A |
| pHTN HaloTag CMV-neo-TELO2 | This paper | N/A |
| pHTC HaloTag CMV-neo | Promega | Cat#G7711 |
| pHTC HaloTag CMV-neo-TELO2 | This paper | N/A |
| pHTC HaloTag CMV-neo-TELO2-del1(Δ460–545) | This paper | N/A |
| pHTC HaloTag CMV-neo-TELO2-del2(Δ482–545) | This paper | N/A |
| pHTC HaloTag CMV-neo-TELO2-M1(490DSDD493-AAAA) | This paper | N/A |
| pHTC HaloTag CMV-neo-TELO2-M2(498YDMS501-AAAA) | This paper | N/A |
| pHTC HaloTag CMV-neo-TELO2-M3(503DRE505-AAA) | This paper | N/A |
| pHTC HaloTag CMV-neo-TELO2-M4(516RDC518-AAA) | This paper | N/A |
| Software and algorithms | ||
| Cytoscape version 3.8.2 | Cytoscape | https://cytoscape.org |
| R version 4.1.2 | R software | https://www.r-project.org |
| MAGeCK | PMID:25476604 | https://sourceforge.net/p/mageck/wiki/Home |
| BAGEL | PMID:28655737 | https://github.com/hart-lab/bagel/blob/master/BAGEL.py |
| Adobe Illustrator CS6 (version 26.2.1) | Adobe Inc. | https://www.adobe.com/products/illustrator.html |
| Prism version 9.2.0 | GraphPad | http://www.graphpad.com/scientific-software/prism/ |
| ggplot2 (version 3.2.1) | N/A | https://ggplot2.tidyverse.org |
| FlowJo 10.5.3 | FlowJo LLC | https://www.flowjo.com/ |
| ImageJ Fiji | PMID:22930834 | https://imagej.net/Fiji |
| ChimeraX 1.3 | PMID:15264254 | https://www.cgl.ucsf.edu/chimera/ |
| LI-COR Image Studio 5.2 | LI-COR Biosciences | https://www.licor.com/bio/image-studio/ |
| Columbus Image Data Storage and Analysis | PerkinElmer | https://www.perkinelmer.com/product/image-data-storage-and-analysis-system-columbus |
METHOD DETAILS
Cell culture
RKO TP53−/−, RPE1-hTERT TP53−/−, COL-hTERT TP53−/− and 293T cells were grown in Dulbecco’s Modified Eagle Medium (DMEM; Gibco/Thermo Fisher) supplemented with 10% fetal bovine serum (FBS; Wisent), 1x non-essential amino acids, 200 mM GlutaMAX (both Gibco/Thermo Fisher), 100 U/ml penicillin and 100 μg/ml streptomycin (Pen/Strep; Wisent). All cell lines were routinely authenticated by STR and tested negative for mycoplasma.
RKO TP53−/− FANCJ-KO and RECQL5-KO gene knockouts were generated by electroporation of Cas9 and sgRNA using a Lonza Amaxa II nucleofector. sgRNA target sequences were: FANCJ, AGATTACTAGAGAGCTCCGG; RECQL5, AGTCAGCTTCCTGATCAGGA. Cells were cultured for an additional five days after electroporation to provide time for gene editing and then seeded at low densities (500 cells/15-cm dish) for single-clone isolation. FANCJ-KO and RECQL5-KO cell clones were identified by PCR amplification and ICE analysis (https://ice.synthego.com) and confirmed by immunoblot analysis (Supplementary Table 4).
For the RPE1-hTERT TP53−/− FANCJ knock-in cell lines, the desired FANCJ gene variants (K52R, K141/142A, S990A, T1133A) were introduced in the RPE1-hTERT TP53−/− Cas9-expressing clone, using the RNP CRISPR approach of IDT. Sequences of PCR primers, sgRNA, and ssODN repair templates can be found in Supplementary Table 4. The expression of FANCJ variants were confirmed by immunoblot analysis.
Plasmids and viral vectors
DNA corresponding to sgRNAs was cloned into LentiCRISPRv2 using BamHI (Addgene, #52961). sgRNA target sequences and their validations can be found in Supplementary Table 4. Lentiviral particles were produced in 293T cells by co-transfection of the targeting vector with vectors expressing VSV-G, RRE and REV using calcium phosphate. Medium was refreshed 12–16 h later. Virus-containing supernatant was collected 36–40 h post transfection, cleared through a 0.4-μm filter, supplemented with 8 μg/ml polybrene (Sigma) and used for infection of target cells. The coding sequences for FANCJ, RECQL5, GNB1L, TELO2, ATR were obtained from the ORFeome collection (http://horfdb.dfci.harvard.edu/), archived in OpenFreezer. The coding sequences for FANCJ, RECQL5, TELO2 were cloned into pHIV-NAT-T2A-hCD52 using NotI/XmaI restriction enzyme sites. The GNB1L coding sequence was cloned into pcDNA5-FRT/TO-3xFLAG, pcDNA5-miniTurbo-3xFLAG, pLVU/GFP, and pLEX_305-N-dTAG vectors using the Gateway system (Life Technologies/Thermo Fisher) according to the manufacturer’s protocol. The TELO2 and ATR coding sequences were cloned into pHTN HaloTag CMV-neo using SbfI/NotI restriction enzyme sites. The TELO2 coding sequence was cloned into pHTC HaloTag CMV-neo using SbfI/PvuI restriction enzyme sites.
Immunofluorescence microscopy
To analyze γ-H2AX and 53BP1 focus formation in RKO TP53−/− cell lines, cells were seeded on coverslips to grow for 24 h, and then subjected to the indicated treatments or left untreated. Cells were rinsed with PBS once, subsequently fixed with 4% paraformaldehyde (PFA, Thermo Fisher) for 15 min at room temperature, and permeabilized with 0.3% Triton X-100 (Sigma, T8787) for 30 min. After fixation, cells were rinsed with PBS for three times, blocked in blocking buffer (10% goat serum (Sigma, G6767), 0.5% NP-40 (Sigma-Aldrich, I3021), 5% w/v saponin (Sigma-Aldrich, 84510), diluted in PBS) for 30 min, incubated with primary antibodies (mouse anti-γ-H2AX JBW301 1:2500 and rabbit anti-53BP1 1:2500) diluted in blocking buffer for 2 h at room temperature. Cells were then washed three times in PBS for 5 min and stained with secondary antibodies (Alexa Fluor 488-conjugated goat anti-mouse IgG and Alexa Fluor 647-conjugated goat anti-rabbit IgG, 1:1000 in blocking buffer) and 0.5–0.8 μg/mL DAPI (4,6-diamidino-2-phenylindole, Sigma-Aldrich, D9542) for 1 h at room temperature. Cells were washed as above, mounted in Pro-Long Gold mounting medium (Life Technologies), and imaged using a Zeiss LSM780 laser scanning microscope with a 60X objective. Image analysis was performed using Columbus (PerkinElmer) to quantify the nuclear foci of γ-H2AX and 53BP1 as described previously16.
For immunofluorescence analysis of γ-H2AX and RPA2 in RKO TP53−/− cell lines, cells were grown on coverslips for 24 h, subjected to the indicated treatment, then pre-extracted for 10 min on ice with ice-cold buffer (25 mM HEPES, pH 7.4, 50 mM NaCl, 1 mM EDTA, 3 mM MgCl2, 300 mM sucrose and 0.5% Triton X-100) and fixed with 4% PFA for 15 min at room temperature. Staining was as described before except the primary antibodies used were rabbit anti-γ-H2AX 1:200 and mouse anti-RPA2 1:500. Images were acquired on a Zeiss LSM780 laser scanning microscope with a 20X objective and analyzed by Columbus (PerkinElmer) to quantify the nuclear intensity of γ-H2AX and RPA2 signals.
Immunofluorescence and flow cytometry
Flow cytometry experiments were performed as described previously 84. Briefly, cells were plated on 6-cm dishes to grow for 24 h before adding drugs. After drug treatment, cells were collected by trypsinization and centrifuged in a conical tube. Pellets were washed in PBS once and fixed in 4% PFA for 10 min at room temperature. Cells were spun, resuspended in 100 μl PBS and chilled on ice for 1 min. 900 μl of −20°C methanol was then added dropwise while gently vortexing. Fixed cells were stored at −20°C overnight or longer. Before staining, cells were spun down, washed with PBS, and blocked in blocking buffer (see “Immunofluorescence microscopy” section) at room temperature for 30 min. Cells were then centrifuged and resuspended in diluted Alexa Fluor 647-conjugated mouse anti-γ-H2AX antibody (Millipore, 05–636-AF647, 1:1000 in blocking buffer). After 2 h incubation the antibody was diluted with 10X volume PBS, cells were spun down and resuspended in PBS with DAPI. Cells were analyzed on BD LSRFortessa X-20 (BD Biosciences), or MoFlo Astrios EQ Cell Sorter (Beckman Coulter), or Attune NxT/CytKick Max autosampler (Thermo Fisher).
Phenotypic CRISPR/Cas9 screens based on γ-H2AX
RKO TP53−/− cells or COL-hTERT TP53−/− cells were transduced with the lentiviral TKOv3 library 25 at a low MOI (~0.3) and puromycin-containing medium was added the next day. Three days after transduction, which was considered the initial time point (T0), cells were pooled together and divided in two technical replicates (the only exception is the untreated RKO screen in which we did four replicates). Each replicate was cultured for five more days to provide time for sgRNA-mediated gene editing, then divided into different treatments at T5. Cells were either treated with 0.3 μM Aph, or with 0.2 μM Ara-C, or with 200 μM HU, or left untreated (UT) for 24 h. At T6, 40 million cells per sample were collected in pellets and frozen at −80 °C as the unsorted population, with the remaining cells (~400 million) subjected to fixation, staining and FACS. These cells were spun down in 50 ml conical tubes, washed with PBS once, and fixed in 4% PFA for 10 min at room temperature while rotating. Cells were then pelleted and resuspended in 1 ml PBS and chilled on ice. 19 ml of −20°C methanol was then added dropwise while gently vortexing. Fixed cells were stored at −20°C overnight or longer. Before staining, cells were spun down, washed with FACS buffer (PBS with 5% FBS), and blocked in blocking buffer at room temperature for 30 min while rotating. Cells were then centrifuged and resuspended in diluted Alexa Fluor 647-conjugated mouse anti-γ-H2AX antibody (Millipore, 05–636-AF647, 1:1000 in blocking buffer). After 2 h incubation,40 ml of FACS buffer was added, cells were spun down and resuspended in 10 ml PBS with DAPI, then subjected to sorting on a MoFlo Astrios EQ Cell Sorter. Cells with the top 5% of γ-H2AX signal intensity were collected and their genomic DNA (gDNA) was extracted using the FFPE DNA Purification Kit (Norgen Biotek Cat. 47400). gDNA from unsorted cell population was isolated using the QIAamp Blood Maxi Kit (Qiagen). For both sorted and the unsorted cell populations, genome-integrated sgRNA sequences were amplified by PCR using KAPA HiFi HotStart ReadyMix (Kapa Biosystems). i5 and i7 multiplexing barcodes were added in a second round of PCR and final gel-purified products were sequenced on Illumina NextSeq500 systems to determine sgRNA representation in each sample.
Immunoprecipitation
Cells were transfected with pcDNA5–3xFLAG-TELO2. 48 hours later, cells were collected by trypsinization, washed with PBS once, and lysed in 1 ml high salt lysis buffer (50 mM HEPES pH8, 300 mM NaCl, 2 mM EDTA, 0.1% NP-40, 10% glycerol, plus protease inhibitors (cOmplete EDTA-free protease inhibitor cocktail, Roche, 11836170001)). Lysates were incubated with gentle rotation at 4°C for 30 min with occasional vortexing and then centrifuged at 15,000xg for 10 min. 150 μl of total cell lysates were used as input and 850 μl were incubated with 40 μl anti-FLAG M2 magnetic bead (Sigma M8233) at 4°C overnight while rotating. Beads were washed three times with TBS (50 mM Tris-HCl pH 7.4, 150 mM NaCl) and eluted with 100 μl of 3x FLAG peptide (100 μg/ml, GLPBio, GP10149) at 4°C for 30 min. Elution was repeated once more and 40 μl 6x SDS-PAGE sample buffer was added to each sample. Samples were boiled at 95°C for 5 min and subjected to SDS-PAGE and immunoblot analysis.
Parallel TurboID-based proximity labeling and affinity purification (AP) coupled to mass spectrometry (MS)
Parental 293 Flp-In cells, and cells stably expressing miniTurbo-3xFlag-GNB1L, miniTurbo-3xFlag-eGFP or miniTurbo-3xFlag were used for parallel miniTurbo and AP-MS studies. For both TurboID and AP-MS, two 150-mm plates of cells were treated with 5 μg/ml doxycycline for 24 h to induce expression of bait proteins. For miniTurbo, 50 μM biotin was added to cells 40 min before harvest. Cells were pelleted at low speed, washed with ice-cold PBS and frozen at −80°C until purification. Cell lysis, purification, and mass spectrometry were performed as previously described in (PMID: 29991506). For TurboID, cells were lysed in 1.5 ml of modified RIPA buffer [50 mm Tris-HCl, pH 7.4, 150 mm NaCl, 1 mm EGTA, 0.5 mm EDTA, 1 mm MgCl2, 1% NP40, 0.1% SDS, 0.4% sodium deoxycholate, 1 mm PMSF and 1x Protease Inhibitor mixture (Sigma-Aldrich, Cat# P8340)]. Cells were sonicated and added with 250 U of TurboNuclease (BioVision Inc., Milpitas, CA, Cat# 9207) and 10 μg of RNase A (Bio Basic, Markham, ON, Canada, Cat# RB0473). The SDS concentration was increased to 0.4% and the samples were rotated at 4 °C for 5 min. Samples were centrifuged at 15,000 g for 15 min and the supernatant was used for biotinylated protein capture using 30 μl of pre-washed Streptavidin agarose beads (GE Healthcare Life Science, Cat# 17511301). After 4 h, the beads were washed once with SDS-Wash buffer, twice with RIPA wash buffer, once with TNNE buffer, and three times with 50 mm ammonium bicarbonate (ABC buffer), pH 8.0. On-bead digestion was performed with 1 μg of trypsin (Sigma Aldrich, Cat# 6567) in 70 μl of ABC buffer, overnight at 37 °C, followed by further digestion with an additional 0.5 μg of trypsin for 3 h. Supernatants were collected into a new tube. Beads were washed twice with water and this supernatant was pooled with the peptide supernatant, and subsequently dried using vacuum centrifugation. Peptides were re-suspended in 30 μl of 5% formic acid in mass spectrometry grade water and subjected to mass spectrometry analysis.
DNA fiber assay
RKO TP53−/− parental (WT) and FANCJ-KO cells were plated onto 6-cm plates 48 h before the experiment. Cells were sequentially labeled with two nucleotide analogs CIdU (40 μM) and IdU (100 μM) for the indicated time. Aph was added to cells during the IdU pulse. After the ldU pulse, cells were treated with CSK100 buffer (100 mM NaCl, 10 mM MOPS, 3 mM MgCl2 [pH 7.2], 300 mM sucrose, and 0.5% Triton X-100) for 10 min at room temperature (RT), then incubated with S1 nuclease buffer (30 mM sodium acetate [pH 4.6], 10 mM zinc acetate, 5% glycerol, and 50 mM NaCl) with or without 20 U/mL S1 nuclease (Invitrogen, 18001–016) for 30 min at 37 °C. The cells were then scraped in PBS + 0.1%BSA and centrifuged at 7,000 rpm for 5 min at 4 °C. PBS washes were done between each step. Cell pellets were resuspended at 500 cells/μL in PBS. The labeled cells were diluted with unlabeled at 1:2 ratio. 3 μL cells were mixed with 9 μL lysis buffer (200 mM Tris-HCl, pH 7.5, 50 mM EDTA and 0.5% SDS) on a clean slide, and dried at RT for 5 min. The slides were tilted, allowing the drops to flow down. The slides were air-dried at RT overnight. Fixation was done with 3:1 methanol/acetic acid for 1h at 4°C, followed by denaturing with 2.5 M HCl for 1 h and neutralizing with 0.1 M Na3B4O7 [pH 8], and three times washes with PBST. The slides were incubated in blocking buffer for 20 min and incubated with rat anti-BrdU (CIdU: Abcam, ab6326, 1:200) in blocking buffer at 37°C for 1.5 h. After three washes with PBST, the slides were incubated with Alexa Fluor 488-donkey anti rat (Thermo Fisher, A-21208, 1:1000) for 45 min. After three times washes with PBST, the slides were incubated with mouse anti-BrdU (IdU: BD Biosciences, 347580, 1:50) for 1.5 h and then washed once with high-salt PBST (0.5 M NaCl) and twice with PBST. The slides were incubated with Alexa Fluor 555-donkey anti mouse (Thermo Fisher, A-11029, 1:1000) for 45 min. After three washes with PBST, the slides were mounted in ProLong Gold Antifade Mountant (Invitrogen, P36930). Images were acquired using the Zeiss LSM780 laser-scanning microscope (Oberkochen, Germany). The length of the CIdU and IdU were measured by ImageJ software (NIH).
Incucyte cell growth assay
For Aph dose-response assays in RKO TP53−/− parental (WT) and FANCJ-KO cells, 770 cells per well were seeded in 96-well plates and treated with sequential serial dilutions of Aph. After 6 days of treatment, the cell confluency was measured using an IncuCyte Live-Cell Analysis system (Sartorius). Confluence growth inhibition was calculated as the relative confluency compared to untreated cells. For proliferation assays of sgDERA- and sgGNB1L-expressing RKO TP53−/− cells, 6000 cells per well were seeded in 24-well plates and treated with the indicated replication inhibitor or left untreated. The cell confluency was measured once 24 h post-seeding using an IncuCyte Live-Cell Analysis system. Growth curves were generated using confluency as the proxy for cell numbers.
dTAG-mediated protein degradation system
Two clonal 293T cell lines were generated by lentiviral transduction to introduce sgGNB1L-1 and the sgRNA-resistant FKBPmut-GNB1L plasmid into the parental 293T cells. The dTAGV-1 compound was added at 1 μM for 1–24 h (short-term) or 1–6 days (long-term) to induce the degradation of the FKBPmut-GNB1L protein 69,70.
HaloTag label-switch experiments
293T cells were transiently transfected with the Halo-ATR plasmid 24 h before the labeling experiments. To label newly synthesized Halo-ATR, cells were incubated with 10 μM of the blocking agent 7-bromoheptanol 85 (Alfa Aesar, H54762), for 2 h, followed by two washes, and then incubated with 1 μM TMR HaloTag ligand (Promega, G8252) for indicated time. To label pre-existing Halo-ATR, cells were incubated with 1 μM TMR HaloTag ligand for 1 h, followed by two washes, and then incubated with 10 μM blocking agent for the indicated time. Whole cell lysates were analyzed by SDS-PAGE and immunoblotting. TMR fluorescence signal was measured with a Typhoon FLA 9500 laser scanner (GE Healthcare). ImageJ (imagej.nih.gov) was used to quantify band intensities of TMR and α-actinin.
POPcode mutagenesis screen
The GNB1L open reading frame (ORF) was inserted into the pLVU/GFP lentiviral plasmid vector (Addgene, 24177) encoding a C-terminal GFP tag. The GNB1L coding sequence was subdivided into two regions, and variant libraries were generated via the oligonucleotide-directed mutagenesis method POPCode 72,73. Both GNB1L variant libraries were introduced into RKO TP53−/− cells separately by lentiviral transduction. Cells were sorted for the GFP-positive population to select for GNB1L-GFP variant integration. Cells were then transduced with sgGNB1L-1 (Supplementary Table 4) which targeted at an intron-exon junction site of the GNB1L gene. The γ-H2AX FACS screen was performed in cells with GNB1L-GFP variant library/sgGNB1L-1 in the presence of 150 μM HU, as described previously in the “Phenotypic CRISPR/Cas9 screen” section. Cells with the top 5% of γ-H2AX signal intensity were collected, and genomic DNA was extracted from both sorted and unsorted cells. The primer set (forward: 5’ TCTGGCCGTTTTTGGCTTTTT 3’; reverse: 5’ GAACAGCTCCTCGCCCTTG 3’) was used for PCR amplification of the inserted GNB1L ORF sequence. Variant frequencies in the pre- and post-selection libraries were assessed using TileSeq 72,73. Briefly, each ‘tile’ within the target locus was amplified with primers including Illumina sequencing adapters, followed by the addition of Illumina indices in a low-cycle PCR. Tiled libraries (including a wild type control) were sequenced by paired-end sequencing on an Illumina NextSeq 500 device using 300 cycle NextSeq 500/550 Mid Output v2.5 Kits, generating ~2M reads per tile. Sequencing data was processed as described previously 72,73. Briefly, libraries were demultiplexed with Illumina bcl2fastq and variant allele frequencies for each condition were calculated using the tileseq-package. Here, reads are aligned to a template sequence and mutations are called where there is agreement between both forward and reverse reads. Where read pairs disagreed, variants were treated as wild type. Fitness values were calculated using the tileseqMave pipeline 86 and scores were scaled based on the distribution of synonymous variants and the bottom 5th percentile of functional scores (in the absence of nonsense variants).
AlphaFold2 prediction of GNB1L-TELO2 interaction
Amino acid sequences corresponding to full-length human GNB1L and TELO2(460–640) were used as two separate chain inputs for the ColabFold implementation of AlphaFold2-multimer 87,88 using the following parameters: no templates, no amber relax, MMSeqs2 MSA mode, AlphaFold2-multimer-v2 model type, 5 models, 3 recycles. The top-ranking model was used for further analysis. The predicted aligned error plot for the top ranking model is shown in Fig S10C. A plot displaying the mean interface predicted aligned error (PAE) is shown in Fig S10D. Mean interface PAE is defined as the average PAE value between the indicated TELO2 residue and every GNB1L residue predicted to be within 9 Å. TELO2 residues without any nearby GNB1L residues are assigned the maximum PAE value. Molecule display and analysis were performed in ChimeraX 89.
GO-Figure!
GO-Figure! analyses were done using the python script provided by Waterhouse Lab, using the top 80 GO terms sorted by adjusted p-value, as calculated by Enricher (https://maayanlab.cloud/Enrichr/). The GO-figure software clusters GO terms together at a similarity threshold of 0.5, using a weighted distance algorithm to describe proximity in the GO hierarchy. The figure represents similarity of GO term clusters based on their hierarchical proximity, with point color describing adjusted p-value of the representative term, and point size describing the number of GO terms within each cluster.
FoldX and rolling window analysis
ΔΔG scores were calculated using the BuildModel command of the FoldX software, following the methodology presented by ELELAB’s mutateX algorithm (Fig S9B, and Supplementary Table 6). Each residue of the protein of interest was mutated to every other possible amino acid using the standard parameters of BuildModel.
The rolling window analysis plots (Fig S9B) take the rolling mean of each of three score types with a window size of five, therefore each position represents the mean of the given position along with the two scores before and after. The functional and ΔΔG scores were initially summarized for each position by taking the mean of all mutation scores for that residue, not including mutation to self or termination where it was provided. The conservation scores were calculated directly for each position with ConSurf (consurf.tau.ac.il/consurf_index.php).
QUANTIFICATION AND STATISTICAL ANALYSIS
All data presented are biological replicates unless otherwise stated. The statistical tests used, number of replicates, definition of error bars and center definitions are all defined within each figure or figure legend. Statistical tests performed in this study (Student’s unpaired t-test) as well as nonlinear fitting of drug dose response curves were performed using Graphpad Prism 9. ns = p > 0.05, * = p < 0.05, ** = p < 0.01, *** = p < 0.001.
Supplementary Material
Table S1. Gene ranking of γ-H2AX FACS CRISPR screens. Related to Figure 1.
Table S2. Hits in γ-H2AX FACS CRISPR screens. Related to Figure 1.
Table S3. Gene ontology analysis and GO-Figure analysis of hits in γ-H2AX FACS CRISPR screens. Related to Figure 1.
Table S5. Peptide counts of GNB1L Flag-AP and miniTurbo-BioID mass spectrometry experiments. Related to Figure 6.
Table S6. Functional scores of GNB1L deep mutational scanning study. Related to Figure 6.
Table S7. Predicted aligned error (PAE) of TELO2 residues by AlphaFold2 prediction. Related to Figure 7.
Highlights.
Genome-scale phenotypic CRISPR screens identify suppressors of DNA damage
Genes that suppress spontaneous DNA damage are highly enriched in essential genes
DERA protects cells from cytarabine-induced DNA damage
GNB1L promotes PIKK protein biosynthesis and suppresses replication catastrophe
Acknowledgements
We thank Rachel Szilard for critical reading of the manuscript and Junjie Chen for sharing results prior to their publication. We thank Laurence Pearl, Mohinder Pal and Oscar Llorca for discussions on the TTT complex, Agnel Sfeir for RKO TP53−/− cells and Benham Nabet for dTAGV-1 and Jordan Young for sending Cas9-expressing COL-hTERT cells and Cassandra Wong for helping with MS data deposition. YZ is supported by an Ontario Trillium Scholarship. This work was supported by grants from NIH grants (RM1HG010461 and UM1HG011989, to FPR), from the Canadian Cancer Society (705644, to DD) and from the Canadian Institutes for Health Research (CIHR, grants PJT-180438 to DD and FDN159926 to FPR).
Footnotes
Declaration of Interests
DD is a shareholder and advisor for Repare Therapeutics. Anne-Claude Gingras is a member of Molecular Cell’s Advisory Board.
Publisher's Disclaimer: This is a PDF file of an unedited manuscript that has been accepted for publication. As a service to our customers we are providing this early version of the manuscript. The manuscript will undergo copyediting, typesetting, and review of the resulting proof before it is published in its final form. Please note that during the production process errors may be discovered which could affect the content, and all legal disclaimers that apply to the journal pertain.
References
- 1.Liu Q, Guntuku S, Cui XS, Matsuoka S, Cortez D, Tamai K, Luo G, Carattini-Rivera S, DeMayo F, Bradley A, et al. (2000). Chk1 is an essential kinase that is regulated by Atr and required for the G(2)/M DNA damage checkpoint. Genes Dev 14, 1448–1459. [PMC free article] [PubMed] [Google Scholar]
- 2.Matsuoka S, Ballif BA, Smogorzewska A, McDonald ER 3rd, Hurov KE, Luo J, Bakalarski CE, Zhao Z, Solimini N, Lerenthal Y, et al. (2007). ATM and ATR substrate analysis reveals extensive protein networks responsive to DNA damage. Science 316, 1160–1166. [DOI] [PubMed] [Google Scholar]
- 3.Couch FB, Bansbach CE, Driscoll R, Luzwick JW, Glick GG, Betous R, Carroll CM, Jung SY, Qin J, Cimprich KA, and Cortez D (2013). ATR phosphorylates SMARCAL1 to prevent replication fork collapse. Genes Dev 27, 1610–1623. 10.1101/gad.214080.113. [DOI] [PMC free article] [PubMed] [Google Scholar]
- 4.Ward IM, and Chen J (2001). Histone H2AX is phosphorylated in an ATR-dependent manner in response to replicational stress. J Biol Chem 276, 47759–47762. [DOI] [PubMed] [Google Scholar]
- 5.Kumagai A, Lee J, Yoo HY, and Dunphy WG (2006). TopBP1 activates the ATR-ATRIP complex. Cell 124, 943–955. 10.1016/j.cell.2005.12.041. [DOI] [PubMed] [Google Scholar]
- 6.Bass TE, Luzwick JW, Kavanaugh G, Carroll C, Dungrawala H, Glick GG, Feldkamp MD, Putney R, Chazin WJ, and Cortez D (2016). ETAA1 acts at stalled replication forks to maintain genome integrity. Nat Cell Biol 18, 1185–1195. 10.1038/ncb3415. [DOI] [PMC free article] [PubMed] [Google Scholar]
- 7.Haahr P, Hoffmann S, Tollenaere MA, Ho T, Toledo LI, Mann M, Bekker-Jensen S, Raschle M, and Mailand N (2016). Activation of the ATR kinase by the RPA-binding protein ETAA1. Nat Cell Biol 18, 1196–1207. 10.1038/ncb3422. [DOI] [PubMed] [Google Scholar]
- 8.Saldivar JC, Cortez D, and Cimprich KA (2017). The essential kinase ATR: ensuring faithful duplication of a challenging genome. Nat Rev Mol Cell Biol 18, 622–636. 10.1038/nrm.2017.67. [DOI] [PMC free article] [PubMed] [Google Scholar]
- 9.Lempiainen H, and Halazonetis TD (2009). Emerging common themes in regulation of PIKKs and PI3Ks. EMBO J 28, 3067–3073. 10.1038/emboj.2009.281. [DOI] [PMC free article] [PubMed] [Google Scholar]
- 10.Baretic D, and Williams RL (2014). PIKKs--the solenoid nest where partners and kinases meet. Curr Opin Struct Biol 29, 134–142. 10.1016/j.sbi.2014.11.003. [DOI] [PubMed] [Google Scholar]
- 11.Takai H, Wang RC, Takai KK, Yang H, and de Lange T (2007). Tel2 regulates the stability of PI3K-related protein kinases. Cell 131, 1248–1259. 10.1016/j.cell.2007.10.052. [DOI] [PubMed] [Google Scholar]
- 12.Takai H, Xie Y, de Lange T, and Pavletich NP (2010). Tel2 structure and function in the Hsp90-dependent maturation of mTOR and ATR complexes. Genes Dev 24, 2019–2030. 10.1101/gad.1956410. [DOI] [PMC free article] [PubMed] [Google Scholar]
- 13.Hurov KE, Cotta-Ramusino C, and Elledge SJ (2010). A genetic screen identifies the Triple T complex required for DNA damage signaling and ATM and ATR stability. Genes Dev 24, 1939–1950. 10.1101/gad.1934210. [DOI] [PMC free article] [PubMed] [Google Scholar]
- 14.Horejsi Z, Takai H, Adelman CA, Collis SJ, Flynn H, Maslen S, Skehel JM, de Lange T, and Boulton SJ (2010). CK2 phospho-dependent binding of R2TP complex to TEL2 is essential for mTOR and SMG1 stability. Mol Cell 39, 839–850. 10.1016/j.molcel.2010.08.037. [DOI] [PubMed] [Google Scholar]
- 15.Izumi N, Yamashita A, and Ohno S (2012). Integrated regulation of PIKK-mediated stress responses by AAA+ proteins RUVBL1 and RUVBL2. Nucleus 3, 29–43. 10.4161/nucl.18926. [DOI] [PMC free article] [PubMed] [Google Scholar]
- 16.Olivieri M, Cho T, Alvarez-Quilon A, Li K, Schellenberg MJ, Zimmermann M, Hustedt N, Rossi SE, Adam S, Melo H, et al. (2020). A Genetic Map of the Response to DNA Damage in Human Cells. Cell 182, 481–496 e421. 10.1016/j.cell.2020.05.040. [DOI] [PMC free article] [PubMed] [Google Scholar]
- 17.Cheng CH, and Kuchta RD (1993). DNA polymerase epsilon: aphidicolin inhibition and the relationship between polymerase and exonuclease activity. Biochemistry 32, 8568–8574. 10.1021/bi00084a025. [DOI] [PubMed] [Google Scholar]
- 18.Krakoff IH, Brown NC, and Reichard P (1968). Inhibition of ribonucleoside diphosphate reductase by hydroxyurea. Cancer Res 28, 1559–1565. [PubMed] [Google Scholar]
- 19.Harrington C, and Perrino FW (1995). The effects of cytosine arabinoside on RNA-primed DNA synthesis by DNA polymerase alpha-primase. J Biol Chem 270, 26664–26669. 10.1074/jbc.270.44.26664. [DOI] [PubMed] [Google Scholar]
- 20.Williams NM, Glaser B, Norton N, Williams H, Pierce T, Moskvina V, Monks S, Del Favero J, Goossens D, Rujescu D, et al. (2008). Strong evidence that GNB1L is associated with schizophrenia. Hum Mol Genet 17, 555–566. 10.1093/hmg/ddm330. [DOI] [PubMed] [Google Scholar]
- 21.Paylor R, Glaser B, Mupo A, Ataliotis P, Spencer C, Sobotka A, Sparks C, Choi CH, Oghalai J, Curran S, et al. (2006). Tbx1 haploinsufficiency is linked to behavioral disorders in mice and humans: implications for 22q11 deletion syndrome. Proc Natl Acad Sci U S A 103, 7729–7734. 10.1073/pnas.0600206103. [DOI] [PMC free article] [PubMed] [Google Scholar]
- 22.Chen YZ, Matsushita M, Girirajan S, Lisowski M, Sun E, Sul Y, Bernier R, Estes A, Dawson G, Minshew N, et al. (2012). Evidence for involvement of GNB1L in autism. Am J Med Genet B Neuropsychiatr Genet 159B, 61–71. 10.1002/ajmg.b.32002. [DOI] [PMC free article] [PubMed] [Google Scholar]
- 23.Huang X, and Darzynkiewicz Z (2006). Cytometric assessment of histone H2AX phosphorylation: a reporter of DNA damage. Methods Mol Biol 314, 73–80. 10.1385/1-59259-973-7:073. [DOI] [PMC free article] [PubMed] [Google Scholar]
- 24.Rogakou EP, Pilch DR, Orr AH, Ivanova VS, and Bonner WM (1998). DNA double-stranded breaks induce histone H2AX phosphorylation on serine 139. J Biol Chem 273, 5858–5868. [DOI] [PubMed] [Google Scholar]
- 25.Hart T, Tong AHY, Chan K, Van Leeuwen J, Seetharaman A, Aregger M, Chandrashekhar M, Hustedt N, Seth S, Noonan A, et al. (2017). Evaluation and Design of Genome-Wide CRISPR/SpCas9 Knockout Screens. G3 (Bethesda) 7, 2719–2727. 10.1534/g3.117.041277. [DOI] [PMC free article] [PubMed] [Google Scholar]
- 26.Li W, Xu H, Xiao T, Cong L, Love MI, Zhang F, Irizarry RA, Liu JS, Brown M, and Liu XS (2014). MAGeCK enables robust identification of essential genes from genome-scale CRISPR/Cas9 knockout screens. Genome Biol 15, 554. 10.1186/s13059-014-0554-4. [DOI] [PMC free article] [PubMed] [Google Scholar]
- 27.Szklarczyk D, Gable AL, Nastou KC, Lyon D, Kirsch R, Pyysalo S, Doncheva NT, Legeay M, Fang T, Bork P, et al. (2021). The STRING database in 2021: customizable protein-protein networks, and functional characterization of user-uploaded gene/measurement sets. Nucleic Acids Res 49, D605–D612. 10.1093/nar/gkaa1074. [DOI] [PMC free article] [PubMed] [Google Scholar]
- 28.Hart T, and Moffat J (2016). BAGEL: a computational framework for identifying essential genes from pooled library screens. BMC Bioinformatics 17, 164. 10.1186/s12859-016-1015-8. [DOI] [PMC free article] [PubMed] [Google Scholar]
- 29.Wu Q, Schapira M, Arrowsmith CH, and Barsyte-Lovejoy D (2021). Protein arginine methylation: from enigmatic functions to therapeutic targeting. Nat Rev Drug Discov 20, 509–530. 10.1038/s41573-021-00159-8. [DOI] [PubMed] [Google Scholar]
- 30.Hart T, Chandrashekhar M, Aregger M, Steinhart Z, Brown KR, MacLeod G, Mis M, Zimmermann M, Fradet-Turcotte A, Sun S, et al. (2015). High-Resolution CRISPR Screens Reveal Fitness Genes and Genotype-Specific Cancer Liabilities. Cell 163, 1515–1526. 10.1016/j.cell.2015.11.015. [DOI] [PubMed] [Google Scholar]
- 31.Srinivasan V, Netz DJ, Webert H, Mascarenhas J, Pierik AJ, Michel H, and Lill R (2007). Structure of the yeast WD40 domain protein Cia1, a component acting late in iron-sulfur protein biogenesis. Structure 15, 1246–1257. 10.1016/j.str.2007.08.009. [DOI] [PubMed] [Google Scholar]
- 32.Austin-Tse C, Halbritter J, Zariwala MA, Gilberti RM, Gee HY, Hellman N, Pathak N, Liu Y, Panizzi JR, Patel-King RS, et al. (2013). Zebrafish Ciliopathy Screen Plus Human Mutational Analysis Identifies C21orf59 and CCDC65 Defects as Causing Primary Ciliary Dyskinesia. Am J Hum Genet 93, 672–686. 10.1016/j.ajhg.2013.08.015. [DOI] [PMC free article] [PubMed] [Google Scholar]
- 33.Lin R, Elf S, Shan C, Kang HB, Ji Q, Zhou L, Hitosugi T, Zhang L, Zhang S, Seo JH, et al. (2015). 6-Phosphogluconate dehydrogenase links oxidative PPP, lipogenesis and tumour growth by inhibiting LKB1-AMPK signalling. Nat Cell Biol 17, 1484–1496. 10.1038/ncb3255. [DOI] [PMC free article] [PubMed] [Google Scholar]
- 34.Liu ZR (2002). p68 RNA helicase is an essential human splicing factor that acts at the U1 snRNA-5’ splice site duplex. Mol Cell Biol 22, 5443–5450. 10.1128/MCB.22.15.5443-5450.2002. [DOI] [PMC free article] [PubMed] [Google Scholar]
- 35.Wilson BJ, Bates GJ, Nicol SM, Gregory DJ, Perkins ND, and Fuller-Pace FV (2004). The p68 and p72 DEAD box RNA helicases interact with HDAC1 and repress transcription in a promoter-specific manner. BMC Mol Biol 5, 11. 10.1186/1471-2199-5-11. [DOI] [PMC free article] [PubMed] [Google Scholar]
- 36.Liang WW, and Cheng SC (2015). A novel mechanism for Prp5 function in prespliceosome formation and proofreading the branch site sequence. Genes Dev 29, 81–93. 10.1101/gad.253708.114. [DOI] [PMC free article] [PubMed] [Google Scholar]
- 37.Cuadrado A, Corrado N, Perdiguero E, Lafarga V, Munoz-Canoves P, and Nebreda AR (2010). Essential role of p18Hamlet/SRCAP-mediated histone H2A.Z chromatin incorporation in muscle differentiation. EMBO J 29, 2014–2025. 10.1038/emboj.2010.85. [DOI] [PMC free article] [PubMed] [Google Scholar]
- 38.Zhao B, Chen Y, Jiang N, Yang L, Sun S, Zhang Y, Wen Z, Ray L, Liu H, Hou G, and Lin X (2019). Znhit1 controls intestinal stem cell maintenance by regulating H2A.Z incorporation. Nat Commun 10, 1071. 10.1038/s41467-019-09060-w. [DOI] [PMC free article] [PubMed] [Google Scholar]
- 39.Lanctot AA, Peng CY, Pawlisz AS, Joksimovic M, and Feng Y (2013). Spatially dependent dynamic MAPK modulation by the Nde1-Lis1-Brap complex patterns mammalian CNS. Dev Cell 25, 241–255. 10.1016/j.devcel.2013.04.006. [DOI] [PMC free article] [PubMed] [Google Scholar]
- 40.Li S, Ku CY, Farmer AA, Cong YS, Chen CF, and Lee WH (1998). Identification of a novel cytoplasmic protein that specifically binds to nuclear localization signal motifs. J Biol Chem 273, 6183–6189. 10.1074/jbc.273.11.6183. [DOI] [PubMed] [Google Scholar]
- 41.van der Meer JH, van der Poll T, and van ‘t Veer C (2014). TAM receptors, Gas6, and protein S: roles in inflammation and hemostasis. Blood 123, 2460–2469. 10.1182/blood-2013-09-528752. [DOI] [PubMed] [Google Scholar]
- 42.Yu Z, Mersaoui SY, Guitton-Sert L, Coulombe Y, Song J, Masson JY, and Richard S (2020). DDX5 resolves R-loops at DNA double-strand breaks to promote DNA repair and avoid chromosomal deletions. NAR Cancer 2, zcaa028. 10.1093/narcan/zcaa028. [DOI] [PMC free article] [PubMed] [Google Scholar]
- 43.Hernandez-Perez S, Cabrera E, Amoedo H, Rodriguez-Acebes S, Koundrioukoff S, Debatisse M, Mendez J, and Freire R (2016). USP37 deubiquitinates Cdt1 and contributes to regulate DNA replication. Mol Oncol 10, 1196–1206. 10.1016/j.molonc.2016.05.008. [DOI] [PMC free article] [PubMed] [Google Scholar]
- 44.Yeh C, Coyaud E, Bashkurov M, van der Lelij P, Cheung SW, Peters JM, Raught B, and Pelletier L (2015). The Deubiquitinase USP37 Regulates Chromosome Cohesion and Mitotic Progression. Curr Biol 25, 2290–2299. 10.1016/j.cub.2015.07.025. [DOI] [PubMed] [Google Scholar]
- 45.Friesen WJ, Wyce A, Paushkin S, Abel L, Rappsilber J, Mann M, and Dreyfuss G (2002). A novel WD repeat protein component of the methylosome binds Sm proteins. J Biol Chem 277, 8243–8247. 10.1074/jbc.M109984200. [DOI] [PubMed] [Google Scholar]
- 46.Lee JH, and Skalnik DG (2008). Wdr82 is a C-terminal domain-binding protein that recruits the Setd1A Histone H3-Lys4 methyltransferase complex to transcription start sites of transcribed human genes. Mol Cell Biol 28, 609–618. 10.1128/MCB.01356-07. [DOI] [PMC free article] [PubMed] [Google Scholar]
- 47.Cantor SB, Bell DW, Ganesan S, Kass EM, Drapkin R, Grossman S, Wahrer DC, Sgroi DC, Lane WS, Haber DA, and Livingston DM (2001). BACH1, a novel helicase-like protein, interacts directly with BRCA1 and contributes to its DNA repair function. Cell 105, 149–160. [DOI] [PubMed] [Google Scholar]
- 48.Quinet A, Carvajal-Maldonado D, Lemacon D, and Vindigni A (2017). DNA Fiber Analysis: Mind the Gap! Methods Enzymol 591, 55–82. 10.1016/bs.mie.2017.03.019. [DOI] [PubMed] [Google Scholar]
- 49.Peng M, Cong K, Panzarino NJ, Nayak S, Calvo J, Deng B, Zhu LJ, Morocz M, Hegedus L, Haracska L, and Cantor SB (2018). Opposing Roles of FANCJ and HLTF Protect Forks and Restrain Replication during Stress. Cell Rep 24, 3251–3261. 10.1016/j.celrep.2018.08.065. [DOI] [PMC free article] [PubMed] [Google Scholar]
- 50.Cong K, Peng M, Kousholt AN, Lee WTC, Lee S, Nayak S, Krais J, VanderVere-Carozza PS, Pawelczak KS, Calvo J, et al. (2021). Replication gaps are a key determinant of PARP inhibitor synthetic lethality with BRCA deficiency. Mol Cell 81, 3128–3144 e3127. 10.1016/j.molcel.2021.06.011. [DOI] [PMC free article] [PubMed] [Google Scholar]
- 51.Gallo D, Kim T, Szakal B, Saayman X, Narula A, Park Y, Branzei D, Zhang Z, and Brown GW (2019). Rad5 Recruits Error-Prone DNA Polymerases for Mutagenic Repair of ssDNA Gaps on Undamaged Templates. Mol Cell 73, 900–914 e909. 10.1016/j.molcel.2019.01.001. [DOI] [PubMed] [Google Scholar]
- 52.Choe KN, and Moldovan GL (2017). Forging Ahead through Darkness: PCNA, Still the Principal Conductor at the Replication Fork. Mol Cell 65, 380–392. 10.1016/j.molcel.2016.12.020. [DOI] [PMC free article] [PubMed] [Google Scholar]
- 53.Peng M, Litman R, Xie J, Sharma S, Brosh RM Jr., and Cantor SB (2007). The FANCJ/MutLalpha interaction is required for correction of the cross-link response in FA-J cells. EMBO J 26, 3238–3249. 10.1038/sj.emboj.7601754. [DOI] [PMC free article] [PubMed] [Google Scholar]
- 54.Manke IA, Lowery DM, Nguyen A, and Yaffe MB (2003). BRCT repeats as phosphopeptide-binding modules involved in protein targeting. Science 302, 636–639. [DOI] [PubMed] [Google Scholar]
- 55.Gong Z, Kim JE, Leung CC, Glover JN, and Chen J (2010). BACH1/FANCJ acts with TopBP1 and participates early in DNA replication checkpoint control. Mol Cell 37, 438–446. 10.1016/j.molcel.2010.01.002. [DOI] [PMC free article] [PubMed] [Google Scholar]
- 56.Salleron L, Magistrelli G, Mary C, Fischer N, Bairoch A, and Lane L (2014). DERA is the human deoxyribose phosphate aldolase and is involved in stress response. Biochim Biophys Acta 1843, 2913–2925. 10.1016/j.bbamcr.2014.09.007. [DOI] [PubMed] [Google Scholar]
- 57.Garcia PL, Liu Y, Jiricny J, West SC, and Janscak P (2004). Human RECQ5beta, a protein with DNA helicase and strand-annealing activities in a single polypeptide. EMBO J 23, 2882–2891. 10.1038/sj.emboj.7600301. [DOI] [PMC free article] [PubMed] [Google Scholar]
- 58.Schwendener S, Raynard S, Paliwal S, Cheng A, Kanagaraj R, Shevelev I, Stark JM, Sung P, and Janscak P (2010). Physical interaction of RECQ5 helicase with RAD51 facilitates its anti-recombinase activity. J Biol Chem 285, 15739–15745. 10.1074/jbc.M110.110478. [DOI] [PMC free article] [PubMed] [Google Scholar]
- 59.Di Marco S, Hasanova Z, Kanagaraj R, Chappidi N, Altmannova V, Menon S, Sedlackova H, Langhoff J, Surendranath K, Huhn D, et al. (2017). RECQ5 Helicase Cooperates with MUS81 Endonuclease in Processing Stalled Replication Forks at Common Fragile Sites during Mitosis. Mol Cell 66, 658–671 e658. 10.1016/j.molcel.2017.05.006. [DOI] [PubMed] [Google Scholar]
- 60.Ishiguro H, Koga M, Horiuchi Y, Noguchi E, Morikawa M, Suzuki Y, Arai M, Niizato K, Iritani S, Itokawa M, et al. (2010). Supportive evidence for reduced expression of GNB1L in schizophrenia. Schizophr Bull 36, 756–765. 10.1093/schbul/sbn160. [DOI] [PMC free article] [PubMed] [Google Scholar]
- 61.Gong L, Liu M, Jen J, and Yeh ET (2000). GNB1L, a gene deleted in the critical region for DiGeorge syndrome on 22q11, encodes a G-protein beta-subunit-like polypeptide. Biochim Biophys Acta 1494, 185–188. 10.1016/s0167-4781(00)00189-5. [DOI] [PubMed] [Google Scholar]
- 62.Funke B, Pandita RK, and Morrow BE (2001). Isolation and characterization of a novel gene containing WD40 repeats from the region deleted in velo-cardio-facial/DiGeorge syndrome on chromosome 22q11. Genomics 73, 264–271. 10.1006/geno.2000.6506. [DOI] [PubMed] [Google Scholar]
- 63.Toledo LI, Altmeyer M, Rask MB, Lukas C, Larsen DH, Povlsen LK, Bekker-Jensen S, Mailand N, Bartek J, and Lukas J (2013). ATR prohibits replication catastrophe by preventing global exhaustion of RPA. Cell 155, 1088–1103. 10.1016/j.cell.2013.10.043. [DOI] [PubMed] [Google Scholar]
- 64.Han T, Goralski M, Capota E, Padrick SB, Kim J, Xie Y, and Nijhawan D (2016). The antitumor toxin CD437 is a direct inhibitor of DNA polymerase alpha. Nat Chem Biol 12, 511–515. 10.1038/nchembio.2082. [DOI] [PMC free article] [PubMed] [Google Scholar]
- 65.Ercilla A, Benada J, Amitash S, Zonderland G, Baldi G, Somyajit K, Ochs F, Costanzo V, Lukas J, and Toledo L (2020). Physiological Tolerance to ssDNA Enables Strand Uncoupling during DNA Replication. Cell Rep 30, 2416–2429 e2417. 10.1016/j.celrep.2020.01.067. [DOI] [PubMed] [Google Scholar]
- 66.Branon TC, Bosch JA, Sanchez AD, Udeshi ND, Svinkina T, Carr SA, Feldman JL, Perrimon N, and Ting AY (2018). Efficient proximity labeling in living cells and organisms with TurboID. Nat Biotechnol 36, 880–887. 10.1038/nbt.4201. [DOI] [PMC free article] [PubMed] [Google Scholar]
- 67.Teo G, Liu G, Zhang J, Nesvizhskii AI, Gingras AC, and Choi H (2014). SAINTexpress: improvements and additional features in Significance Analysis of INTeractome software. J Proteomics 100, 37–43. 10.1016/j.jprot.2013.10.023. [DOI] [PMC free article] [PubMed] [Google Scholar]
- 68.Machleidt T, Woodroofe CC, Schwinn MK, Mendez J, Robers MB, Zimmerman K, Otto P, Daniels DL, Kirkland TA, and Wood KV (2015). NanoBRET--A Novel BRET Platform for the Analysis of Protein-Protein Interactions. ACS Chem Biol 10, 1797–1804. 10.1021/acschembio.5b00143. [DOI] [PubMed] [Google Scholar]
- 69.Nabet B, Roberts JM, Buckley DL, Paulk J, Dastjerdi S, Yang A, Leggett AL, Erb MA, Lawlor MA, Souza A, et al. (2018). The dTAG system for immediate and target-specific protein degradation. Nat Chem Biol 14, 431–441. 10.1038/s41589-018-0021-8. [DOI] [PMC free article] [PubMed] [Google Scholar]
- 70.Nabet B, Ferguson FM, Seong BKA, Kuljanin M, Leggett AL, Mohardt ML, Robichaud A, Conway AS, Buckley DL, Mancias JD, et al. (2020). Rapid and direct control of target protein levels with VHL-recruiting dTAG molecules. Nat Commun 11, 4687. 10.1038/s41467-020-18377-w. [DOI] [PMC free article] [PubMed] [Google Scholar]
- 71.Fowler DM, and Fields S (2014). Deep mutational scanning: a new style of protein science. Nat Methods 11, 801–807. 10.1038/nmeth.3027. [DOI] [PMC free article] [PubMed] [Google Scholar]
- 72.Weile J, Sun S, Cote AG, Knapp J, Verby M, Mellor JC, Wu Y, Pons C, Wong C, van Lieshout N, et al. (2017). A framework for exhaustively mapping functional missense variants. Mol Syst Biol 13, 957. 10.15252/msb.20177908. [DOI] [PMC free article] [PubMed] [Google Scholar]
- 73.Sun S, Weile J, Verby M, Wu Y, Wang Y, Cote AG, Fotiadou I, Kitaygorodsky J, Vidal M, Rine J, et al. (2020). A proactive genotype-to-patient-phenotype map for cystathionine beta-synthase. Genome Med 12, 13. 10.1186/s13073-020-0711-1. [DOI] [PMC free article] [PubMed] [Google Scholar]
- 74.Guerois R, Nielsen JE, and Serrano L (2002). Predicting changes in the stability of proteins and protein complexes: a study of more than 1000 mutations. J Mol Biol 320, 369–387. 10.1016/S0022-2836(02)00442-4. [DOI] [PubMed] [Google Scholar]
- 75.Jumper J, Evans R, Pritzel A, Green T, Figurnov M, Ronneberger O, Tunyasuvunakool K, Bates R, Zidek A, Potapenko A, et al. (2021). Highly accurate protein structure prediction with AlphaFold. Nature 596, 583–589. 10.1038/s41586-021-03819-2. [DOI] [PMC free article] [PubMed] [Google Scholar]
- 76.Paul VD, and Lill R (2015). Biogenesis of cytosolic and nuclear iron-sulfur proteins and their role in genome stability. Biochim Biophys Acta 1853, 1528–1539. 10.1016/j.bbamcr.2014.12.018. [DOI] [PubMed] [Google Scholar]
- 77.Babbar M, Basu S, Yang B, Croteau DL, and Bohr VA (2020). Mitophagy and DNA damage signaling in human aging. Mech Ageing Dev 186, 111207. 10.1016/j.mad.2020.111207. [DOI] [PMC free article] [PubMed] [Google Scholar]
- 78.Veatch JR, McMurray MA, Nelson ZW, and Gottschling DE (2009). Mitochondrial dysfunction leads to nuclear genome instability via an iron-sulfur cluster defect. Cell 137, 1247–1258. 10.1016/j.cell.2009.04.014. [DOI] [PMC free article] [PubMed] [Google Scholar]
- 79.Yaneva D, Sparks JL, Donsbach M, Zhao S, Weickert P, Bezalel-Buch R, Stingele J, and Walter JC (2023). The FANCJ helicase unfolds DNA-protein crosslinks to promote their repair. Mol Cell 83, 43–56 e10. 10.1016/j.molcel.2022.12.005. [DOI] [PMC free article] [PubMed] [Google Scholar]
- 80.Goto GH, Ogi H, Biswas H, Ghosh A, Tanaka S, and Sugimoto K (2017). Two separate pathways regulate protein stability of ATM/ATR-related protein kinases Mec1 and Tel1 in budding yeast. PLoS Genet 13, e1006873. 10.1371/journal.pgen.1006873. [DOI] [PMC free article] [PubMed] [Google Scholar]
- 81.Stirling PC, Bloom MS, Solanki-Patil T, Smith S, Sipahimalani P, Li Z, Kofoed M, Ben-Aroya S, Myung K, and Hieter P (2011). The complete spectrum of yeast chromosome instability genes identifies candidate CIN cancer genes and functional roles for ASTRA complex components. PLoS Genet 7, e1002057. 10.1371/journal.pgen.1002057. [DOI] [PMC free article] [PubMed] [Google Scholar]
- 82.You J, Sobreira NL, Gable DL, Jurgens J, Grange DK, Belnap N, Siniard A, Szelinger S, Schrauwen I, Richholt RF, et al. (2016). A Syndromic Intellectual Disability Disorder Caused by Variants in TELO2, a Gene Encoding a Component of the TTT Complex. Am J Hum Genet 98, 909–918. 10.1016/j.ajhg.2016.03.014. [DOI] [PMC free article] [PubMed] [Google Scholar]
- 83.Ziegler A, Bader P, McWalter K, Douglas G, Houdayer C, Bris C, Rouleau S, Coutant R, Colin E, and Bonneau D (2019). Confirmation that variants in TTI2 are responsible for autosomal recessive intellectual disability. Clin Genet 96, 354–358. 10.1111/cge.13603. [DOI] [PubMed] [Google Scholar]
- 84.Zimmermann M, Murina O, Reijns MAM, Agathanggelou A, Challis R, Tarnauskaite Z, Muir M, Fluteau A, Aregger M, McEwan A, et al. (2018). CRISPR screens identify genomic ribonucleotides as a source of PARP-trapping lesions. Nature 559, 285–289. 10.1038/s41586-018-0291-z. [DOI] [PMC free article] [PubMed] [Google Scholar]
- 85.Merrill RA, Song J, Kephart RA, Klomp AJ, Noack CE, and Strack S (2019). A robust and economical pulse-chase protocol to measure the turnover of HaloTag fusion proteins. J Biol Chem 294, 16164–16171. 10.1074/jbc.RA119.010596. [DOI] [PMC free article] [PubMed] [Google Scholar]
- 86.Weile J, Kishore N, Sun S, Maaieh R, Verby M, Li R, Fotiadou I, Kitaygorodsky J, Wu Y, Holenstein A, et al. (2021). Shifting landscapes of human MTHFR missense-variant effects. Am J Hum Genet 108, 1283–1300. 10.1016/j.ajhg.2021.05.009. [DOI] [PMC free article] [PubMed] [Google Scholar]
- 87.Mirdita M, Schutze K, Moriwaki Y, Heo L, Ovchinnikov S, and Steinegger M (2022). ColabFold: making protein folding accessible to all. Nat Methods 19, 679–682. 10.1038/s41592-022-01488-1. [DOI] [PMC free article] [PubMed] [Google Scholar]
- 88.Evans R, O’Neill M, Pritzel A, Antropova N, Senior A, Green T, Žídek A, Bates R, Blackwell S, Yim J, et al. (2022). Protein complex prediction with AlphaFold-Multimer. bioRxiv, 2021.2010.2004.463034. 10.1101/2021.10.04.463034. [DOI] [Google Scholar]
- 89.Pettersen EF, Goddard TD, Huang CC, Meng EC, Couch GS, Croll TI, Morris JH, and Ferrin TE (2021). UCSF ChimeraX: Structure visualization for researchers, educators, and developers. Protein Sci 30, 70–82. 10.1002/pro.3943. [DOI] [PMC free article] [PubMed] [Google Scholar]
Associated Data
This section collects any data citations, data availability statements, or supplementary materials included in this article.
Supplementary Materials
Table S1. Gene ranking of γ-H2AX FACS CRISPR screens. Related to Figure 1.
Table S2. Hits in γ-H2AX FACS CRISPR screens. Related to Figure 1.
Table S3. Gene ontology analysis and GO-Figure analysis of hits in γ-H2AX FACS CRISPR screens. Related to Figure 1.
Table S5. Peptide counts of GNB1L Flag-AP and miniTurbo-BioID mass spectrometry experiments. Related to Figure 6.
Table S6. Functional scores of GNB1L deep mutational scanning study. Related to Figure 6.
Table S7. Predicted aligned error (PAE) of TELO2 residues by AlphaFold2 prediction. Related to Figure 7.
Data Availability Statement
The datasets generated and analyzed during this study are available at Mendeley Data (DOI: 10.17632/z4ht3txn2k.1), NCBI BioProject (PRJNA948427) and ProteomeXchange (PXD043028/PXD043029). These data are publicly available as of the date of publication.
All original code generated in this study is available at Zenodo (DOI: 10.5281/zenodo.7833858) and are publicly available as of the date of publication.
Any additional information required to reanalyze the data reported in this paper is available from the lead contact upon request.