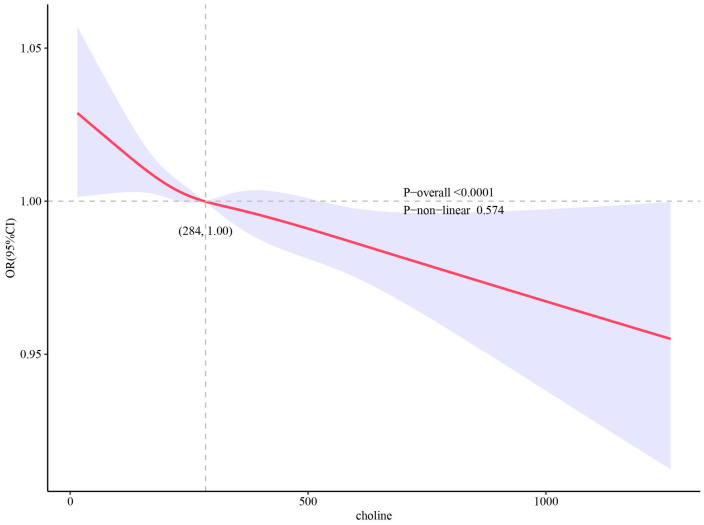
Figure 2.
Restricted cubic spline (RCS) plot of the association between dietary choline intake levels and the presence of CVD. RCS regression was adjusted for age, gender, race, BMI, education level, marital status, smoking status, drinking status, physical activity category, hypertension, DM, and PIR (Model 3). The solid lines and shadow bands represent the OR and 95%CI.

