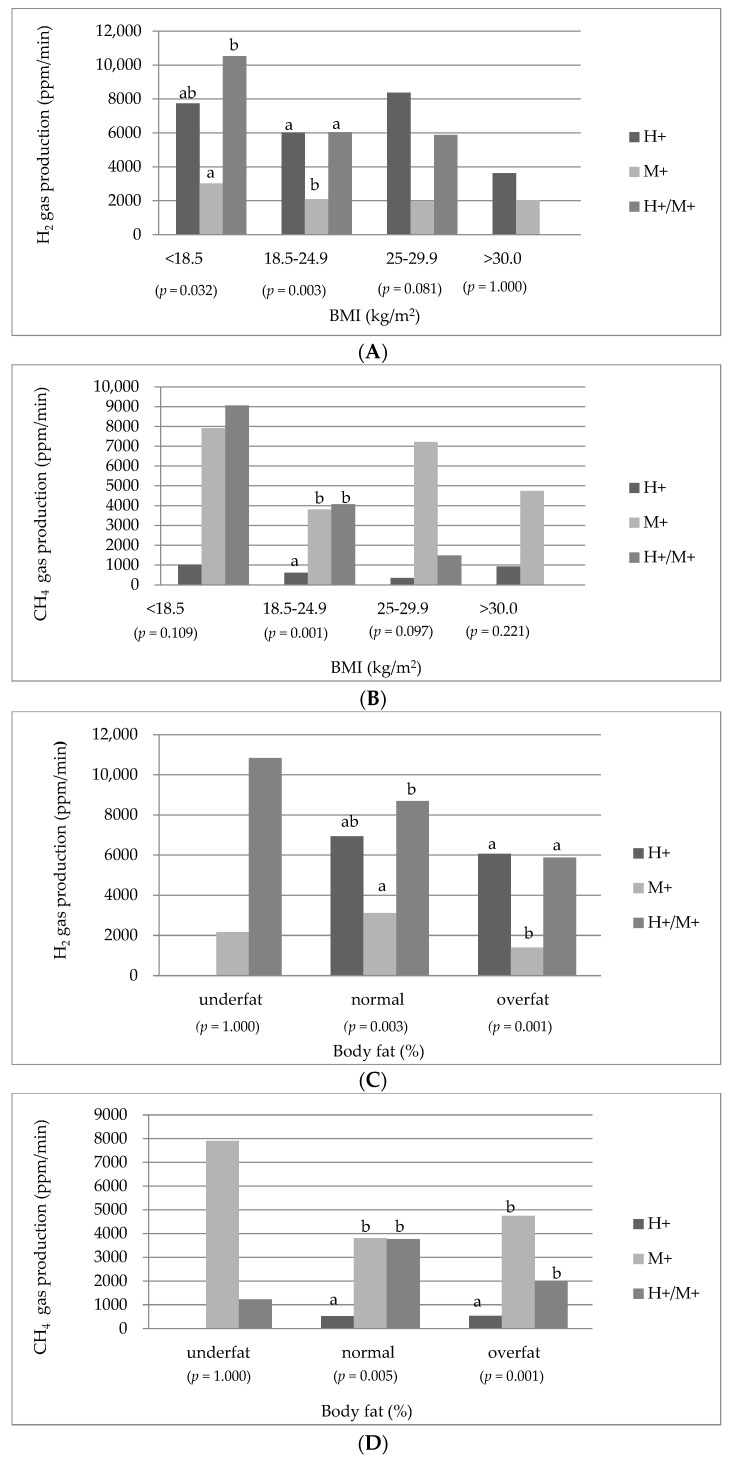
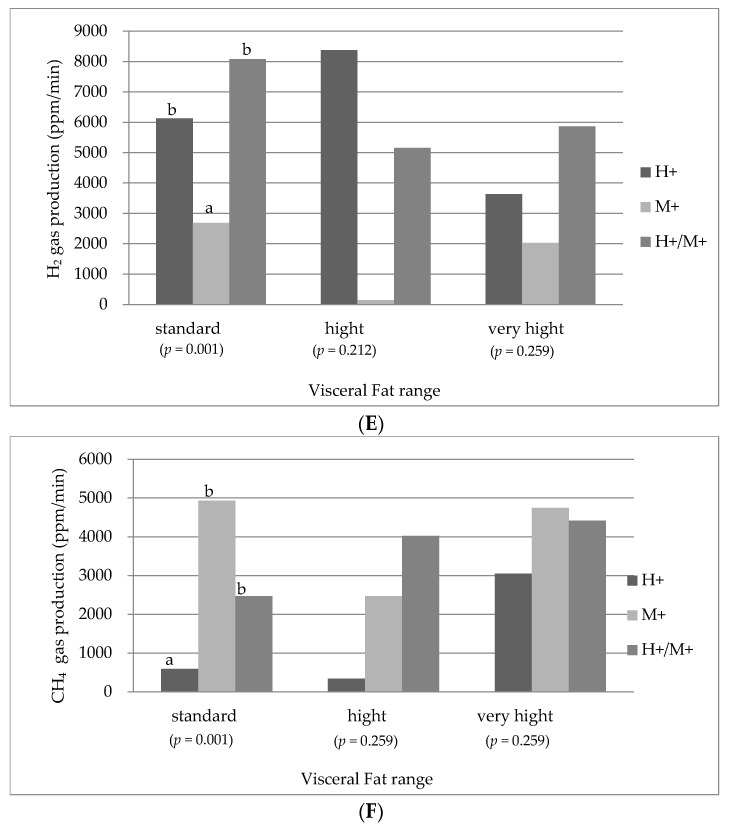
Figure 1.
Median H2 and CH4 concentration as area under the curve (ppm/min) in hydrogen-type, methane-type, hydrogen–methane-type SIBO by BMI classification (A,B), body fat range (C,D), visceral fat range (E,F). p value is for comparison of differences among the 3 groups, significance level of p = 0.05, values calculated with the use of non-parametric Kruskal–Wallis test, verified on the basis of Shapiro–Wilk test, a-b Bonferroni post-hoc test.


