Abstract
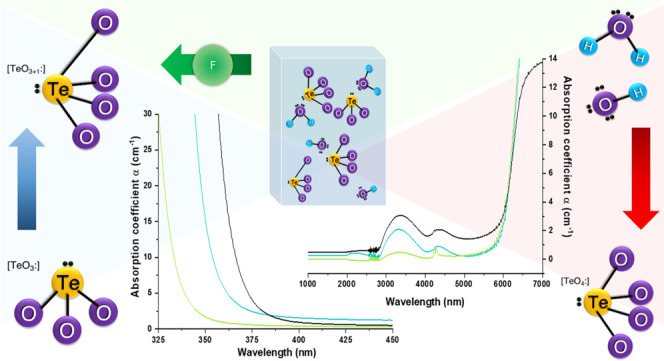
Tellurite glasses have garnered considerable interest as optical host materials due to their advantageous properties, including low processing temperature, high resistance to corrosion and crystallization, and excellent solubility for rare earth ions. However, their applicability in the infrared (IR) region is limited by the absorption of species with distinct vibrations. The incorporation of fluorides has emerged as a promising approach to reduce hydroxyl (OH) absorption during the precursor melting process. In this study, we investigated the influence of ZnF2 on a glass matrix composed of TeO2-ZnO-Na2O, resulting in notable changes in the glass structure and optical properties, with Eu3+ serving as an environmental optical probe. The samples underwent comprehensive structural, thermal, and optical characterization. Structural analyses encompassed 19F and 125Te nuclear magnetic resonance (NMR), with the latter being complemented by mathematical simulations, and these findings were consistent with observations from Raman scattering. The main findings indicate an enhancement in thermal stability, modifications in the Te–O connectivity, and a reduction in emission intensity attributed to the effects of ligand polarizability and symmetry changes around Eu3+. Additionally, the fluorotellurite matrices exhibited a shift in the absorption edge toward higher energies, accompanied by a decrease in mid-IR absorptions, thereby expanding the transparency window. As a result, these glass matrices hold substantial potential for applications across various regions of the electromagnetic spectrum, including optical fiber drawing and the development of solid-state emitting materials.
1. Introduction
Tellurite glasses, based on TeO2, have been widely used as an alternative to traditional SiO2-based glasses in various photonics applications.1−3 Their unique structural and optical properties make them excellent host materials for optical fiber amplifiers, optical sensors, biosensors, energy converters, emitter devices, and several other applications.4−7 Tellurite glasses generally present high stability against crystallization and corrosion, low phonon energy, and low melt and glass transition temperatures compared to other traditional glass matrices.6,8 Moreover, according to their composition, this glass class also shows a highly linear and nonlinear refractive index, a broad optical window, and high solubility for photoluminescent rare earth ions (RE3+).9,10
In general, TeO2 is combined with alkali-based, alkaline earth, and transition metal oxides to form stable glasses.11 For instance, in recent years, several studies on TeO2-ZnO-Na2O ternary glasses (TZN) have been performed for fiber optics drawing due to their interesting nonlinear properties and suitable glass stability.12−14 However, the transparency window in the infrared region is commonly limited to 3 μm for these glasses due to the OH-group content and their strong absorption, which limits their use in some applications.5 In this context, the addition of fluoride ions in tellurite glasses has received significant attention in research due to their potential to reduce the OH– content by reacting with Te–OH bonds and water within the matrix.2,12 Although it is expected to decrease thermal and mechanical stability, this approach proves effective to increase the glass transparency range from UV (∼300 nm) to the mid-IR (4–6 μm), as well as enabling the production of stable glasses and optical fibers with high concentrations of RE3+.7,15−19
Désévédavy and co-authors2 have conducted a comprehensive examination of dehydration processes and their impact on the quality of optical fiber transmission. Undesirable OH absorption, which can originate from either H2O or terminal groups, can have two primary sources: (1) the raw materials and (2) the glass synthesis process. Manufacturers rarely provide information concerning the former source of OH content, as it greatly depends on their specific synthesis methods. Nevertheless, this issue can be addressed through heat treatment of the oxides. However, as demonstrated by Dorofeev and co-authors,20 the use of low O2 pressure during this TeO2 treatment may lead to tellurium reduction, necessitating specific conditions for consideration. In order to achieve better results, some research groups have chosen to prepare their own chemicals.21 The second source of OH content arises during the fusion process and can result from reactions occurring within the melt or the furnace atmosphere. Specific reactions during the melting process can be induced by the addition of solid chemicals, such as alkali fluorides. Alternatively, control of the furnace atmosphere with reactive agents like F2 and Cl2 gases can also achieve the desired outcome, albeit requiring a more complex system. While the addition of alkali fluorides offers a simpler approach, it can significantly alter the structure of the glass matrix, a topic that is seldom discussed.
In summary, various methods have been explored to enhance the mid-infrared (mid-IR) quality of tellurite glasses, ranging from the addition of solid chemicals during the initial stages to controlling the atmosphere during preliminary heat treatment and glass melting in the synthesis process. Contamination from metals with 3d electrons is typically not visually apparent in tellurite glasses, as the electronic absorption edge of tellurite occurs at longer wavelengths than the electronic absorption of these metals.
Furthermore, the choice of crucibles2 plays a significant role in the color of tellurite glasses when working with this type of glass. Common crucibles like platinum or corundum (Al2O3), can have a significant impact on the optical and structural properties. Although Pt or Al do not facilitate redox reactions with TeO2, even during the melting of precursors, some authors have demonstrated that Pt can dissolve in the process, resulting in a yellowish coloration in the glass, unlike the completely transparent appearance achieved with Au crucibles. Considering the conditions required to achieve high mid-IR quality in tellurite-based glasses using desiccant chemicals like alkali fluorides, this study aims to investigate the observed changes in structural behavior when employing zinc fluoride (ZnF2). Au crucibles were utilized to obtain fully transparent bulk glasses, and subsequently, a more detailed exploration of rare earth (RE) element doping is conducted.
Europium (Eu3+) stands out as one of the most captivating and extensively researched RE3+, primarily due to its myriad applications in lasers and optical communication. Additionally, its luminescence properties exhibit remarkable sensitivity to environmental factors, rendering it an invaluable spectroscopic probe.22−24 The 5D0 → 7F2 emission, referred to as hypersensitive, is strictly forbidden in sites with inversion centers;25 therefore, any distortion caused by the environment around the ion increases the emission intensity. As an electric dipole transition, the hypersensitive emission of Eu3+ relies on the establishment of a vector within the ion, necessitating interaction with ligands. The magnitude of this vector decreases as the ion gets closer to a center of symmetry, leading to a reduction in emission intensity.26 In contrast, for the emission involving 7F1, which is a magnetic dipole transition, it is generally unaffected by the environment and can be used to calibrate all other emissions based on the total integrated intensity of the band. As several authors have enlightened,25,27 factors beyond symmetry also influence the emission of most RE3+, especially Eu3+, such as polarizability and shape of ligands, which must be considered before drawing any conclusion. The ratio of 5D0 → 7F2 to 5D0 → 7F2 integrated intensity peak (electric to magnetic intensity ratio, EMIR) can be very helpful in understanding changes in Eu3+ emissions. In most oxide glasses, EMIR values typically fall within the range of 3–7, while for fluorides, they are generally in the range of 0.9–1.3.28
By these means, this study investigated how the addition of fluorine in tellurite glasses alters their optical properties and structural characteristics, with Eu3+ serving as a luminescent probe. In order to obtain additional information on structural behavior, we conducted Raman spectroscopy, 19F nuclear magnetic resonance, and differential scanning calorimetry.
2. Experimental Section
2.1. Materials
Tellurium dioxide (TeO2, Prichem, 99.99%), zinc oxide (ZnO, Alfa Aesar, 99%), anhydrous zinc fluoride (ZnF2, Sigma-Aldrich, 99%), sodium carbonate (Na2CO3, Sigma-Aldrich, 99.5%), and europium oxide (Eu2O3, Lumtec, 99.9%) were used as received from the companies.
2.2. Glass Synthesis and Characterization
Undoped and Eu3+-doped samples were prepared using the conventional melt-quenching method with compositions of TeO2–ZnO–ZnF2–Na2O and TeO2–ZnO–ZnF2–Na2O:Eu2O3, labeled as indicated in Table 1. Each batch was heated in a furnace at 750 °C for 20 min, then poured into a preheated brass mold, annealed for 120 min at 250 °C, and finally cooled at a rate of 10 °C/min down to room temperature. The samples were cut and polished for the measurements. For the samples containing 20 and 30% of ZnF2, the concentrations of TeO2 and Na2O were also reduced. Additionally, samples doped with 0.5 mol % of Eu2O3 for TZN and TZNFx (x = 5, 10, 15, and 20 mol %) were prepared.
Table 1. Sample Labels and Molar Concentrations.
| molar compositions (mol %) |
|||||
|---|---|---|---|---|---|
| sample labels | TeO2 | ZnO | ZnF2 | Na2O | Eu2O3 |
| TZN | 75 | 15 | 0 | 10 | |
| TZNF5 | 75 | 10 | 5 | 10 | |
| TZNF10 | 75 | 5 | 10 | 10 | |
| TZNF15 | 75 | 0 | 15 | 10 | |
| TZNF20 | 70 | 0 | 20 | 10 | |
| TZNF30 | 62 | 0 | 30 | 8 | |
| TZN-Eu | 75 | 15 | 0 | 10 | 0.5 |
| TZNF5-Eu | 75 | 10 | 5 | 10 | 0.5 |
| TZNF10-Eu | 75 | 5 | 10 | 10 | 0.5 |
| TZNF15-Eu | 75 | 0 | 15 | 10 | 0.5 |
| TZNF20-Eu | 70 | 0 | 20 | 10 | 0.5 |
2.3. Differential Scanning Calorimetry
The DSC curves of the glass samples were recorded in a calorimeter DSC 404 F3 Pegasus, Netzsch, to identify the characteristic glass transition temperature (Tg, ±2 K), the onset temperature of crystallization (Tx, ±2 K), and thermal stability parameter (ΔT = Tx – Tg, ±4 K) of the obtained glasses. Each bulk glass sample (∼10 mg) was placed in an alumina crucible and heated from 100 to 550 °C at a heating rate of 10 K min–1 under a nitrogen atmosphere (20 mL min–1).
2.4. Absorption Spectroscopy
The absorption spectra of the glass samples in both the UV–Visible and near-infrared (NIR) regions were measured at room temperature using a dual-beam spectrometer (Varian Cary 500) over the 300–900 nm range with a spectral resolution of 1.0 nm. To calculate the indirect optical band gap values, experimental absorbance data were utilized, and the samples had a thickness of approximately 1.7 mm.
2.5. Raman Spectroscopy
The Raman spectra were recorded over the 50–1500 cm–1 range with a spectral resolution of 1 cm–1 using a LabRAM HR micro-Raman (Horiba Jobin Yvon) equipped with a continuous HeNe laser emitting at 632.8 nm and delivering a power of 17 mW at room temperature.
2.6. Solid-State NMR
19F MAS and 125Te static NMR spectra were recorded in an Agilent DD2 spectrometer operating at 5.64 T (corresponding to 1H Larmor frequency of 240 MHz). 19F spectra were acquired using 1.6 mm rotors spinning at 38 kHz with a DEPTH pulse sequence for background suppression,29 a 90° pulse-length of 1.5 μs, relaxation delays of 300 s, and up to 160 scans for noise average. 19F chemical shifts are reported relative to CFCl3 using solid AlF3 as a secondary reference (−172 ppm). Static 125Te NMR spectra were obtained using the wideband-uniform rate-smooth truncation (WURST) scheme,30,31 combined with the Carr–Purcell–Meiboom–Gill (CPMG) pulse sequence. Identical WURST-80 excitation and refocusing pulses were used, with pulse lengths set to 50.0 μs and the excitation bandwidth set to 500 kHz, recycle delay of 50 s, spikelet separation of 1 and 5 kHz (for crystalline α-TeO2 and the glasses, respectively), and 128 Meiboom–Gill loops. The WURST-CPMG spectra presented here were obtained by fast Fourier transformation of the sum of the individual CPMG-echoes, resulting in an envelope spectrum. The advantage of this second method is that the signal-to-noise ratio is greatly improved. 125Te Chemical shifts are reported relative to Te(CH3)2 using the isotropic shift of α-TeO2 (1469 ppm) as secondary standard.32
2.7. Photoluminescence Spectra
The emission spectra of the Eu3+-doped glass samples within the visible spectral range (550–750 nm) were acquired in a Horiba Fluorolog-3 spectrofluorometer using the front face acquisition mode. A 350 W Xenon arc lamp served as the excitation source, emitting at 394 nm. Detection was performed using a photodiode detector, PPD-850. To ensure accuracy, the emission spectra were corrected for the detection and optical spectral response of the spectrofluorometer.
3. Results and Discussion
The glasses used in this study were optically homogeneous bulk samples with a colorless appearance, as depicted in the inset of Figure 1. A noticeable shift of the absorption edge toward higher energies was observed in samples containing ZnF2 compared to the fluoride-free TZN sample. Figure 1 shows that the TZN sample exhibited an absorption edge at around 375 nm, corresponding to a band gap energy of 3.4 eV. Even with a lower ZnF2 content (5 mol %), the sample exhibited a blue shift of more than 10 nm (or 0.13 eV), resulting in enhanced transparency. This trend continued as the fluoride concentration increased, ultimately reaching 330 nm (with a band gap energy of 3.8 eV) for the TZNF30 sample. Detailed band gap energy values are presented in Figure S1 and Table S1 in the Supporting Information (SI).
Figure 1.
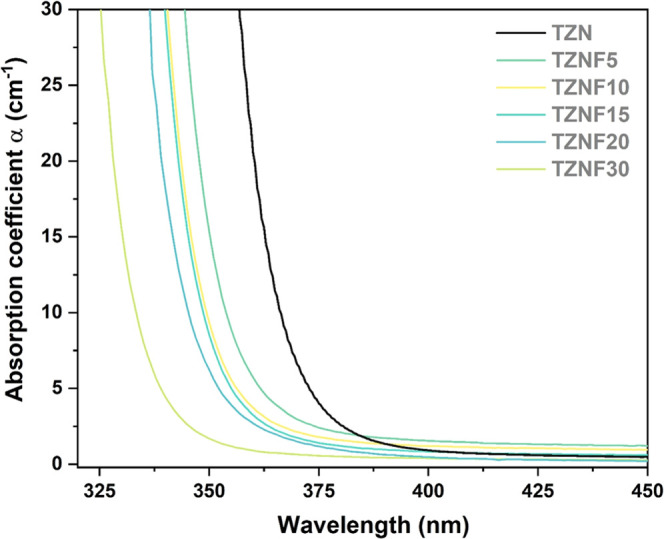
UV–vis absorption spectra carried out from 325 to 450 nm.
In addition to shifting the electronic absorption edge and enhancing transparency in the UV region, the incorporation of fluorides into oxide glasses proves to be an effective strategy for reducing the OH content within the glass network, thereby making them more suitable for infrared (IR) applications. Figure 2 illustrates the transparency window of the glass samples from UV to the mid-infrared range. Within the mid-IR region, two prominent bands at 3.4 and 4.4 μm are associated with free OH groups and H2O content, respectively.39 It is evident that these bands significantly diminish as the concentration of ZnF2 increases. The dehydroxylation process is facilitated by the reactions of ZnF2 during the melting process, which can be described by the following equations.40
| 1 |
and
| 2 |
Therefore, while the extension of the multiphonon absorption edge is not considerably enhanced in this series, samples with higher ZnF2 content exhibit a significant reduction in the OH band at 3.4 and 4.4 μm. This behavior not only confirms the effectiveness of fluoride addition as an efficient strategy for producing oxide glasses with low OH content but also highlights the promising potential of these matrices as host materials for mid-IR lasers and optical amplifiers. Moreover, when combined with the favorable characteristics of tellurite glasses, including good thermal stability and high RE3+ solubility, these fluoride-modified glasses become even more suitable for such applications.41−43
Figure 2.
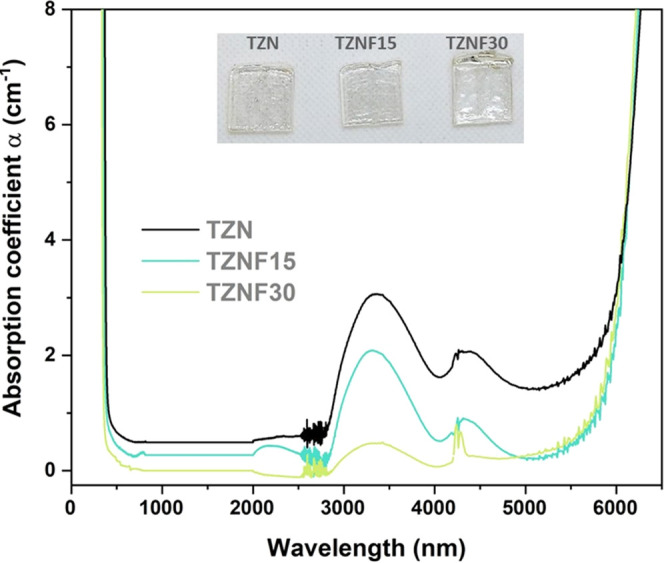
TZN, TZNF15, and TZNF30 transparency windows were obtained from the UV to mid-IR range. Inset: photograph of the synthesized glass samples.
The DSC curves were recorded for TZN, TZNF5, TZNF15, TZNF20, and TZNF30 samples and are presented in Figure 3. The characteristic temperatures, including the glass transition (Tg) and the onset of crystallization (Tx), were estimated in accordance with the method described by ref (33) with an associated error of ±2 °C. A decrease in the characteristic temperatures can be observed as the fluoride content amount increases, which is attributed to the glass network depolymerization and softening.18 The addition of ZnF2 increases the ionic character of the matrix by replacing covalent bonds and making the glass structure less connected, lowering the Tg values.34 An increase in the thermal stability against crystallization (ΔT = Tx – Tg) for the samples with 5, 15, and 20 mol % of ZnF2 in comparison to the TZN sample is also observed, as can be seen in Table 2. This behavior is important to evaluate the suitability of the matrices for optical fiber fabrication, as a larger ΔT is desirable to expand the working temperature range without inducing crystallization.35 Once a glass with ΔT ≥ 100 °C is considered stable to be drawing as a fiber, it can be inferred that our tellurite and fluorotellurite glasses are thermically suitable for optical fiber production, with the exception of the TZNF30 sample, which presents a higher tendency for devitrification and a thermal stability of 87 °C.
Figure 3.
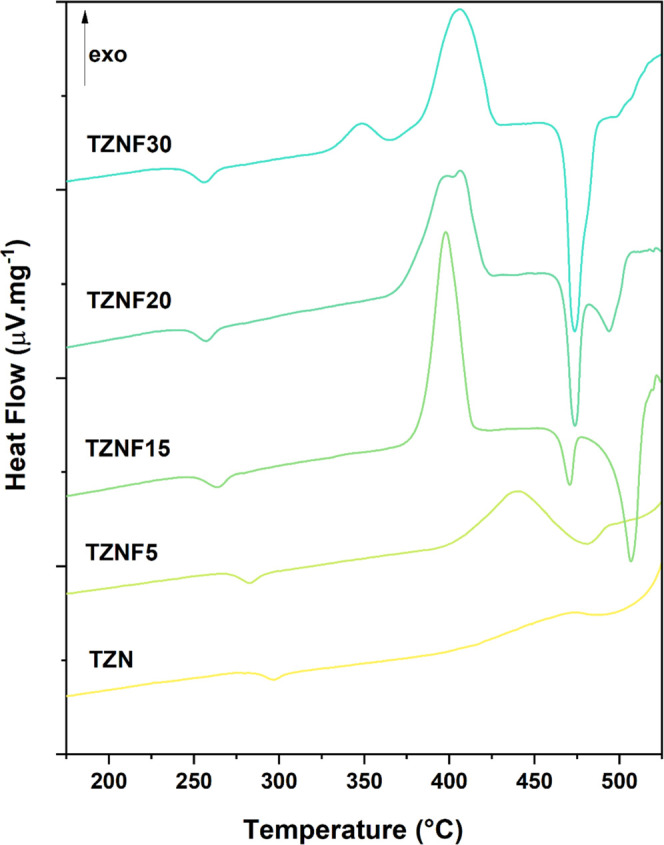
DSC curves for the samples TZN, TZNF5, TZNF15, TZNF20, and TZNF30.
Table 2. Characteristic Temperatures (Tg, Tx, Tp1, and Tp2) and Thermal Stability against Crystallization (ΔT = Tx – Tg) Obtained from DSC Measures.
| samples | Tg (°C) | Tx (°C) | Tp1 (°C) | Tp2 (°C) | ΔT (°C) |
|---|---|---|---|---|---|
| TZN | 285 | 404 | 472 | 119 | |
| TZNF5 | 271 | 400 | 439 | 129 | |
| TZNF15 | 250 | 377 | 397 | 127 | |
| TZNF20 | 247 | 369 | 397 | 406 | 122 |
| TZNF30 | 243 | 330 | 347 | 406 | 87 |
Particularly for the TZNF20 sample, a broad crystallization peak consisting of two distinct components is observed. It appears that these components become more separated as the ZnF2 content increases to 30 mol % in the TZNF30 sample. In the DSC curve of TZNF30, two distinct crystallization peaks are observed, occurring at Tp1 = 347 °C (TZNF30-Tp1) and Tp2 = 406 °C (TZNF30-Tp2). To gain insights into this crystallization behavior, two bulk pieces of the TZNF30 sample were subjected to heat treatment at Tp1 and Tp2 for 30 min, followed by XRD analysis to identify the crystallized phases. XRD results for both portions of the sample (Figure S2) indicate the predominant formation of γ-TeO2 at Tp1 and α-TeO2 at Tp2, along with some degree of mixing of the phase Zn2Te3O8 in both portions. While these results may not have immediate practical implications, they contribute valuable insights into the structural and thermal behavior of this glass system, suggesting that the addition of ZnF2 enhances the tendency for the formation of crystalline TeO2 through network depolymerization.
Raman spectroscopy provides additional insight into the structural changes induced by the addition of ZnF2. Typically, tellurite glasses exhibit characteristic bands in the range of 400–900 cm–1. More specifically, Raman modes between 400 and 500 cm–1 are associated with bonds in Te–O–Te bridging configurations, while the bands in the higher frequency region correspond to tellurite structural units and the presence of non-bridging oxygen (NBO).30 In this study, the focus is on the range of 550–900 cm–1, referred to as the T region, which allows us to describe the structural behavior of the glass network in relation to fluoride content. In Figure 4, the Raman spectra of all samples are presented, exhibiting distinguishable variations in band intensities. To facilitate understanding, the T region (550–900 cm–1) was deconvoluted into four Gaussian peaks, yielding a high correlation coefficient (R2) of ≥ 0.995 across all samples, as shown in Figure S3a–d. The identified vibrational modes labeled T1, T2, T3, and T4 correspond to specific structural units within the tellurite matrix. The T1 band, centered at 610 cm–1, is assigned to the antisymmetric stretching of the [TeO4] units, forming a continuous network.35,36 At 660 cm–1, the T2 band is associated with the antisymmetric vibrations of Te–O–Te bonds, involving two nonequivalent Te–O bonds.35 Additionally, this band is influenced by the presence of [TeO3+1] units, which exhibit a structural deformation with one elongated Te–O bond.37 Hence, these bands can serve as indicators of network connectivity in the glass structure. Finally, the bands observed around 715 and 775 cm–1, labeled as T3 and T4, respectively, can be attributed to the stretching modes of non-bridging oxygen (NBO) in the TeO3 and TeO3+1 units. These bands have been linked to lower coordination [TeO3] units, indicating depolymerization of the glass network.18
Figure 4.
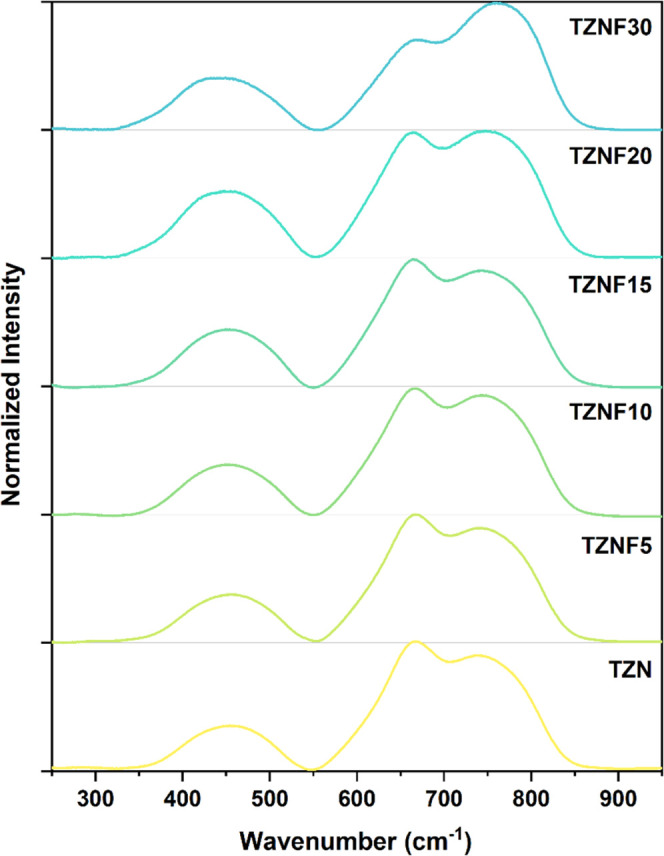
Raman spectra for all undoped glass systems.
The integrated areas of each deconvoluted Raman band were normalized to the total intensity and are presented in Figure 5. To provide a semi-quantitative description of the influence of fluoride content on the glass network, the T1 and T2 bands were combined, as were the T3 and T4 bands. Table S2 presents the attribution, position, and relative area of each Raman band. This approach was employed to better characterize the network connectivity, where higher intensities of T1 and T2 indicate a more connected glass structure, while increased T3 and T4 intensities suggest a more open structural arrangement. As depicted in Figure 5, the incorporation of ZnF2 into the glass composition leads to higher percentage values of T3 and T4 intensities, indicating an increased content of NBOs and the prevalence of [TeO3] units in the glass network.38 Specifically, this increase is most pronounced for the TZNF10 and TZNF30 samples, highlighting significant differences in their structural and optical properties when the fluoride content exceeds 10 mol %. FTIR measurements (Figure S4) were also conducted on the powdered samples; however, no additional insights into the structural behavior could be provided as a complement to the Raman analysis.39−41
Figure 5.
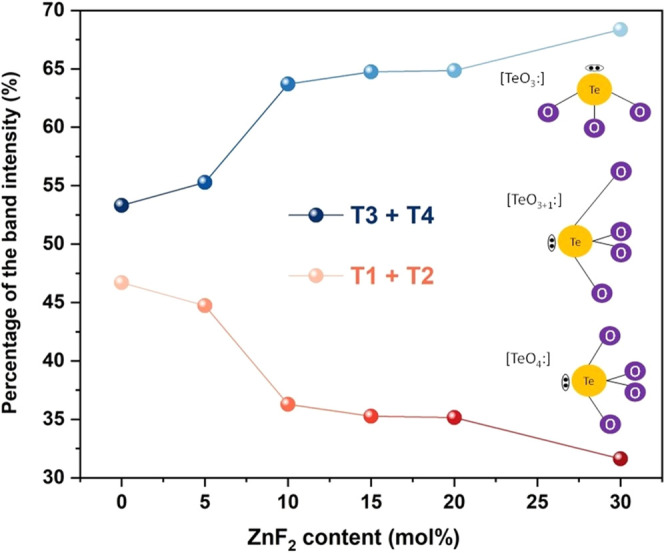
Percentage of characteristic tellurite Raman band intensities grouped as T1 + T2 and T3 + T4.
3.1. 19F and 125Te Solid-State NMR Spectroscopy
Figure 6 displays the high-field 19F MAS–NMR data, revealing two broad resonance bands at approximately −40 ppm and −170 ppm. The asymmetric line shapes suggest the presence of multiple components. Subsequent deconvolution of each broad peak was performed, and the results are summarized in Table 3. The first band is divided into two components centered around −23 ppm (T1) and −49 ppm (T2), respectively, with the former being more prominent. These chemical shift values are consistent with literature values for Te-bonded F species, previously assigned to δiso (19F) = −27 ppm in a toluene solution of TeF4 and δiso (19F) = −45 ppm for TeF5Cl.42,43 Components Z1 and Z2, on the other hand, indicate the involvement of fluorine atoms in an alkaline medium and the presence of Zn–F interactions.44−46 Component Z2 can be attributed to a mixed ZnF2/NaF environment, with a chemical shift around −204 ppm consistent with the reference value for ZnF2 and in proximity to the characteristic shift of NaF (−220 ppm).47,48 The calculated area of each deconvoluted component suggests a trend of increasing Te–F interactions with the fluorine content, attributable to the high TeO2 molar concentration (75 mol %). Additionally, for the TZNF30 sample, an increase in the area of component Z2 is observed, which aligns with the higher amount of ZnF2. These 19F NMR data support the results obtained from Raman spectroscopy and contribute to a better understanding of the glass structure in this system by highlighting the replacement of NBOs through the creation of terminal Te–F bonds.
Figure 6.
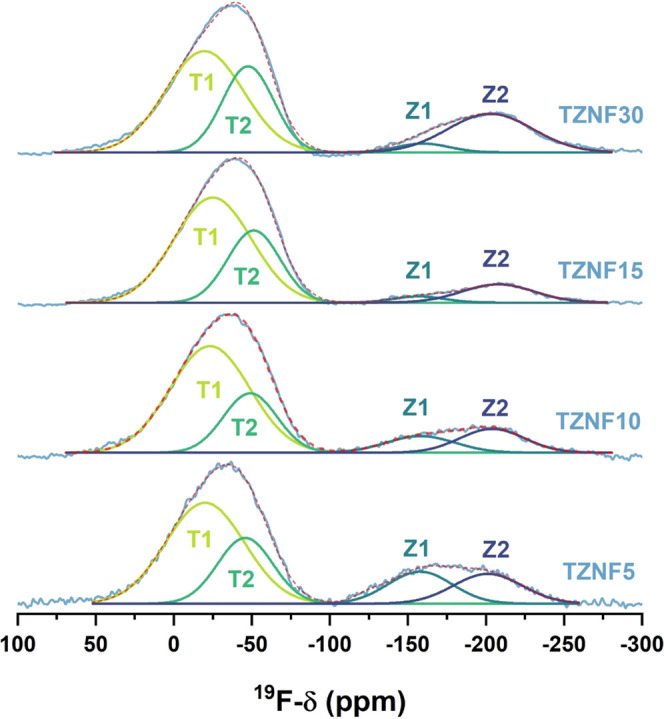
19F MAS–NMR spectra of the fluorotellurite samples with each fit component from tentative deconvolutions in black and gray.
Table 3. Isotropic Chemical Shifts and Fractional Area in Percent of the Integral, as Obtained from the Tentative Fits to the 19F MAS–NMR Spectra to Four Distinct Components.
| component 1 |
component 2 |
component 3 |
component 4 |
|||||
|---|---|---|---|---|---|---|---|---|
| sample | δ 19F (±0.5 ppm) | area (±0.5%) | δ 19F (±0.5 ppm) | area (±0.5%) | δ 19F (±0.5 ppm) | area (±0.5%) | δ 19F (±0.5 ppm) | area (±0.5%) |
| TZNF5 | –21.4 | 50.7 | –51.8 | 23.2 | –156.3 | 13.1 | 202.6 | 13.0 |
| TZNF10 | –23.8 | 59.0 | –47.9 | 22.2 | –157.0 | 7.9 | 204.6 | 10.8 |
| TZNF15 | –25.5 | 60.0 | –48.7 | 27.9 | –157.8 | 2.3 | 208.9 | 9.8 |
| TZNF30 | –20.2 | 49.4 | –46.0 | 27.3 | –158.3 | 2.9 | 204.4 | 20.4 |
Qualitative information about Te structural units can be provided by 125Te NMR. Due to the low abundance (∼7%) and high chemical shift anisotropy, combined with the intrinsic disorder of glasses, high-resolution 125Te NMR is usually not practical in glass systems. Therefore, we have obtained static WURST-CPMG 125Te NMR spectra for selected compositions, which are shown in Figure 7. As indicated by Raman data, the glass structure is formed by a mixture of distinct types of [TeOn] units. As a result, the NMR spectra are characterized by the superposition of resonances from distinct species. The resonance of each species, in its turn, is characterized by broad and anisotropic powder patterns resulting from distributions of chemical shift anisotropy parameters. Due to this strong overlap, the 125Te spectra in Figure 7 do not provide site-selective information. To have qualitative information about the 125Te spectra, we have performed simulations considering a statistical distribution of powder patterns with uncorrelated Gaussian distributions of the three principal values of the chemical shift tensor. This approach was employed recently by us for the study of heavy-metal oxide tellurium-phosphate glasses.49 The best-fit simulations are shown in Figure 7. These simulations need to be treated as a simple mathematical tool to explore the characteristics of the average 125Te NMR line shapes, and the simulation parameters are displayed in Table 4. The observed isotropic shifts agree with those previously observed for fluorophosphotellurite glasses containing similar concentrations of network modifier species.48 The simulations show very minor variations in 125Te NMR line shapes as a function of fluorine concentration. Remarkably, the width of the distribution in δzz becomes narrower for increasing ZnF2 concentration. We can understand this narrower distribution of chemical shift parameters as the preferential formation of a certain type of Te structural unity. This agrees with the Raman results, which show that there is a tendency for the preferential formation of anionic TeO3-like units with increasing F content.
Figure 7.
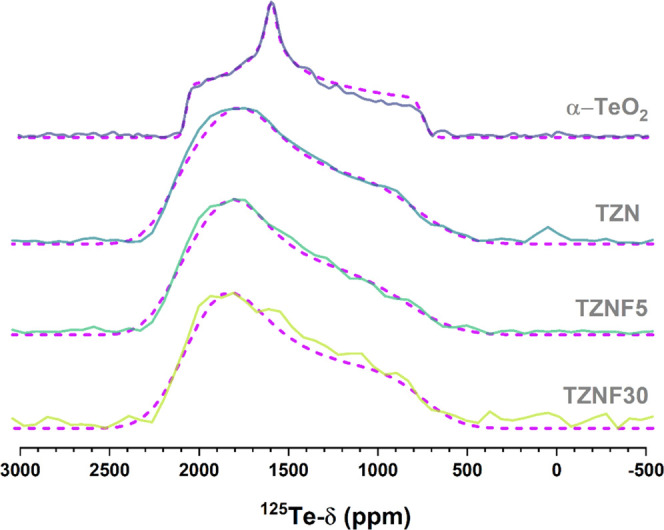
WURST-CPMG 125Te NMR spectra for glass samples TZN, TZNF5, and TZNF30 (black solid curves). The plot shows Fourier-transformed spectra from the sum of the individual echoes in the CPMG FID. Red dashed curves are simulations considering distributions of static CSA powder patterns. 125Te Chemical shifts are referenced to Te(CH3)2.
Table 4. Parameters Obtained from the Simulation of 125Te Spectra Considering the Sum of Chemical Shift Anisotropy Powder Patterns with an Uncorrelated Normal Distribution of Principal Tensor Valuesa.
| samples | δCG(± 5) | δxx(±10) | δyy(±20) | δzz(±10) | Δδxx(±50) | Δδyy(±50) | Δδzz(±50) | Δ(±10) |
|---|---|---|---|---|---|---|---|---|
| TZN | 1540 | 2150 | 1760 | 745 | 100 | 300 | 600 | 200 |
| TZNF5 | 1589 | 2150 | 1800 | 850 | 50 | 200 | 500 | 210 |
| TZNF30 | 1522 | 2100 | 1820 | 730 | 50 | 200 | 200 | 250 |
| α-TeO2 | 1469 | 2070 | 1596 | 742 | 35 |
δii is the average value for the chemical shift principal values and Δδiiis the width of the distribution for each parameter. An isotropic line broadening parameter was also used (Δ) in the simulations. The center of gravity of the experimental spectrum, δCG, is also shown. All values are given in ppm, relative to Te(CH3)2.
3.2. Eu3+ as a Structural Probe for Structural Elucidation
To further elucidate the structural changes induced by the addition of ZnF2, TZN and TZNF samples doped with Eu3+ were prepared, utilizing europium emission as a luminescent probe. Figure 8 illustrates the luminescence spectra of Eu3+ incorporated in the tellurite glass samples. To enhance the visualization of changes in the intensity of the 5D0 → 7F2 hypersensitive transition, known to be dependent on the symmetry degree around Eu3+, the spectra were normalized to the emission intensity of the 5D0 → 7F1 transition. The observed decrease in band intensity for the J = 2 emission with increasing fluoride content clearly indicates that the presence of fluoride induces changes in the Eu3+ environment. Hypersensitive emission relies on the interaction with the dipole vector of ligands in the first coordination sphere and the distortion of the symmetric center. These changes suggest that Eu3+ preferentially binds with fluoride, a poorly polarizable ligand, even at low concentrations. Additionally, the addition of fluoride may bring the Eu3+ site closer to a centrosymmetric environment, resulting in a decrease in emission intensity, as demonstrated by the calculated EMIR (Europium Maximum Intensity Ratio). Furthermore, the analysis of the ratio between the integrated intensity of the non-normalized J = 2 and 1 transitions confirms the initial observation. The obtained values were 3.0, 2.8, 2.4, and 1.8 for TZN-Eu, TZNF5-Eu, TZNF10-Eu, and TZNF15-Eu, respectively, as shown in the inset of Figure 8. While the ratio of TZN falls within the expected range for oxide glasses, the addition of fluoride decreases the ratio to a minimum of 1.8, which is very close to that of fluoride glass matrices.28 Consequently, the values of EMIR indicate that the 5D0 → 7F2 transition is always dominant in these matrices, and the lower the fluoride content, the closer the site approaches a centrosymmetric environment expected for Eu3+.
Figure 8.
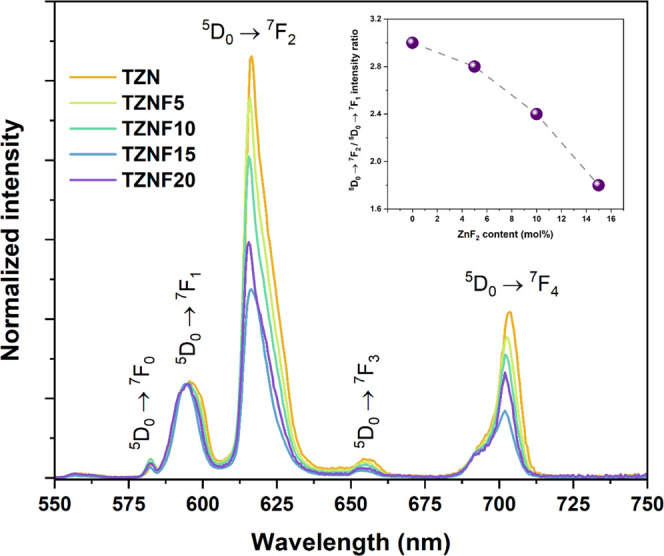
Photoluminescence spectra of fluorotellurite samples doped with Eu3+.
Furthermore, it might be expected that the emissions of TZNF15-Eu and TZNF20-Eu would exhibit an inversion in intensity as the fluoride content increases. However, it should be noted that TZNF20-Eu demonstrates a significant decrease in TeO2 content compared to the TZNF15-Eu sample. Therefore, a direct comparison of the two emissions must consider the structural changes that may have occurred between them. The results suggest that, despite the higher fluoride concentration, modifications induced in the matric structure have led to the Eu3+ occupying sites with enhanced emission symmetry. As discussed, the emission is influenced not only by the polarizability of fluoride but also by the symmetry of the europium ion’s site, which is likely closer to a group with an inversion center for TZNF5-Eu, TZNF10-Eu, and TZNF15-Eu. The Ω2 and Ω4 parameters were calculated using Judd–Ofelt from Emission Spectra (JOES) software50 and are presented in Table 5. This software simplifies the JO parameter calculations by inputting the Eu3+ emission spectra and indicating the emission range for each specific electronic transition. The refractive index values (n = 1.96) used for the calculations were obtained from matrices with similar compositions reported in the literature, such as 75TeO2-15ZnO-10Na2O, which is identical to the TZN in this study, and 70TeO2-10ZnO-20ZnF2, to account for the presence of ZnF2.18,51
Table 5. Calculated Judd–Ofelt Parameters Ω2 and Ω4 and Comparison with the Literature.
| n | Ω2 [10–20 cm2] | Ω4 [10–20 cm2] | references | |
|---|---|---|---|---|
| TZN-Eu | 1.96 | 5.496 | 4.043 | this work |
| TZNF5-Eu | 1.96 | 4.846 | 3.323 | this work |
| TZNF10-Eu | 1.96 | 4.201 | 2.922 | this work |
| TZNF15-Eu | 1.96 | 3.177 | 2.350 | this work |
| TZNF20-Eu | 1.96 | 3.357 | 2.570 | this work |
| TeO2–Li2CO3 | 2.40 | 11.06 | 4.58 | (26) |
| TeO2–Li2O-K2O-ZnF2 | 1.99 | 3.77 | 2.10 | (52) |
| P2O5–MgO–ZnSO4 | 1.75 | 14.40 | 1.26 | (53) |
| SiO2 (nanofiber) | 1.45 | 3.27 | 2.80 | (54) |
| (Y0,7Gd0,3)2O3 | 1.65 | 1.30 | 1.20 | (55) |
The Ω2 parameter has been associated with the covalence of the glass matrix and the symmetry around Eu3+, while the Ω4 parameter has been linked to the rigidity and viscosity of the glassy network.26,52 However, it should be noted that further research is needed to fully understand the Ω4 parameter. In Table 5, both experimental parameters Ω2 and Ω4 exhibit a decrease as the fluoride concentration increases. This trend aligns with the findings from EMIR calculations and reinforces the notion that the addition of fluoride to the matrix modifies europium emission by altering properties such as network connectivity and the character of ionic/covalent bonds. The decrease in Ω4, indicative of a less rigid matrix, is consistent with the observed decrease in Tg. It is important to mention that caution is advised when interpreting small changes in the experimental parameters Ω2 and Ω4, as there may be an error margin of up to 20%. Nevertheless, these results are in line with the conclusions drawn from other characterization techniques, including DSC, Raman, and NMR data.
4. Conclusions
The structural and optical properties of tellurite and fluorotellurite glasses were thoroughly examined in this study. The results demonstrate that the incorporation of fluoride induces significant changes in tellurite glasses, leading to a less covalently connected matrix, particularly affecting the [TeO3] domains and enhancing the thermal stability against crystallization. Moreover, the Raman results obtained in this study are consistent with those obtained from the solid-state nuclear magnetic resonance (NMR) of 125Te and 19F. The addition of fluoride expands the transparency range of fluorotellurite glasses, both in the ultraviolet and infrared regions, resulting in a notable shift in the electronic edge and a significant reduction in OH band absorption. Furthermore, the investigation of luminescence behavior using Eu3+ as a spectroscopic probe reveals a strong interaction between fluoride and the emitting ion. This interaction also influences the glass matrix, affecting the coordination environment and modifying the emission through changes in ligand polarizability and symmetry. Despite a decrease in emission intensity with increasing fluoride concentration, the emission intensity remains higher than in matrices containing solely fluorides, with the dominant process being the 5D0 → 7F2 transition. Hence, these findings suggest that substituting ZnO with ZnF2 in this glass system enhances its optical transmission while preserving thermal stability. Such properties are advantageous for applications involving luminescent glasses and the fabrication of optical fibers with low OH content.
Acknowledgments
The authors acknowledge the financial support provided by the Brazilian research grants from São Paulo Research Foundation—FAPESP (2020/11038-2, 2020/12280-1, 2022/02974-1, and 2021/08111-2), CAPES (88887.495341/2020-00), and CNPq (405048/2021-1 and 311069/2020-7). R.G.C. acknowledges the funding received from Campus France 116708R.
Supporting Information Available
The Supporting Information is available free of charge at https://pubs.acs.org/doi/10.1021/acsomega.3c05010.
Band gap energy of all undoped glass samples calculated by the Tauc Plot method; complementary measurements of XRD and FTIR and deconvolution of Raman spectra for the TZN, TZNF10, TZNF20, and TZNF30 samples (PDF)
Author Contributions
§ R.G.C. and R.S.B. equally contributing authors.
The authors declare no competing financial interest.
Supplementary Material
References
- Mori A. Tellurite-based fibers and their applications to optical communication networks. J. Ceram. Soc. Jpn. 2008, 116, 1040–1051. 10.2109/jcersj2.116.1040. [DOI] [Google Scholar]
- Désévédavy F.; Strutynski C.; Lemière A.; Mathey P.; Gadret G.; Jules J.; Kibler B.; Smektala F. Review of tellurite glasses purification issues for mid-IR optical fiber applications. J. Am. Ceram. Soc. 2020, 103, 4017–4034. 10.1111/jace.17078. [DOI] [Google Scholar]
- Saini T. S.; Sinha R. K. Mid-infrared supercontinuum generation in soft-glass specialty optical fibers: A review. Prog Quantum Electron. 2021, 78, 100342 10.1016/j.pquantelec.2021.100342. [DOI] [Google Scholar]
- Manzani D.; Petruci J. F. D. S.; Nigoghossian K.; Cardoso A. A.; Ribeiro S. J. L. A portable luminescent thermometer based on green up-conversion emission of Er3+/Yb3+ co-doped tellurite glass. Sci. Rep. 2017, 7, 41596 10.1038/srep41596. [DOI] [PMC free article] [PubMed] [Google Scholar]
- Lin A.; Zhang A.; Bushong E. J.; Toulouse J. Solid-core tellurite glass fiber for infrared and nonlinear applications. Opt. Express 2009, 17, 16716. 10.1364/OE.17.016716. [DOI] [PubMed] [Google Scholar]
- Jha A.; Richards B. D. O.; Jose G.; Toney Fernandez T.; Hill C. J.; Lousteau J.; Joshi P. Review on structural, thermal, optical and spectroscopic properties of tellurium oxide based glasses for fibre optic and waveguide applications. Int. Mater. Rev. 2012, 57, 357–382. 10.1179/1743280412Y.0000000005. [DOI] [Google Scholar]
- Ebendorff-Heidepriem H.; Kuan K.; Oermann M. R.; Knight K.; Monro T. M. Extruded tellurite glass and fibers with low OH content for mid-infrared applications. Opt. Mater. Express 2012, 2, 432. 10.1364/OME.2.000432. [DOI] [Google Scholar]
- Noguera O.; Merle-Méjean T.; Mirgorodsky A. P.; Smirnov M. B.; Thomas P.; Champarnaud-Mesjard J.-C. Vibrational and structural properties of glass and crystalline phases of TeO2. J. Non-Cryst. Solids 2003, 330, 50–60. 10.1016/j.jnoncrysol.2003.08.052. [DOI] [Google Scholar]
- El-Mallawany R. A. H.Tellurite Glasses Handbook: Physical Properties and Data, 2nd ed.; CRC Press, 2016. [Google Scholar]
- Wang W. C.; Zhang W. J.; Li L. X.; Liu Y.; Chen D. D.; Qian Q.; Zhang Q. Y. Spectroscopic and structural characterization of barium tellurite glass fibers for mid-infrared ultra-broad tunable fiber lasers. Opt. Mater. Express 2016, 6, 2095–2107. 10.1364/ome.6.002095. [DOI] [Google Scholar]
- Mirdda J. N.; Mukhopadhyay S.; Sahu K. R.; Goswami M. N. Enhancement of Optical Emission and Dielectric Properties of Eu3+-Doped Na2O–ZnO–TeO2 Glass Material. Glass Phys. Chem. 2020, 46, 218–227. 10.1134/S1087659620030104. [DOI] [Google Scholar]
- Savelii I.; Desevedavy F.; Jules J.-C.; Gadret G.; Fatome J.; Kibler B.; Kawashima H.; Ohishi Y.; Smektala F. Management of OH absorption in tellurite optical fibers and related supercontinuum generation. Opt. Mater. 2013, 35, 1595–1599. 10.1016/j.optmat.2013.04.012. [DOI] [Google Scholar]
- Feng X.; Shi J.; Segura M.; White N. M.; Kannan P.; Loh W. H.; Calvez L.; Zhang X.; Brilland L. Halo-tellurite glass fiber with low OH content for 2-5μm mid-infrared nonlinear applications. Opt. Express 2013, 21, 18949. 10.1364/OE.21.018949. [DOI] [PubMed] [Google Scholar]
- Lin A.; Ryasnyanskiy A.; Toulouse J. Fabrication and characterization of a water-free mid-infrared fluorotellurite glass. Opt Lett. 2011, 36, 740. 10.1364/OL.36.000740. [DOI] [PubMed] [Google Scholar]
- Tao G.; Ebendorff-Heidepriem H.; Stolyarov A. M.; Danto S.; Badding J. V.; Fink Y.; Ballato J.; Abouraddy A. F. Infrared fibers. Adv. Opt. Photonics 2015, 7, 379. 10.1364/AOP.7.000379. [DOI] [Google Scholar]
- Zhan H.; Shi T.; Zhang A.; Zhou Z.; Si J.; Lin A. Nonlinear characterization on mid-infrared fluorotellurite glass fiber. Mater. Lett. 2014, 120, 174–176. 10.1016/j.matlet.2014.01.071. [DOI] [Google Scholar]
- Thomas R. L.; Nampoori V. P. N.; Radhakrishnan P.; Thomas S. Laser induced fluorescence in europium doped zinc tellurite glasses. Optik 2013, 124, 5840–5842. 10.1016/j.ijleo.2013.04.008. [DOI] [Google Scholar]
- O’Donnell M. D.; Richardson K.; Stolen R.; Seddon A. B.; Furniss D.; Tikhomirov V. K.; Rivero C.; Ramme M.; Stegeman R.; Stegeman G.; Couzi M.; Cardinal T. Tellurite and Fluorotellurite Glasses for Fiberoptic Raman Amplifiers: Glass Characterization, Optical Properties, Raman Gain, Preliminary Fiberization, and Fiber Characterization. J. Am. Ceram. Soc. 2007, 90, 1448–1457. 10.1111/j.1551-2916.2007.01574.x. [DOI] [Google Scholar]
- Saad M. In Fluoride Glass Fiber: State of the Art, Proceedings Volume 7316, Fiber Optic Sensors and Applications VI, 2009.
- Dorofeev V. V.; Moiseev A. N.; Churbanov M. F.; Snopatin G. E.; Chilyasov A. V.; Kraev I. A.; Lobanov A. S.; Kotereva T. V.; Ketkova L. A.; Pushkin A. A.; Gerasimenko V. V.; Plotnichenko V. G.; Kosolapov A. F.; Dianov E. M. High-purity TeO2–WO3–(La2O3,Bi2O3) glasses for fiber-optics. Opt. Mater. 2011, 33, 1911–1915. 10.1016/j.optmat.2011.03.032. [DOI] [Google Scholar]
- Mori A.; Kobayashi K.; Yamada M.; Kanamori T.; Oikawa K.; Nishida Y.; Ohishi Y. Low noise broadband tellurite-based Er3+-doped fibre amplifiers. Electron. Lett. 1998, 34, 887. 10.1049/el:19980674. [DOI] [Google Scholar]
- Melgoza-Ramírez M. L.; Ramírez-Bon R. Europium ions as a spectroscopic probe in the study of PMMA-SiO2 hybrid microstructure with variable coupling agent. J. Sol-Gel Sci. Technol. 2021, 46–56. 10.1007/s10971-021-05582-2. [DOI] [Google Scholar]
- Reisfeld R.; Zigansky E.; Gaft M. Europium probe for estimation of site symmetry in glass films, glasses and crystals. Molecular Physics 2004, 102, 1319–1330. 10.1080/00268970410001728609. [DOI] [Google Scholar]
- Kolesnikov I. E.; Povolotskiy A. V.; Mamonova D. V.; Kolesnikov E.Yu.; Kurochkin A. V.; Lähderanta E.; Mikhailov M. D. Asymmetry ratio as a parameter of Eu 3+ local environment in phosphors. J. Rare Earths 2018, 36, 474–481. 10.1016/j.jre.2017.11.008. [DOI] [Google Scholar]
- Cascales C.; Balda R.; Fernández J.; Arriandiaga M. A.; Fdez-Navarro J. M. Fluorescence line narrowing spectroscopy of Eu3+ in TeO2–TiO2–Nb2O5 glass. Opt. Mater. 2009, 31, 1092–1095. 10.1016/j.optmat.2007.12.018. [DOI] [Google Scholar]
- Binnemans K. Interpretation of europium(III) spectra. Coord. Chem. Rev. 2015, 295, 1–45. 10.1016/j.ccr.2015.02.015. [DOI] [Google Scholar]
- Kumar A.; Rai D. K.; Rai S. B. Optical studies of Eu3+ ions doped in tellurite glass. Spectrochim. Acta, Part A 2002, 58, 2115–2125. 10.1016/S1386-1425(01)00684-9. [DOI] [PubMed] [Google Scholar]
- Tanner P. A. Some misconceptions concerning the electronic spectra of tri-positive europium and cerium. Chem. Soc. Rev. 2013, 42, 5090. 10.1039/c3cs60033e. [DOI] [PubMed] [Google Scholar]
- Babu P.; Jayasankar C. K. Optical spectroscopy of Eu3+ ions in lithium borate and lithium fluoroborate glasses. Phys. B 2000, 279, 262–281. 10.1016/S0921-4526(99)00876-5. [DOI] [PubMed] [Google Scholar]
- Cory D. G.; Ritchey W. M. Suppression of signals from the probe in bloch decay spectra. J. Magn. Reson. 1969, 80, 128–132. 10.1016/0022-2364(88)90064-9. [DOI] [Google Scholar]
- Schurko R. W. Ultra-Wideline Solid-State NMR Spectroscopy. Acc. Chem. Res. 2013, 46, 1985–1995. 10.1021/ar400045t. [DOI] [PubMed] [Google Scholar]
- O’Dell L. A. The WURST kind of pulses in solid-state NMR. Solid State Nucl. Magn. Reson. 2013, 55–56, 28–41. 10.1016/j.ssnmr.2013.10.003. [DOI] [PubMed] [Google Scholar]
- Garaga M. N.; Werner-Zwanziger U.; Zwanziger J. W. 125Te NMR Probes of Tellurium Oxide Crystals: Shielding-Structure Correlations. Inorg. Chem. 2018, 57, 892–898. 10.1021/acs.inorgchem.7b02913. [DOI] [PubMed] [Google Scholar]
- Varshneya A. K.; Mauro J. C.. Fundamentals of Inorganic Glasses; Elsevier, 2019. [Google Scholar]
- Miguel A.; Morea R.; Gonzalo J.; Arriandiaga M. A.; Fernandez J.; Balda R. Near-infrared emission and upconversion in Er3+-doped TeO2–ZnO–ZnF2 glasses. J Lumin. 2013, 140, 38–44. 10.1016/j.jlumin.2013.02.059. [DOI] [Google Scholar]
- Manning S.; Ebendorff-Heidepriem H.; Monro T. M. Ternary tellurite glasses for the fabrication of nonlinear optical fibres. Opt. Mater. Express 2012, 2, 140. 10.1364/OME.2.000140. [DOI] [Google Scholar]
- Heo J.; Lam D.; Sigel G. H.; Mendoza E. A.; Hensley D. A. Spectroscopic Analysis of the Structure and Properties of Alkali Tellurite Glasses. J. Am. Ceram. Soc. 1992, 75, 277–281. 10.1111/j.1151-2916.1992.tb08176.x. [DOI] [Google Scholar]
- Sekiya T.; Mochida N.; Ohtsuka A.; Tonokawa M. Raman spectra of MO1/2TeO2 (M = Li, Na, K, Rb, Cs and Tl) glasses. J. Non-Cryst. Solids 1992, 144, 128–144. 10.1016/S0022-3093(05)80393-X. [DOI] [Google Scholar]
- Ahmmad S. K.; Samee M. A.; Taqiullah S. M.; Rahman S. FT-IR and Raman spectroscopic studies of ZnF2 −ZnO–As2 O3 −TeO2 glasses. J. Taibah Univ. Sci. 2016, 10, 329–339. 10.1016/j.jtusci.2014.12.008. [DOI] [Google Scholar]
- Heo J.; Lam D.; Sigel G. H.; Mendoza E. A.; Hensley D. A. Spectroscopic Analysis of the Structure and Properties of Alkali Tellurite Glasses. J. Am. Ceram. Soc. 1992, 75, 277–281. 10.1111/j.1151-2916.1992.tb08176.x. [DOI] [Google Scholar]
- El Agammy E. F.; Doweidar H.; El-Egili K.; Ramadan R. Structure of PbF2–TeO2 glasses and glass-ceramics. J. Mater. Res. Technol. 2020, 9, 4016–4024. 10.1016/j.jmrt.2020.02.028. [DOI] [Google Scholar]
- El Agammy E. F.; Doweidar H.; El-Egili K.; Ramadan R.; Jaremko M.; Emwas A.-H. Structure of NaF–TeO2 glasses and glass-ceramics. Ceram. Int. 2020, 46, 18551–18561. 10.1016/j.ceramint.2020.04.161. [DOI] [Google Scholar]
- Muetterties E. L.; Phillips W. D. Structure and Exchange Processes in Some Inorganic Fluorides by Nuclear Magnetic Resonance1. J. Am. Chem. Soc. 1959, 81, 1084–1088. 10.1021/ja01514a017. [DOI] [Google Scholar]
- Lawlor L. J.; Martin A.; Murchie M. P.; Passmore J.; Sanders J. C. P. 125Te and 19F NMR spectroscopic study of the hydrolysis of pentafluorotellurium chloride: evidence for trans - and cis -HOTeF4 Cl and cis, mer -(HO)2 TeF3 Cl. Can. J. Chem. 1989, 67, 1501–1505. 10.1139/v89-229. [DOI] [Google Scholar]
- Chan J. C. C.; Eckert H. High-resolution 27Al–19F solid-state double resonance NMR studies of AlF3–BaF2–CaF2 glasses. J. Non-Cryst. Solids 2001, 284, 16–21. 10.1016/S0022-3093(01)00373-8. [DOI] [Google Scholar]
- de Oliveira M.; Uesbeck T.; Gonçalves T. S.; Magon C. J.; Pizani P. S.; de Camargo A. S. S.; Eckert H. Network Structure and Rare-Earth Ion Local Environments in Fluoride Phosphate Photonic Glasses Studied by Solid-State NMR and Electron Paramagnetic Resonance Spectroscopies. J. Phys. Chem. C 2015, 119, 24574–24587. 10.1021/acs.jpcc.5b08088. [DOI] [Google Scholar]
- Kilic G.; Issever U. G.; Ilik E. Synthesis, characterization and crystalline phase studies of TeO2–Ta2O5–ZnO/ZnF2 oxyfluoride semiconducting glasses. J. Non-Cryst. Solids 2020, 527, 119747 10.1016/j.jnoncrysol.2019.119747. [DOI] [Google Scholar]
- Zheng A.; Liu S.-B.; Deng F. 19F Chemical Shift of Crystalline Metal Fluorides: Theoretical Predictions Based on Periodic Structure Models. J. Phys. Chem. C 2009, 113, 15018–15023. 10.1021/jp904454t. [DOI] [Google Scholar]
- Capelo R. G.; Gerdes J. M.; Rehfuß U.; Silva L. D.; Hansen M. R.; van Wüllen L.; Eckert H.; Manzani D. Structural characterization of a new fluorophosphotellurite glass system. Dalton Trans. 2023, 52, 2227–2242. 10.1039/D2DT03292A. [DOI] [PubMed] [Google Scholar]
- de Oliveira M.; Amjad R. J.; de Camargo A. S. S.; Eckert H. Network Former Mixing Effects in Heavy Metal Oxide Glasses: Structural Characterization of Lead Zinc Phosphotellurite Glasses Using NMR and EPR Spectroscopies. J. Phys. Chem. C 2018, 122, 23698–23711. 10.1021/acs.jpcc.8b07827. [DOI] [Google Scholar]
- Ćirić A.; Stojadinović S.; Sekulić M.; Dramićanin M. D. JOES: An application software for Judd-Ofelt analysis from Eu3+ emission spectra. J. Lumin. 2019, 205, 351–356. 10.1016/j.jlumin.2018.09.048. [DOI] [Google Scholar]
- Ruan Y.; Ji H.; Johnson B. C.; Ohshima T.; Greentree A. D.; Gibson B. C.; Monro T. M.; Ebendorff-Heidepriem H. Nanodiamond in tellurite glass Part II: practical nanodiamond-doped fibers. Opt. Mater. Express 2015, 5, 73. 10.1364/OME.5.000073. [DOI] [Google Scholar]
- Joseph X.; George R.; Thomas S.; Gopinath M.; Sajna M. S.; Unnikrishnan N. V. Spectroscopic investigations on Eu3+ ions in Li–K–Zn fluorotellurite glasses. Opt. Mater. 2014, 37, 552–560. 10.1016/j.optmat.2014.07.021. [DOI] [Google Scholar]
- Danmallam I. M.; Ghoshal S. K.; Ariffin R.; Jupri S. A.; Sharma S.; Bulus I. Judd-Ofelt evaluation of europium ion transition enhancement in phosphate glass. Optik 2019, 196, 163197 10.1016/j.ijleo.2019.163197. [DOI] [Google Scholar]
- Chen J.; Song Y.; Sheng Y.; Chang M.; Xie X.; Abualrejal M. M. A.; Guan H.; Shi Z.; Zou H. Luminescence properties and Judd–Ofelt analysis of SiO 2:Ln 3+ (Eu, Tb) hollow nanofibers fabricated by co-axial electrospinning method. J. Alloys Compd. 2017, 716, 144–155. 10.1016/j.jallcom.2017.05.070. [DOI] [Google Scholar]
- Vujčić I.; Glais E.; Vuković K.; Sekulić M.; Mašić S.; Chanéac C.; Dramićanin M. D.; Viana B. Radiation effects, photoluminescence and radioluminescence of Eu-doped (Y0.7Gd0.3)2O3 nanoparticles with various sizes. Opt. Mater. 2018, 86, 582–589. 10.1016/j.optmat.2018.10.049. [DOI] [Google Scholar]
Associated Data
This section collects any data citations, data availability statements, or supplementary materials included in this article.


