

Abstract
Background
Childhood cancer survivors are at increased risk for the development of secondary sarcomas. Exposure to radiation therapy is a known risk factor for the development of these sarcomas. Other risk factors for secondary sarcomas have not been well described for childhood cancer survivors. We analyzed a large cohort of childhood cancer survivors to determine the true incidence of secondary sarcomas and to examine factors associated with the risk of developing secondary sarcomas.
Methods
The history of secondary sarcomas in 14 372 participants in the Childhood Cancer Survivor Study was determined from self-reports in three questionnaires. Risk of secondary sarcoma was evaluated by use of standardized incidence ratios (SIRs) and excess absolute risks (EARs) as calculated by use of data from the Surveillance, Epidemiology, and End Results Program. Cox regression models were used to estimate hazard ratios of developing subsequent sarcomas. Hazard ratios were reported as relative risks (RRs).
Results
We identified 108 patients with sarcomas that were diagnosed a median of 11 years after the diagnosis of childhood cancer. The risk of sarcoma was more than ninefold higher among childhood cancer survivors than among the general population (SIR = 9.02, 95% confidence interval [CI] = 7.44 to 10.93). The excess absolute risk of secondary sarcoma was 32.5 per 100 000 person-years (95% CI = 26.1 to 40.3 per 100 000 person-years). Higher standardized incidence ratios and excess absolute risks were associated with young age at primary diagnosis, primary sarcoma diagnosis, and a family history of cancer. In a multivariable model, increased risk of secondary sarcoma was associated with radiation therapy (RR = 3.1, 95% CI = 1.5 to 6.2), with a primary diagnosis of sarcoma (RR = 10.1, 95% CI = 4.7 to 21.8), with a history of other secondary neoplasms (RR = 2.2, 95% CI = 1.1 to 4.5), and with treatment with higher doses of anthracyclines (RR = 2.3, 95% CI = 1.2 to 4.3) or alkylating agents (RR = 2.2, 95% CI = 1.1 to 4.6).
Conclusion
Childhood cancer survivors appear to be at increased risk for secondary sarcomas compared with general population rates.
Treatment of childhood cancers has become increasingly successful, with a current overall cure rate of more than 70% (1,2). Second malignant neoplasms, however, are observed in long-term survivors of childhood cancer, with a 15-year cumulative incidence of 3%–5% (3–6). Secondary cancers are the second leading cause of death, after recurrence, among 5-year survivors of childhood cancer (7). To date, no large studies have analyzed risk factors other than radiation for secondary sarcomas after childhood malignancy. Radiation therapy for childhood tumors has been associated with the development of secondary sarcomas (5,6,8), but the association between secondary sarcomas and other factors—e.g., chemotherapy exposure, age, or family history of cancer—has not been well studied.
The Childhood Cancer Survivor Study (CCSS) is, to our knowledge, the largest, most comprehensive cohort study of childhood cancer survivors. This cohort allows investigation of primary treatment data with current demographic and health information among more than 14 000 survivors of childhood cancer. A better understanding of the incidence of secondary cancers in these survivors and the risk factors associated with the development of secondary cancers should provide clinicians and researchers with valuable information that could be used to develop effective strategies to detect tumors earlier and to reduce the associated morbidities and mortality in cancer survivors. We investigated the incidence of secondary sarcomas among childhood cancer survivors participating in the CCSS and the association between various factors and the risk of developing secondary sarcomas.
Patients and Methods
Description of Cohort
Detailed characteristics of the CCSS cohort of 5-year childhood cancer survivors have been published previously (9). Briefly, the CCSS is an ongoing study of 14 372 childhood cancer survivors at 26 participating clinical centers in the United States and Canada. Each participating institution identified all patients in this cohort who fulfilled the following eligibility criteria: 1) diagnosis and initial treatment of leukemia, central nervous system malignancy (excluding meningioma and craniopharyngioma), Hodgkin lymphoma, non-Hodgkin lymphoma, neuroblastoma, soft tissue sarcoma, or kidney or bone cancer; 2) diagnosis date between January 1, 1970, and December 31, 1986; 3) age at diagnosis younger than 21 years; and 4) survival of at least 5 years from the date of diagnosis.
The CCSS protocol and contact documents were reviewed and approved by the Human Subjects Committee at each participating institution. Written informed consent was obtained from each participant or proxy. Data used in this analysis were collected from eligible subjects by use of a questionnaire at baseline (1992–2004) and, if subjects were still alive and contactable, two follow-up questionnaires (the first in the period of 2000–2003 and the second in the period of 2001–2004). Next of kin, typically a parent or spouse, was contacted for those eligible subjects who were known to have died after achieving 5-year survivorship. Cohort exit was defined as the date of the last questionnaire or date of participant death, whichever occurred earlier. The questionnaires addressed social and demographic information, medical conditions diagnosed by a physician, health behaviors, cancer recurrence, development of secondary neoplasms, and family history of cancer. Survey questionnaires used in data collection are available for review at the Web site http://www.stjude.org/ccss; or in Supplementary Files 1–4 (available online).
For all CCSS participants who signed a medical record release, a detailed summary of exposure to cancer treatment, including chemotherapy, radiation therapy, and surgery, was obtained. Information about exposure to 49 specific chemotherapy agents and cumulative dosing on 22 agents was abstracted. Alkylating agent scores were calculated as previously described (10). In brief, for each alkylating agent, the total dose received in relation to body surface area was calculated for each study subject. A distribution of the doses received by all the subjects was determined for each alkylating agent and then divided into thirds. Each subject was assigned a score of 0, 1, 2, or 3 for each drug, depending on whether the subject received no alkylating agent or fell into the lower, middle, or upper third of each distribution, respectively. Doses of daunorubicin and/or idarubicin per meter squared were multiplied by 3 to approximate an equivalent dose of doxorubicin and then summed with doxorubicin doses to determine cumulative anthracycline exposure, and doses of etoposide and teniposide were summed to determine cumulative epipodophyllotoxin exposure. The cumulative dose of carboplatin was divided by 4 and added to the cisplatin dose to assess exposure to platinum compounds (11). Radiation therapy data were coordinated through Department of Radiation Physics, The University of Texas M. D. Anderson Cancer Center, Houston (9).
Identification of Patients With Secondary Sarcoma and Confirmation of Sarcoma
Patients with secondary sarcoma(s) were initially identified through their self-reported history of a second cancer and then further identified through a secondary review of pathology records by the CCSS Pathology Review Center at Columbus Children’s Hospital. Data collected included type of secondary sarcoma (including rhabdomyosarcoma, non-rhabdomyosarcoma soft tissue sarcoma, Ewing/primitive neuroectodermal tumor, osteosarcoma, and malignant peripheral nerve sheath tumor) and location(s) of tumors. The sarcoma had to have been diagnosed at least 5 years after the primary cancer diagnosis. All patients with sarcomas identified before February 1, 2005, were included.
To ensure the validity of the analysis, all secondary sarcoma pathology reports were reviewed independently of the CCSS Pathology Review Center by one of this study’s physicians (T. Henderson). We used this procedure to confirm that the secondary primary tumor was histologically distinct from the originally diagnosed childhood cancer and to identify the histology and grade of each secondary sarcoma.
Statistical Methods
Calculation of Standardized Incidence Ratios and Excess Absolute Risks.
Population studies were undertaken by use of the Surveillance, Epidemiology, and End Results (SEER) Program (12). Standardized incidence ratios (SIRs) and excess absolute risks (EARs) were calculated by use of age- and sex-specific sarcoma incidence rates. SEER data were used to determine the number of sarcomas expected in a general population cohort with the same age and sex distribution as the CCSS cohort during its years of observation. The standardized incidence ratios were then calculated as the ratios of the observed numbers of cases in the various subgroups of the cohort to the expected numbers. Excess absolute risks were calculated as the difference between the number of observed and expected events divided by the number of person-years and expressed per 100 000 person-years. Of note, men and women were not analyzed separately, although the effect of sex was examined during the modeling process. Poisson regression models were used to calculate standardized incidence ratios, their 95% confidence intervals (CIs), and P values. All statistical tests were two-sided.
Calculation of Cumulative Incidence Rates.
Cumulative incidence estimates for sarcoma occurring after the 5-year anniversary of the primary cancer diagnosis were calculated as previously described by Kalbfleisch and Prentice (13). Sarcoma occurrence was the event of interest, censoring occurred at completion of the most recent CCSS questionnaire, and death was considered to be a competing risk event.
Risk Factor Analysis.
Potential risk factors examined for an association with secondary sarcomas included “current” age (i.e., age at completion of most recent questionnaire, a continuous variable), sex (male or female), race (white, black, Hispanic, or other), vital status (alive or dead), age at primary diagnosis (continuous), interval from diagnosis of primary cancer to development of second sarcoma (continuous), treatment (e.g., bone marrow transplantation [yes or no], radiation therapy [yes or no], and chemotherapy, including platinum drugs [drug scores 0–3], alkylators [drug scores 0–3], epipodophyllotoxins [drug scores 0–3], and anthracyclines [cumulative dose categories 0, 1–100, 101–300, or>300 mg/m2]), treatmentera (1970–1974, 1975–1979, or 1980–1986), history of other second malignant neoplasms (yes or no), and family history of cancer (yes or no).
Univariate analysis was performed to evaluate the impact of potential risk factors on the occurrence of secondary sarcomas. Statistically significant associations between the development of secondary sarcomas and various participant characteristics and cancer treatments were examined by use of the Cox regression model [the assumptions of which were tested by use of the methods of Lin et al. (14) and found to hold]. Participants with a secondary sarcoma were compared with the rest of the patient cohort who did not develop a secondary sarcoma. The results of these univariate regression models, coupled with an a priori decision to include variables that were not statistically signifi cant by univariate analysis but were clinically relevant and possibly important when controlling for other exposures, led to the inclusion of 12 covariates (i.e., age at primary diagnosis, sex, primary diagnosis, radiation exposure, chemotherapy exposure, platinum drug dose categories, epipodophyllotoxin dose categories, alkylator drug scores, anthracycline dose categories, history of other second malignant neoplasms, family history of cancer in a primary relative, and treatment era) in a multivariable Cox regression model to assess their simultaneous impact on the time to development of secondary sarcomas. Standard asymptotic inference methods for Cox regression that were based on the partial likelihood were used to construct 95% confidence intervals and to carry out two-sided tests of statistical significance (13).
Results
Description of Patients With Secondary Sarcoma
At the time of this analysis, which began in February 2005, 751 secondary cancers had been reported among the 14 372 CCSS participants. Of these 751 secondary cancers, 108 were confirmed by medical record and pathologic reviews as being independent secondary sarcomas. These 108 sarcomas developed in 104 CCSS participants, four of whom reported both secondary and tertiary sarcomas. The median age at the time of diagnosis of secondary sarcoma was 20 years, and the median time from primary cancer diagnosis was 11 years. As shown in Table 1, cohort members who had a secondary sarcoma history were similar to those who did not have such a history in terms of age at primary diagnosis, follow-up time, race, sex, and treatment era. However, patients with secondary sarcomas, compared with those without secondary sarcomas, were more likely to have received primary radiation therapy; to have received higher doses of anthracyclines or alkylators; to have a primary diagnosis of soft tissue sarcoma, bone tumor, or Hodgkin lymphoma; to have a family history of cancer; or to have a history of other second cancers.
Table 1.
Characteristics of members of the Childhood Cancer Survivor Study cohort *
| Characteristic | Patients with secondary sarcoma (n = 104) | Cohort members without secondary sarcomas (n = 14 258) |
|---|---|---|
| Median age at last follow-up, y (range) | 27 (12–52) | 28 (5–54) |
| Median duration of follow-up, y (range) | 18 (5–32) | 20 (5–34) |
| Sex, No. (%) | ||
| Male | 61 (59) | 7656 (54) |
| Female | 43 (41) | 6602 (46) |
| Race, No. (%) | ||
| White | 92 (88) | 11 855 (83) |
| Black | 4 (4) | 664 (5) |
| Hispanic | 3 (3) | 310 (2) |
| Other | 4 (4) | 1380 (10) |
| Age at primary cancer, No. (%) | ||
| <1 y | 3 (3) | 1001 (7) |
| 1–3 y | 27 (26) | 3612 (25) |
| 4–7 y | 18 (17) | 3219 (23) |
| 8–10 y | 16 (15) | 1558 (11) |
| 11–14 y | 20 (19) | 2397 (17) |
| 15–20 y | 20 (19) | 2471 (17) |
| Current age, No. (%) | ||
| 0–19 y | 28 (27) | 1900 (13) |
| 20–29 y | 32 (31) | 5724 (40) |
| 30–39 y | 28 (27) | 4858 (34) |
| ≥40 y | 11 (11) | 1610 (11) |
| Primary diagnosis, No. (%) | ||
| Leukemia | 10 (10) | 4823 (34) |
| Brain/CNS tumor | 10 (10) | 1866 (13) |
| Hodgkin disease | 27 (26) | 1899 (13) |
| Non-Hodgkin lymphoma | 4 (4) | 1078 (8) |
| Kidney tumor | 10 (10) | 1247 (9) |
| Neuroblastoma | 2 (2) | 952 (7) |
| Soft tissue sarcoma | 27 (26) | 1218 (9) |
| Bone tumor | 14 (13) | 1175 (8) |
| Radiation therapy for primary malignancy, No. (%) | 81 (79) | 8463 (59) |
| Chemotherapy for primary malignancy, No. (%) | 82 (29) | 10 055 (71) |
| Stem cell transplant for primary malignancy, No. (%) | 2 (2) | 190 (1) |
| History of other SMN, No. (%) | 11 (11) | 561 (4) |
| Family history of cancer, No. (%) | 22 (22) | 1865 (14) |
| Treatment era, No. (%) | ||
| 1970–1974 | 27 (26) | 2517 (17) |
| 1975–1979 | 32 (31) | 4038 (28) |
| 1980–1986 | 45 (43) | 7703 (54) |
| Vital status, No. alive (%) | 45 (43) | 12 557 (88) |
CNS = central nervous system; SMN = second malignant neoplasm.
The characteristics of the patients with secondary sarcomas are described in Table 2. Although 79% of the patients received radiotherapy as a component of treatment for primary cancer, we could confirm that only 56% received that radiotherapy to the primary anatomic site of a secondary sarcoma. Secondary tumors were small (i.e., <5 cm) in 32 (56%) of the 57 patients for whom size of the sarcoma was known. Pathologic grade was determined in 45 (42%) of 108 secondary sarcomas, and 23 (51%) of these 45 tumors were high-grade sarcomas. Secondary sarcoma was the cause of death for 39 (66%) of the 59 deceased patients.
Table 2.
Clinical characteristics of patients with secondary sarcomas and pathologic characteristics of the 108 tumors
| Characteristic | Value |
|---|---|
| Median age at primary diagnosis of childhood cancer, y (range) | 8 (1–20) |
| Median time from primary diagnosis to secondary sarcoma, y (range) | 11 (5–29) |
| Median age at secondary sarcoma, y (range) | 20 (8–49) |
| Age at diagnosis of secondary sarcoma, No. (%) | |
| 5–14 y | 24 (23) |
| 15–24 y | 48 (46) |
| 25–34 y | 25 (24) |
| ≥35 y | 7 (7) |
| Pathologic subtype of secondary sarcoma, No. (%) | |
| Non-rhabdomyosarcoma soft tissue sarcoma | 50 (46) |
| Osteosarcoma | 31 (29) |
| Malignant peripheral nerve sheath tumor | 19 (18) |
| Ewing/primitive neuroectodermal tumor | 5 (5) |
| Rhabdomyosarcoma | 3 (3) |
| Size of secondary sarcoma, No. (%) | |
| ≤5 cm | 32 (30) |
| >5 cm | 25 (23) |
| Unknown | 51 (47) |
| Site of secondary sarcoma, No. (%) | |
| Head and neck | 21 (19) |
| Trunk | 41 (38) |
| Extremities | 31 (29) |
| Pelvis | 8 (7) |
| Unknown | 7 (6) |
| Radiation exposure for treatment of primary cancer, No. (%) | |
| Second sarcoma in radiation field | 60 (56) |
| Second sarcoma distant from radiation field | 13 (12) |
| No radiation for primary cancer | 11 (10) |
| Unknown primary radiation data | 12 (11) |
| Unknown site of second sarcoma | 10 (9) |
| Cause of death of secondary sarcoma participants, No. (%)* | |
| Original cancer | 10 (17) |
| Secondary sarcoma | 39 (66) |
| Cardiac toxicity | 3 (5) |
| Unknown | 7 (12) |
Fifty-nine of the 104 patients with secondary sarcoma were deceased.
Of the 108 secondary sarcomas, pathologic subtype was known in 100—50 were non-rhabdomyosarcoma soft tissue sarcomas, 19 were malignant peripheral nerve sheath tumors, and 31 were osteosarcomas. Non-rhabdomyosarcoma soft tissue sarcoma subtypes included malignant fibrous histiocytoma (12 tumors), leiomyosarcoma (seven tumors), fibrosarcoma (six tumors), spindle cell tumor (four tumors), chondrosarcoma (three tumors), synovial cell tumors (two tumors), rhabdoid tumors (two tumors), angiosarcomas (two tumors), epitheloid sarcoma (one tumor), and malignant sarcomas without other subtyping (11 tumors). There were 27 second sarcomas among Hodgkin lymphoma survivors, including 17 non-rhabdomyosarcoma soft tissue sarcomas, five malignant peripheral nerve sheath tumors, three osteosarcomas, and two rhabdomyosarcomas. Only two of the patients with second sarcoma self-reported neurofibromatosis type 1, of whom one had a primary diagnosis of brain tumor, followed by two distinct malignant peripheral nerve sheath tumors, and the other had a primary diagnosis of Wilms tumor, followed by malignant peripheral nerve sheath tumor.
When we examined family history of cancer in this cohort, 22 (22.0%) of the 104 patients with secondary sarcoma reported a history of cancer among first-degree relatives. Eight of these 22 participants reported first-degree relatives with tumors suggestive of a familial cancer predisposition syndrome. Five patients had siblings with cancers associated with Li–Fraumeni syndrome (15–18) (three with childhood sarcoma, one with a central nervous system tumor, and one with premenopausal breast cancer), and three patients had parents with medical histories indicative of the syndrome (two had mothers with early breast cancer and one had a father with young adult onset sarcoma). Eleven of the 104 patients with secondary sarcoma reported a family history of more than two independent cancers. Other cancers that were reported included one family member with breast, four with thyroid, one with kidney, one with colon and rectum, one with brain, and one with ovarian cancer, as well as one family member with acute myelogenous leukemia and one with melanoma.
Standardized Incidence Ratio and Excess Absolute Risk Analysis
To determine the risk of secondary sarcoma in the CCSS cohort in relation to the general population, studies were undertaken by using the SEER database. As shown in Table 3, the risk of sarcoma was more than ninefold higher among childhood cancer survivors than among the general population (SIR = 9.02, 95% CI = 7.44 to 10.93). Risk among survivors who received radiation therapy (SIR = 11.35, 95% CI = 9.12 to 14.12) was higher than that among survivors who did not receive radiation therapy (SIR = 2.68, 95% CI = 2.04 to 6.64). Risk for the development of a secondary sarcoma among survivors who did not receive radiation therapy was also higher than that among the general population. Relative risks (RRs) were highest in survivors of primary cancers at young age (i.e., younger than 4 years), and the relative rates declined with increasing time of follow-up and increasing age at diagnosis. Highest risks, albeit with wide and overlapping confidence intervals, were observed among survivors of soft tissue sarcomas (SIR = 24.7, 95% CI = 16.9 to 36.1), bone cancers (SIR = 10.6, 95% CI = 6.3 to 18.0), Hodgkin lymphoma (SIR = 11.7, 95% CI = 8.0 to 17.1), and renal tumors (SIR = 14.6, 95% CI = 7.8 to 27.1). Individually, each primary childhood cancer diagnosis was associated with increased risk compared with age-adjusted population rates.
Table 3.
SIRs and EARs for development of secondary sarcoma in the Childhood Cancer Survivor Study*
| Variable | No. O | No. E | SIR (95% CI) | EAR (95% CI)† |
|---|---|---|---|---|
| All patients with secondary sarcomas | 104 | 11.54 | 9.02 (7.44 to 10.93) | 32.54 (26.13 to 40.31) |
| Sex | ||||
| Male | 61 | 8.03 | 7.60 (5.91 to 9.77) | 35.21 (26.19 to 46.80) |
| Female | 43 | 3.51 | 12.26 (9.09 to 16.54) | 29.54 (21.23 to 40.75) |
| Age at primary diagnosis (y)‡ | ||||
| 0 | 3 | 0.44 | 6.75 (2.18 to 20.94) | 14.56 (2.98 to 50.47) |
| 1–3 | 27 | 1.75 | 15.39 (10.55 to 22.46) | 38.01 (25.23 to 56.66) |
| 4–7 | 18 | 2.03 | 8.85 (5.58 to 14.06) | 24.00 (13.98 to 39.90) |
| 8–10 | 16 | 1.33 | 12.05 (7.37 to 19.71) | 44.69 (25.76 to 75.63) |
| 11–14 | 20 | 2.51 | 7.98 (5.14 to 12.39) | 35.13 (20.84 to 57.31) |
| 15–20 | 20 | 3.47 | 5.76 (3.72 to 8.93) | 32.39 (18.48 to 53.94) |
| Time since primary diagnosis to secondary sarcoma (y)‡ | ||||
| 5–19 | 69 | 6.04 | 11.42 (9.02 to 14.46) | 33.15 (25.51 to 42.83) |
| 20–29 | 29 | 4.74 | 6.12 (4.25 to 8.81) | 29.98 (19.03 to 45.74) |
| 30–39 | 6 | 0.76 | 7.94 (3.57 to 17.67) | 39.43 (14.59 to 94.71) |
| History of radiation therapy | ||||
| Yes | 81 | 7.14 | 11.35 (9.12 to 14.12) | 42.78 (33.58 to 54.24) |
| No | 11 | 2.99 | 2.68 (2.04 to 6.64) | 10.33 (4.00 to 21.76) |
| Unknown | 12 | 1.41 | 8.52 (4.83 to 15.04) | 31.16 (15.86 to 58.14) |
| Primary cancer diagnosis | ||||
| Leukemia | 10 | 3.12 | 3.21 (1.73 to 5.96) | 7.38 (2.42 to 16.58) |
| Non-Hodgkin lymphoma | 4 | 1.14 | 3.52 (1.32 to 9.38) | 12.77 (1.62 to 42.54) |
| Neuroblastoma | 2 | 0.47 | 4.25 (1.06 to 17.00) | 8.69 (0.16 to 42.78) |
| CNS | 10 | 1.41 | 7.11 (3.82 to 13.23) | 24. 16 (11.16 to 48.35) |
| Hodgkin lymphoma | 27 | 2.30 | 11.72 (8.03 to 17.11) | 60.63 (39.75 to 91.13) |
| Bone | 14 | 1.32 | 10.62 (6.28 to 17.98) | 51.81 (28.41 to 91.42) |
| Kidney | 10 | 0.69 | 14.55 (7.82 to 27.06) | 37.94 (19.10 to 72.99) |
| Soft tissue sarcoma | 27 | 1.09 | 24.67 (16.86 to 36.10) | 101.50 (68.00 to 150.53) |
| First-degree relative with cancer | ||||
| Yes | 22 | 1.88 | 11.72 (7.71 to 17.83) | 50.03 (31.28 to 78.54) |
| No | 80 | 8.76 | 9.14 (7.33 to 11.38) | 31.88 (24.82 to 40.67) |
SIRs = standardized incidence ratios; EARs = excess absolute risks; O = observed; E = expected; CI = confidence interval; CNS = central nervous system. z scores were used. All statistical tests were two-sided.
EARs are per 100 000 person-years.
P value from test of trend was <.001.
Excess absolute risk for secondary sarcoma was 32.54 (95% CI = 26.13 to 40.31) per 100 000 person-years of follow-up (T able 3). Excess absolute risk was increased for both males and females and was highest among those with the longest period of follow-up. Excess absolute risk was highest in survivors diagnosed with their primary cancer at a young age (for ages 1–3 years, EAR = 38.01, 95% CI = 25.23 to 56.66) and in those survivors diagnosed between ages 8 and 10 years (EAR = 44.69, 95% CI = 25.76 to 75.63). Exposure to radiation therapy was associated with higher absolute risk (EAR = 42.78, 95% CI = 33.58 to 54.24) than nonexposure (EAR = 10.33, 95% CI = 4.00 to 21.76), although unexposed patients still had statistically significantly elevated risk. Family history of a first-degree relative with cancer was associated with an elevated absolute risk (EAR = 50.03, 95% CI = 31.28 to 78.54). Each primary childhood cancer diagnosis was associated with elevated excess absolute risk. The highest excess absolute risks were associated with primary diagnoses of soft tissue sarcoma (EAR = 101.50, 95% CI = 68.00 to 150.53), Hodgkin lymphoma (EAR = 60.63, 95% CI = 39.75 to 91.13), bone cancer (EAR = 51.81, 95% CI = 28.41 to 91.42), kidney tumors (EAR = 39.94, 95% CI = 19.10 to 72.99), and central nervous system tumors (EAR = 24.16, 95% CI = 11.16 to 48.35).
Cumulative Incidence Rates
We next analyzed the cumulative incidence rates for developing secondary sarcomas in the CCSS cohort. We found a cumulative incidence rate for the development of secondary sarcoma at 30 years after initial cancer diagnosis of 1.08% (95% CI = 0.78% to 1.37%) and at 30 years among patients in the cohort who did not receive radiation therapy of 0.5% (Fig. 1, A). We then determined the cumulative incidence of secondary sarcomas by primary diagnoses (Fig. 1, B). The cumulative incidence rates at 30 years were higher among survivors of sarcomas (2.18%, 95% CI = 1.32% to 3.03%) and among survivors of Hodgkin lymphoma (1.91%, 95% CI = 1.01% to 2.80%) than among survivors of all other cancers (0.62%, 95% CI = 0.31% to 0.92%).
Fig. 1.
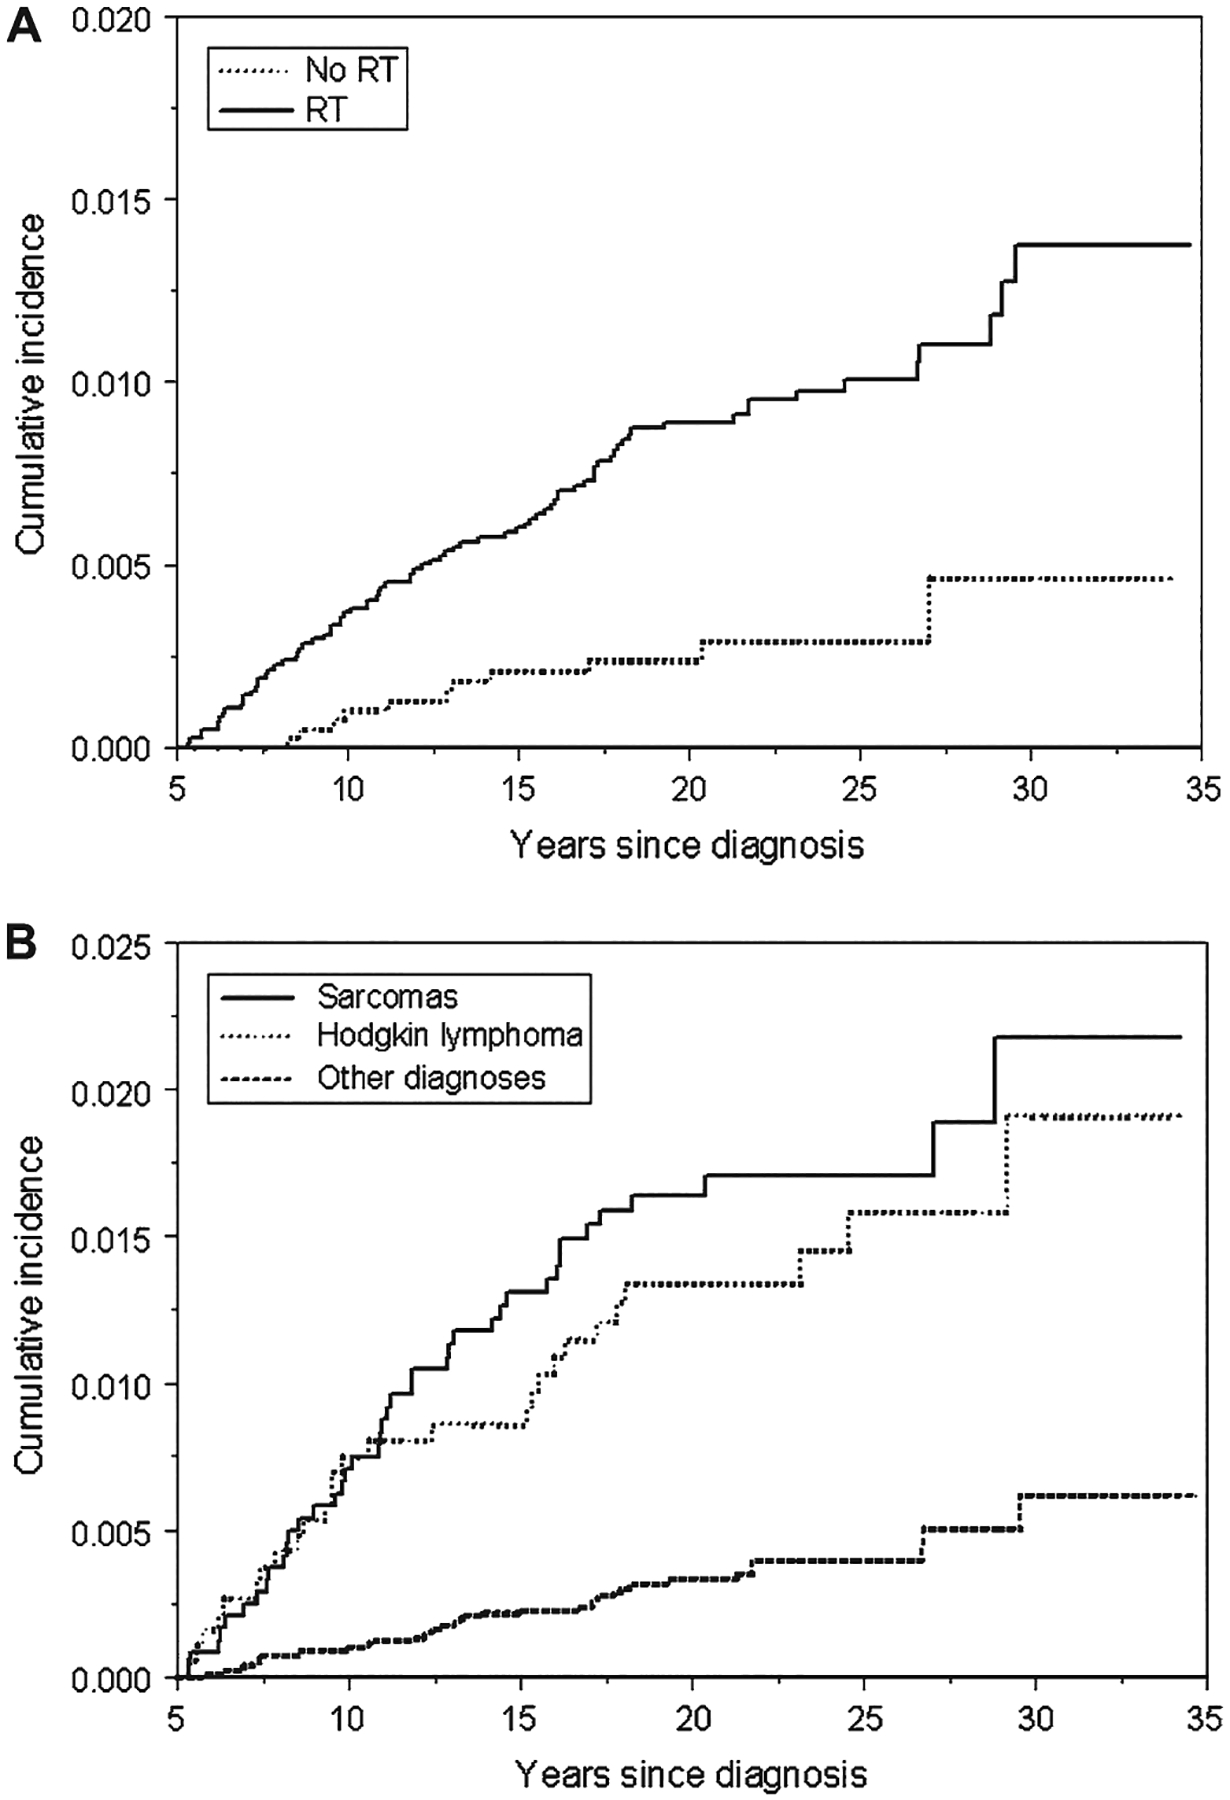
Cumulative incidence curves of all secondary sarcomas in the Childhood Cancer Survivor Study. A) Stratified by exposure to radiation therapy (RT). No history of radiation exposure (No RT) curve: for 10 years, number of survivors at risk = 3840 and cumulative incidence = 0.10% (95% confidence interval [CI] = 0.00% to 0.20%); for 20 years, number of survivors at risk = 2039 and cumulative incidence = 0.24% (95% CI = 0.08% to 0.39%); for 30 years, number of survivors at risk = 238 and cumulative incidence = 0.46% (95% CI = 0.07% to 0.85%). History of radiation exposure (RT) curve: for 10 years, number of survivors at risk = 7775 and cumulative incidence = 0.37% (95% CI = 0.24% to 0.50%); for 20 years, number of survivors at risk = 5072 and cumulative incidence = 0.89% (95% CI = 0.68% to 1.10%); for 30 years, number of survivors at risk = 730 and cumulative incidence = 1.37% (95% CI = 0.97% to 1.78%). B) Stratified by primary diagnoses. Sarcoma curve: for 10 years, number of survivors at risk = 2231 and cumulative incidence = 0.71% (95% CI = 0.37% to 1.04%); for 20 years, number of survivors at risk = 1442 and cumulative incidence = 1.64% (95% CI = 1.12% to 2.16%); for 30 years, number of survivors at risk = 202 and cumulative incidence = 2.18% (95% CI = 1.32% to 3.03%). Hodgkin lymphoma curve: for 10 years, number of survivors at risk = 1758 and cumulative incidence = 0.75% (95% CI = 0.36% to 1.14%); for 20 years, number of survivors at risk = 1157 and cumulative incidence = 1.34% (95% CI = 0.81% to 1.87%); for 30 years, number of survivors at risk = 211 and cumulative incidence = 1.91% (95% CI = 1.01% to 2.80%). Other diagnoses curve: for 10 years, number of survivors at risk = 9283 and cumulative incidence = 0.10% (95% CI = 0.04% to 0.16%); for 20 years, number of survivors at risk = 5401 and cumulative incidence = 0.33% (95% CI = 0.21% to 0.45%); for 30 years, number of survivors at risk = 658 and cumulative incidence = 0.62% (95% CI = 0.31% to 0.92%).
Cox Model Risk Factor Analysis
To identify treatment-related and other risk factors associated with the development of secondary sarcomas, we performed a univariate analysis (Table 4), followed by a multivariable Cox regression analysis (Table 5). In the univariate analysis, statistically significant associations were observed between the risk of secondary sarcomas and the primary diagnosis of any childhood cancer; family history of cancer in a first-degree relative; history of other secondary cancers; history of radiation therapy; or history of an exposure to chemotherapy, alkylator therapy, or anthracycline therapy (see Table 4).
Table 4.
Risk factors for the development of secondary sarcomas: univariate analysis *
| Variable | RR (95% CI) | P value |
|---|---|---|
| Sex | 0.79 (0.5 to 1.2) | .23 |
| Race | ||
| White | 1.0 (referent) | – |
| Black | 0.9 (0.3 to 2.3) | .76 |
| Hispanic | 0.9 (0.4 to 2.3) | .86 |
| Other | 0.3 (0.1 to 1.1) | .08 |
| Age at primary diagnosis, y | ||
| 0–3 | 1.0 (referent) | – |
| 4–10 | 0.7 (0.4 to 1.2) | .20 |
| 11–14 | 0.3 (0.1 to 1.0) | .06 |
| 15–20 | 0.9 (0.4 to 2.0) | .75 |
| Primary cancer diagnosis | ||
| Heme malignancy | 1.0 (referent) | – |
| Neuroblastoma | 0.8 (0.2 to 3.7) | .80 |
| CNS | 2.3 (1.0 to 5.3) | .04 |
| Hodgkin lymphoma | 5.7 (3.0 to 10.9) | <.001 |
| Bone | 5.0 (2.4 to 10.4) | <.001 |
| Kidney | 3.2 (1.4 to 7.2) | <.001 |
| Soft tissue sarcoma | 8.8 (4.6 to 16.8) | <.001 |
| Radiation | 3.4 (1.8 to 6.4) | <.001 |
| Chemotherapy | 0.5 (0.2 to 0.9) | .02 |
| Anthracycline cumulative dose, mg/m2 | ||
| 0 | 1.0 (referent) | – |
| 1–100 | 1.0 (0.2 to 4.0) | .96 |
| 101–300 | 2.3 (1.4 to 4.0) | <.001 |
| >300 | 2.7 (1.7 to 4.5) | <.001 |
| Alkylator score† | ||
| 0 | 1.0 (referent) | – |
| 1 | 1.4 (0.8 to 2.8) | .23 |
| 2 | 3.5 (2.0 to 6.2) | <.001 |
| 3 | 3.9 (2.2 to 7.1) | <.001 |
| Platinum drug score† | ||
| 0 | 1.0 (referent) | – |
| 1 | 2.6 (0.9 to 7.1) | .06 |
| 2 | 1.5 (0.4 to 6.0) | .59 |
| 3 | 1.6 (0.2 to 11.7) | .62 |
| Epipophyllotoxin drug score† | ||
| 0 | 1.0 (referent) | – |
| 1 | 1.6 (0.5 to 4.9) | .45 |
| 2 | 1.6 (0.5 to 4.9) | .44 |
| 3 | 0.5 (0.1 to 3.3) | .45 |
| Stem cell transplant | 0.5 (0.1 to 2.0) | .31 |
| History of other SMN | 2.7 (1.4 to 5.1) | <.001 |
| Family history of cancer | 1.6 (1.1 to 2.3) | <.001 |
| Treatment era | ||
| 1970–1974 | 1.0 (referent) | – |
| 1975–1979 | 0.9 (0.5 to 1.5) | .63 |
| 1980–1986 | 0.8 (0.5 to 1.3) | .34 |
RR = relative risk; CI = confidence interval; CNS = central nervous system; SMN = second malignant neoplasm. Boldface values are statistically significant. Chi-square tests were used. All statistical tests were two-sided.
For platinum drugs, alkylator drugs, and epiphyllotoxins, each subject was assigned a score of 0, 1, 2, or 3 for each drug, depending on whether the subject received no agent or fell into the lower, middle, or upper third of each distribution, respectively.
Table 5.
Cox multivariable rate ratios for the development of secondary sarcomas
| Variable | RR (95% CI)* | P value |
|---|---|---|
| Sex | 0.70 (0.4 to 1.0) | .07 |
| Primary diagnosis | ||
| Heme malignancy | 1.0 (referent) | – |
| Neuroblastoma | † | † |
| Hodgkin disease | 5.4 (2.7 to 12.7) | <.001 |
| CNS | 5.5 (2.0 to 14.8) | <.001 |
| Bone | 5.6 (2.3 to 13.9) | <.001 |
| Kidney | 6.3 (2.3 to 16.7) | <.001 |
| Soft tissue sarcoma | 10.1 (4.7 to 21.8) | <.001 |
| Radiation | 3.1 (1.5 to 6.2) | <.01 |
| Anthracycline cumulative dose, mg/m2 | ||
| 0 | 1.0 (referent) | – |
| 1–100 | 0.8 (0.1 to 5.6) | .82 |
| 101–300 | 2.1 (1.1 to 3.9) | .02 |
| >300 | 2.3 (1.2 to 4.3) | .01 |
| Alkylator score‡ | . | |
| 0 | 1.0 (referent) | – |
| 1 | 1.8 (0.9 to 3.8) | 12 |
| 2 | 2.1 (1.1 to 4.2) | .04 |
| 3 | 2.2 (1.1 to 4.6) | .03 |
| History of other SMN | 2.2 (1.1 to 4.5) | .03 |
| Family history of cancer | 1.4 (0.9 to 2.1) | .10 |
RR = relative risk; CI = confidence interval; CNS = central nervous system; SMN = second malignant neoplasm. Boldface values are statistically significant. Chi-square tests were used. All statistical tests were two-sided.
Too few secondary sarcomas were found in neuroblastoma patients to generate a reliable estimate.
For alkylator drugs, each subject was assigned a score of 0, 1, 2, or 3, depending on whether the subject received no alkylating agent or fell into the lower, middle, or upper third of each distribution, respectively.
Using our a priori list of 12 covariates (i.e., age at primary diagnosis, sex, primary diagnosis, radiation exposure, chemotherapy exposure, platinum drug dose categories, epipodophyllotoxin dose categories, alkylator drug scores, anthracycline dose categories, history of other second malignant neoplasms, family history of cancer in a first-degree relative, and treatment era), we performed a multivariable Cox regression analysis to assess the relative risks of secondary sarcomas. Exposure to radiation was associated with an increased risk of developing secondary sarcoma (RR = 3.1, 95% CI = 1.5 to 6.2), as expected. However, higher total dose exposures to anthracyclines (RR = 2.3, 95% CI = 1.2 to 4.3) or to alkylating agents (RR = 2.2, 95% CI = 1.1 to 4.6) continued to be associated with an increased risk of secondary sarcomas when radiation exposure was included in the regression model (Table 5). Among patients with radiation exposure, a prior history of soft tissue sarcoma was associated with a high risk of developing secondary sarcoma (RR = 10.1, 95% CI = 4.7 to 21.8). Other primary diagnoses were also associated with increased risks (including renal tumors, RR = 6.3, 95% CI = 2.4 to 16.7; bone tumors, RR = 5.6, 95% CI = 2.3 to 13.9; Hodgkin lymphoma, RR = 5.4, 95% CI = 2.3 to 12.7; and central nervous system tumors, RR = 5.5, 95% CI = 2.0 to 14.8). A history of other secondary malignancies was associated with an increased risk of developing secondary sarcoma (RR = 2.2, 95% CI = 1.1 to 4.5). Lastly, the association between a history of cancer in a first-degree relative and the development of a secondary sarcoma approached borderline statistical significance (RR = 1.4, 95% CI = 0.9 to 2.1; P = .10).
Discussion
Our analysis of secondary sarcomas in childhood malignancy survivors is, to our knowledge, the largest study regarding this topic reported in the literature. Childhood cancer survivors overall had a ninefold increased risk of developing a secondary sarcoma compared with rates of sarcoma in the general population of a similar age. When we compared those CCSS participants who developed a secondary sarcoma with those who did not, the development of secondary sarcoma was associated with previous radiation exposure, higher dose exposures of anthracyclines or alkylators, or a history of other secondary malignancies. The highest risks were observed among survivors of pediatric soft tissue and bone sarcomas, renal tumors, and Hodgkin lymphoma. History of cancer in a first-degree relative approached borderline statistical significance (P = .10) as a risk for developing secondary sarcomas. Secondary sarcomas occur at a young age and were the cause of death in more than one-third of the patients with secondary sarcomas.
Radiation therapy has been shown to induce bone and soft tissue sarcomas (19–21). Previous studies (10, 22–29) have focused mainly on secondary bone sarcomas and have investigated radiation-related and other treatment-related risk factors. Results of these studies indicate that exposure to radiation and/or chemotherapy is associated with risk. The Late Effects Study Group, a multi-institution international consortium, analyzed data from 64 patients with secondary bone sarcoma and found an association between bone sarcoma and radiation dose (10). An expanded group of 91 patients with secondary bone sarcomas in this cohort was analyzed in another study (22), and results indicated that exposure to anthracycline chemotherapy was associated with increased risk. Similarly, the National Registry of Childhood Tumours in Britain used a case–control design to analyze 55 patients with bone cancer tumors among 3-year survivors of childhood cancer diagnosed between 1940 and 1983 (30). This study found that an increased risk of bone cancers was associated with increased dose of radiation or increased alkylator dose exposure. In a smaller British and French survivor cohort (25), among 32 patients with secondary osteosarcoma, risk of secondary osteosarcoma among survivors of childhood solid tumors was found to be linearly associated with the local dose of radiation and the concentration of alkylating agents received. In contrast, a nested case–control study (26) in Nordic countries of 31 childhood cancer survivors with secondary sarcomas (including both bone and connective tissue tumors) found that exposure to radiation was the only treatment associated with risk.
Our study is unique in that we could compare patients who developed secondary sarcomas with those who did not, that it includes the largest group of patients with secondary sarcomas described, and that it includes secondary sarcomas of all histologic subtypes. Our findings are consistent with the known association between secondary sarcoma occurrence and radiation exposure; however, our findings also indicate that the risk of secondary sarcomas is increased in patients who did not receive radiation therapy (SIR = 2.68, 95% CI = 2.04 to 6.64; EAR = 10.33, 95% CI = 4.00 to 21.76). Risks in our cohort were associated with a primary diagnosis of sarcoma, even after controlling for treatment with radiation and chemotherapy, indicating that survivors of primary sarcoma in childhood are at highest risk for a second cancer. This observation and the findings that a prior history of secondary malignancy was associated with increased risk and that members of our cohort had an increased frequency of family history of cancer indicate that childhood cancer survivors who develop secondary sarcoma may have an increased familial risk for their cancers. Genetic analysis of DNA samples from these patients should clarify this possibility.
We demonstrated that an increased risk of secondary sarcomas was associated with both radiation therapy and increasing doses of alkylators or anthracyclines. This finding may be a consequence of confounding between higher doses of chemotherapy and higher doses of radiation because childhood cancers that require higher doses of anthracyclines and/or alkylators also often require high doses of radiation. Unfortunately, we could not establish a dose–effect relationship for radiation exposure by use of cohort methodology. Also, because only 23 patients did not receive radiation therapy, stratification analyses were not feasible. Alternative explanations for our finding that high doses of alkylators and anthracyclines were associated with risk include the possibility that the carcinogenic effect of radiation is increased by chemotherapy or that chemotherapeutic agents may be independently tumorigenic, inducing DNA damage and subsequently sarcomas.
Our study had several limitations, and the interpretation of its results must be considered in light of these limitations. Given the small number of patients with secondary sarcomas, examination of the effects of race and geography, as well as other demographic factors, on risk was not feasible. Because all second malignant neoplasms were self-reported in the CCSS, underreporting may have influenced our results. Family history of cancer was also self-reported and so may have been inaccurate; we did not use medical records to confirm such family histories. Finally, the analysis was limited to secondary sarcomas that were diagnosed 5 years or more after the primary cancer diagnosis; therefore, our study could not necessarily identify risks for earlier secondary sarcomas.
As the childhood cancer survivor population ages and expands in number, clinicians and researchers must carefully identify patients who are at risk for secondary morbidities, particularly for secondary cancers. Clinical factors associated with increased risk of secondary cancers appear to include prior radiotherapy, family history of cancer, other secondary cancers, prior history of childhood sarcoma, and prior treatment with high doses of alkylators and/or anthracyclines. Diagnosis of a sarcoma can sometimes be elusive because symptoms are often nonspecific. The clinician who is alert to a patient’s prior history is in a better position to make an early, and possibly life-saving, diagnosis because early detection of these tumors is associated with decreased morbidity (29). Moreover, development of screening techniques to detect a genetic predisposition to radiation sensitivity may lead to the identification of populations at increased risk for secondary sarcoma. Finally, these at-risk individuals may form a group in whom chemoprevention strategies for secondary sarcomas in childhood cancer survivors might be tested.
CONTEXT AND CAVEATS.
Prior knowledge
Childhood cancer survivors have an increased risk of secondary sarcomas, but few risk factors have been well studied.
Study design
Long-term prospective study of childhood cancer survivors.
Contribution
Childhood cancer survivors appear to have a more than ninefold increased risk of secondary sarcomas than the general population. Risks were highest among survivors of soft tissue sarcomas.
Implications
Because sarcoma symptoms are often nonspecific, their diagnosis can sometimes be elusive. Clinicians should be alert to any childhood cancer survivor’s prior history.
Limitations
The number of patients with secondary sarcomas was small, and so examination of some risk factors was not feasible. All secondary sarcomas and family histories of cancer were self-reported, and so underreporting may have occurred.
Acknowledgments
This research was supported by National Cancer Institute (NCI) grant (U24 CA55727, L. L. Robison, Principal Investigator), funding to the University of Minnesota from the Children’s Cancer Research Fund, and funding to St Jude Children’s Research Hospital from the American Lebanese Syrian Associated Charities.
The CCSS is funded by the NCI as a resource to promote and facilitate research among long-term survivors of cancer diagnosed during childhood and adolescence. Investigators interested in potential uses of this resource are encouraged to visit http://www.stjude.org/ccss.
The study design, data collection, analysis, interpretation of the results, and the preparation of the manuscript were the sole responsibility of the authors.
Appendix
CCSS Institutions and Investigators include: University of California—San Francisco, CA: Robert Goldsby, MD (Institutional Principal Investigator), Arthur Ablin, MD (Former Institutional Principal Investigator); University of Alabama, Birmingham, AL: Roger Berkow, MD (Institutional Principal Investigator); International Epidemiology Institute, Rockville, MD: John Boice, ScD (Member CCSS Steering Committee); University of Washington, Seattle, WA: Norman Breslow, PhD (Member CCSS Steering Committee); UT-Southwestern Medical Center at Dallas, TX: Gail Tomlinson, MD (Institutional Principal Investigator), Geroge R. Buchanan, MD (Former Institutional Principal Investigator); Cincinnati Children’s Hospital Medical Center: Stella Davies, MD, PhD (Member CCSS Steering Committee); Dana-Farber Cancer Institute, Boston, MA: Lisa Diller, MD (Institutional Principal Investigator), Holcombe Grier, MD (Former Institutional Principal Investigator), Frederick Li, MD (Member CCSS Steering Committee); Texas Children’s Center, Houston, TX: Zoann Dreyer, MD (Institutional Principal Investigator); Children’s Hospital and Medical Center, Seattle, WA: Debra Friedman, MD, MPH (Institutional Principal Investigator), Thomas Pendergrass, MD (Former Institutional Principal Investigator); Roswell Park Cancer Institute, Buffalo, NY: Daniel M. Green, MD (Institutional Principal Investigator, Member CCSS Steering Committee); Hospital for Sick Children, Toronto, ON: Mark Greenberg, MB, ChB (Institutional Principal Investigator); St Louis Children’s Hospital, MO: Robert Hayashi, MD (Institutional Principal Investigator), Teresa Vietti, MD (Former Institutional Principal Investigator); St Jude Children’s Research Hospital, Memphis, TN: Leslie L. Robison, PhD (Institutional Principal Investigator, Member CCSS Steering Committee), Melissa Hudson, MD (Institutional Principal Investigator, Member CCSS Steering Committee); University of Michigan, Ann Arbor, MI: Raymond Hutchinson, MD (Institutional Principal Investigator); Stanford University School of Medicine, Stanford, CA: Neyssa Marina, MD (Institutional Principal Investigator), Michael P. Link, MD (Former Institutional Principal Investigator), Sarah S. Donaldson, MD (Member CCSS Steering Committee); Emory University, Atlanta, GA: Lillian Meacham, MD (Institutional Principal Investigator); Children’s Hospital of Philadelphia, PA: Anna Meadows, MD (Institutional Principal Investigator, Member CCSS Steering Committee), Bobbie Bayton (Member CCSS Steering Committee); Children’s Hospital, Oklahoma City, OK: John Mulvihill, MD (Member CCSS Steering Committee); Children’s Hospital, Denver, CO: Brian Greffe (Institutional Principal Investigator), Lorrie Odom, MD (Former Institutional Principal Investigator); Children’s Hospitals and Clinics of Minnesota: Joanna Perkins, MD (Institutional Principal Investigator), Maura O’Leary, MD (Former Institutional Principal Investigator); Columbus Children’s Hospital, OH: Amanda Termuhlen, MD (Institutional Principal Investigator), Frederick Ruymann, MD (Former Institutional Principal Investigator), Stephen Qualman, MD (Member CCSS Steering Committee); Children’s National Medical Center, Washington, DC: Gregory Reaman, MD (Institutional Principal Investigator), Roger Packer, MD (Member CCSS Steering Committee); Children’s Hospital of Pittsburgh, PA: A. Kim Ritchey, MD (Institutional Principal Investigator), Julie Blatt, MD (Former Institutional Principal Investigator); University of Minnesota, Minneapolis, MN: Ann Mertens, PhD (Institutional Principal Investigator, Member CCSS Steering Committee), Joseph Neglia, MD, MPH (Member CCSS Steering Committee), Mark Nesbit, MD (Member CCSS Steering Committee); Children’s Hospital Los Angeles, CA: Kathy Ruccione, RN, MPH (Institutional Principal Investigator); Memorial Sloan-Kettering Cancer Center, New York, NY: Charles Sklar, MD (Institutional Principal Investigator, Member CCSS Steering Committee), Kevin Oeffi nger, MD (Member CCSS Steering Committee); National Cancer Institute, Bethesda, MD: Barry Anderson, MD (Member CCSS Steering Committee), Peter Inskip, ScD (Member CCSS Steering Committee); Mayo Clinic, Rochester, MN: Vilmarie Rodriguez, MD (Institutional Principal Investigator), W. Anthony Smithson, MD (Former Institutional Principal Investigator), Gerald Gilchrist, MD (Former Institutional Principal Investigator); The University of Texas M. D. Anderson Cancer Center, Houston, TX: Louise Strong, MD (Institutional Principal Investigator, Member CCSS Steering Committee), Marilyn Stovall, PhD (Member CCSS Steering Committee); Riley Hospital for Children, Indianapolis, IN: Terry A. Vik, MD (Institutional Principal Investigator), Robert Weetman, MD (Former Institutional Principal Investigator); Fred Hutchinson Cancer Research Center, Seattle, WA: Wendy Leisenring, ScD (Institutional Principal Investigator, Member CCSS Steering Committee), John Potter, MD, PhD (Former Institutional Principal Investigator, Member CCSS Steering Committee); University of Alberta, Edmonton, AB: Yutaka Yasui, PhD (Former Institutional Principal Investigator, Member CCSS Steering Committee); University of California—Los Angeles, CA: Lonnie Zeltzer, MD (Institutional Principal Investigator, Member CCSS Steering Committee).
References
- (1).Dreyer Z, Blatt J, Bleyer A. Late effects of childhood cancer and its treatment. In: Pizzo P, Poplack D, editors. Principles and practice of pediatric oncology. 4th ed. Philadelphia (PA): Lippincott Williams & Wilkins; 2002. p. 1431–62. [Google Scholar]
- (2).Greenlee RT, Murray T, Bolden S, Wingo PA. Cancer statistics, 2000. CA Cancer J Clin 2000;50:7–33. [DOI] [PubMed] [Google Scholar]
- (3).de Vathaire F, Hawkins M, Campbell S, Oberlin O, Raquin MA, Schlienger JY, et al. Second malignant neoplasms after a first cancer in childhood: temporal pattern of risk according to type of treatment. Br J Cancer 1999;79:1884–93. [DOI] [PMC free article] [PubMed] [Google Scholar]
- (4).Olsen JH, Garwicz S, Hertz H, Jonmundsson G, Langmark F, Lanning M, et al. Second malignant neoplasms after cancer in childhood or adolescence. Nordic Society of Paediatric Haematology and Oncology Association of the Nordic Cancer Registries. BMJ 1993;307: 1030–6. [DOI] [PMC free article] [PubMed] [Google Scholar]
- (5).Hawkins MM, Draper GJ, Kingston JE. Incidence of second primary tumours among childhood cancer survivors. Br J Cancer 1987;56:339–47. [DOI] [PMC free article] [PubMed] [Google Scholar]
- (6).Neglia JP, Friedman DL, Yasui Y, Mertens AC, Hammond S, Stovall M, et al. Second malignant neoplasms in five-year survivors of childhood cancer: childhood cancer survivor study. J Natl Cancer Inst. 2001;93: 618–29. [DOI] [PubMed] [Google Scholar]
- (7).Mertens AC, Yasui Y, Neglia JP, Potter JD, Nesbit ME Jr, Ruccione K, et al. Late mortality experience in five-year survivors of childhood and adolescent cancer: the Childhood Cancer Survivor Study. J Clin Oncol 2001;19:3163–72. [DOI] [PubMed] [Google Scholar]
- (8).Meadows AT, Baum E, Fossati-Bellani F, Green D, Jenkin RD, Marsden B, et al. Second malignant neoplasms in children: an update from the Late Effects Study Group. J Clin Oncol 1985;3: 532–8. [DOI] [PubMed] [Google Scholar]
- (9).Robison LL, Mertens AC, Boice JD, Breslow NE, Donaldson SS, Green DM, et al. Study design and cohort characteristics of the Childhood Cancer Survivor Study: a multi-institutional collaborative project. Med Pediatr Oncol 2002;38:229–39. [DOI] [PubMed] [Google Scholar]
- (10).Tucker MA, D’Angio GJ, Boice JD Jr, Strong LC, Li FP, Stovall M, et al. Bone sarcomas linked to radiotherapy and chemotherapy in children. N Engl J Med. 1987;317: 588–93. [DOI] [PubMed] [Google Scholar]
- (11).Travis LB, Holowaty EJ, Bergfeldt K, Lynch CF, Kohler BA, Wiklund T, et al. Risk of leukemia after platinum-based chemotherapy for ovarian cancer. N Engl J Med. 1999;340:351–7. [DOI] [PubMed] [Google Scholar]
- (12).Surveillance, Epidemiology, and End Results (SEER) Program. SEER*Stat Database: Incidence—SEER 9 Regs Public-Use, Nov 2004 submission (1973–2003), released April 2005. Available at: http://seer.cancer.gov.
- (13).Kalbfl eisch J, Prentice R. The statistical analysis of failure time data. New York (NY): John Wiley and Sons; 1980. p. 168–9. [Google Scholar]
- (14).Lin D, Wei LJ, Ying Z. Checking the Cox model with cumulative sums of martingale-based residuals. Biometrika 1993;80:557–72. [Google Scholar]
- (15).Li FP, Fraumeni JF Jr. Rhabdomyosarcoma in children: epidemiologic study and identification of a familial cancer syndrome. J Natl Cancer Inst 1969;43:1365–73. [PubMed] [Google Scholar]
- (16).Li FP, Fraumeni JF Jr. Soft-tissue sarcomas, breast cancer and other neoplasms. A familial syndrome? Ann Intern Med 1969;71:747–52. [DOI] [PubMed] [Google Scholar]
- (17).Kingston JE, Hawkins MM, Draper GJ, Marsden HB, Kinnier Wilson LM. Patterns of multiple primary tumours in patients treated for cancer during childhood. Br J Cancer 1987;56:331–8. [DOI] [PMC free article] [PubMed] [Google Scholar]
- (18).McIntyre JF, Smith-Sorensen B, Friend SH, Kassell J, Borresen AL, Yan YX, et al. Germline mutations of the p53 tumor suppressor gene in children with osteosarcoma. J Clin Oncol 1994;12:925–30. [DOI] [PubMed] [Google Scholar]
- (19).Huvos AG, Woodard HQ, Cahan WG, Higinbotham NL, Stewart FW, Butler A, et al. Postradiation osteogenic sarcoma of bone and soft tissues. A clinicopathologic study of 66 patients. Cancer 1985;55:1244–55. [DOI] [PubMed] [Google Scholar]
- (20).Cahan WG, Woodard HQ, Higinbotham NL, Stewart FW, Coley BL. Sarcoma arising in irradiated bone: report of eleven cases. 1948. Cancer 1998; 82:8–34. [DOI] [PubMed] [Google Scholar]
- (21).Kim JH, Chu FC, Woodard HQ, Melamed MR, Huvos A, Cantin J. Radiation-induced soft-tissue and bone sarcoma. Radiology 1978;129:501–8. [DOI] [PubMed] [Google Scholar]
- (22).Newton WA Jr, Meadows AT, Shimada H, Bunin GR, Vawter GF. Bone sarcomas as second malignant neoplasms following childhood cancer. Cancer 1991; 67: 193–201. [DOI] [PubMed] [Google Scholar]
- (23).Bielack SS, Rerin JS, Dickerhoff R, Dilloo D, Kremens B, von Stackelberg A, et al. Osteosarcoma after allogeneic bone marrow transplantation. A report of four cases from the Cooperative Osteosarcoma Study Group (COSS). Bone Marrow Transplant 2003;31:353–9. [DOI] [PubMed] [Google Scholar]
- (24).Ferrari C, Bohling T, Benassi MS, Ferraro A, Gamberi G, Bacci G, et al. Secondary tumors in bone sarcomas after treatment with chemotherapy. Cancer Detect Prev 1999;23:368–74. [DOI] [PubMed] [Google Scholar]
- (25).Le Vu B, de Vathaire F, Shamsaldin A, Hawkins MM, Grimaud E, Hardiman C, et al. Radiation dose, chemotherapy and risk of osteosarcoma after solid tumours during childhood. Int J Cancer 1998;77:370–7. [DOI] [PubMed] [Google Scholar]
- (26).Garwicz S, Anderson H, Olsen JH, Dollner H, Hertz H, Jonmundsson G, et al. Second malignant neoplasms after cancer in childhood and adolescence: a population-based case-control study in the 5 Nordic countries. The Nordic Society for Pediatric Hematology and Oncology. The Association of the Nordic Cancer Registries. Int J Cancer 2000;88:672–8. [DOI] [PubMed] [Google Scholar]
- (27).de Vathaire F, Francois P, Hill C, Schweisguth O, Rodary C, Sarrazin D, et al. Role of radiotherapy and chemotherapy in the risk of second malignant neoplasms after cancer in childhood. Br J Cancer 1989; 59:792–6. [DOI] [PMC free article] [PubMed] [Google Scholar]
- (28).Kony SJ, de Vathaire F, Chompret A, Shamsaldim A, Grimaud E, Raquin MA, et al. Radiation and genetic factors in the risk of second malignant neoplasms after a first cancer in childhood. Lancet 1997;350:91–5. [DOI] [PubMed] [Google Scholar]
- (29).Tabone MD, Terrier P, Pacquement H, Brunat-Mentigny M, Schmitt C, Babin-Boilletot A, et al. Outcome of radiation-related osteosarcoma after treatment of childhood and adolescent cancer: a study of 23 cases. J Clin Oncol 1999;17:2789–95. [DOI] [PubMed] [Google Scholar]
- (30).Hawkins MM, Wilson LM, Burton HS, Potok MH, Winter DL, Marsden HB, et al. Radiotherapy, alkylating agents, and risk of bone cancer after childhood cancer. J Natl Cancer Inst 1996; 88:270–8. [DOI] [PubMed] [Google Scholar]