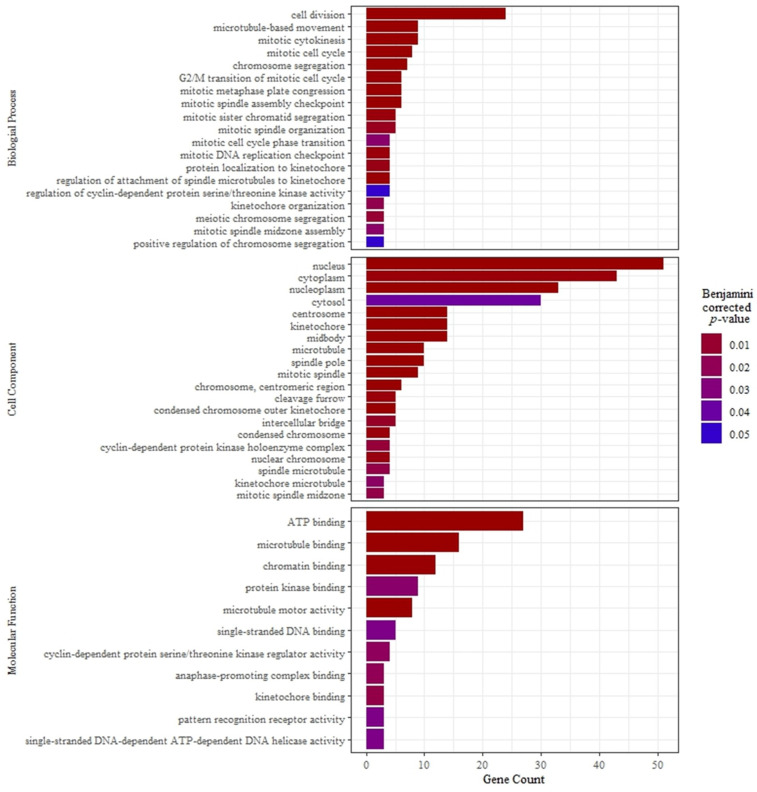
Figure 1.
Enrichment analysis of the Gene Ontology domains was performed using the Database for Annotation, Visualization, and Integrated Discovery (v. 2021) comparing a list of differentially expressed genes (mean read count ≥ 10; p-value ≤ 0.05; fold change ≥ 1.5) between liver tissue of high feed efficient (HE; n = 12) and low feed efficient (LE; n = 12).

