


Abstract
Two-dimensional (2D) agarose gel electrophoresis was used to study termination of DNA replication in a shuttle vector, YRp7′, when it replicated in Escherichia coli, Saccharomyces cerevisiae and Xenopus egg extracts. In E.coli, the 2D gel patterns obtained were consistent with uni-directional replication initiated at a specific site, the ColE1 origin. In consequence, termination also occurred precisely at the ColE1 origin. In Xenopus egg extracts, the particular shape of the bubble arc as well as the triangular smear detected to the left of the simple-Y pattern indicated random initiation and termination. In S.cerevisiae, initiation occurred at the ARS1 origin and replication proceeded in a bi-directional manner. However, termination did not always occur at a specific site 180° across from the origin, but almost all along the south hemisphere of the plasmid. Inversion, deletion or replacement of DNA sequences located throughout this hemisphere did not eliminate random termination. Analysis of the replication intermediates of another yeast plasmid bearing a different origin, ARS305, also exhibited random termination. We propose that the random termination events observed in S.cerevisiae could be due to an asynchronous departure of both forks from the bi-directional origin in addition to differences in the rate of fork progression. These observations could be extended to all bi-directional origins.
INTRODUCTION
During the last decade, significant progress has been made in the identification of the sites where initiation of DNA replication occurs in prokaryotes and eukaryotes (1). Two-dimensional (2D) agarose gel electrophoresis is just one of the many different techniques that are frequently used to map replication origins (2). But 2D gels do not only allow identification of those replication intermediates (RIs) containing an internal bubble. This technique also allows mapping of sites where termination occurs (3) and those sites where replication forks stop or pause (4 and references therein). Moreover, a particular pattern in 2D gels, named a triangular smear, has been perceived as an indication of random termination of DNA replication (5–14). Randomness of initiation was often ascribed as the only basis for this variation in termination sites. Most of these observations, however, were made for different plasmids or chromosomes in different systems. In order to confirm them and make comparisons reliable, we decided to use 2D agarose gel electrophoresis to study the replication of a shuttle vector, YRp7′ (Fig. 1), in three different systems. In Escherichia coli, YRp7′ was expected to initiate specifically at the ColE1 origin and replication would proceed in a uni-directional manner (3,15,16). In Saccharomyces cerevisiae, YRp7′ was expected to initiate specifically at the autonomously replicating sequence (ARS1) origin and replication would proceed bi-directionally (2,17,18). Finally, it is well known that almost any DNA fragment incubated in vitro in Xenopus egg extracts initiates replication at random (9–11,19). Therefore, we anticipated three different replication modes for YRp7′ depending on whether it was replicated in E.coli, S.cerevisiae or Xenopus egg extracts.
Figure 1.

Map of YRp7′. The grey lines indicate DNA sequences from S.cerevisiae. The black lines correspond to DNA sequences from the E.coli plasmid pBR322. Coding sequences are indicated inside. The uni-directional ColE1 origin (black single arrowhead) and the bi-directional ARS1 origin (grey double arrowhead) are indicated on the outside circle, as well as the position of a selected number of restriction endonucleases.
MATERIALS AND METHODS
Bacterial strain and culture medium
The E.coli strain used in this study was DH5αF′. Competent cells were transformed with monomeric forms of the plasmids as described elsewhere (16). Cells were grown at 37°C in LB medium containing 50 µg/ml ampicillin unless otherwise specified.
Plasmid constructs
YRP7′ and A6CNru were kindly provided by Carol Newlon (Department of Microbiology and Molecular Genetics, University of Medicine and Dentistry of New Jersey, NJ). YRp7′-inv was constructed by inverting the DNA fragment located between ClaI and NdeI sites (see Fig. 1). YRp7′-ΔTet was constructed by deleting the DNA fragment between ClaI and StyI sites (see Fig. 1). Finally, YRp7′-rDNA was constructed by replacing the whole ClaI–NdeI fragment of YRp7′ with a 2.2 kb SalI fragment from human ribosomal DNA.
Isolation of plasmid DNA from E.coli
Cells from overnight cultures were diluted 40-fold into fresh LB medium, grown at 37°C to exponential phase (A600 = 0.4–0.6), quickly chilled and centrifuged. Aliquots of 1000 ml of cultured cells were washed with 20 ml of STE buffer (0.1 M NaCl, 10 mM Tris–HCl, pH 8.0, and 1 mM EDTA, pH 8.0), harvested by centrifugation and resuspended in 5 ml of 25% sucrose and 0.25 M Tris–HCl, pH 8.0. Lysozyme (10 mg/ml) and RNase A (0.1 mg/ml) were added and the suspension was maintained on ice for 5 min. Afterwards 2 ml of 0.25 M EDTA, pH 8.0, were added and the suspension was kept on ice for another 5 min. Cell lysis was achieved by adding 8 ml of lysis buffer (1% Brij-58, 0.4% sodium deoxycholate, 0.063 M EDTA, pH 8.0, and 50 mM Tris–HCl, pH 8.0) and keeping the lysate on ice for 15 min. The lysate was centrifuged at 26 000 g for 45 min at 4°C to pellet the chromosomal DNA and other bacterial debris. Plasmid DNA was recovered from the supernatant and precipitated by adding a 2/3 vol of 25% polyethylene glycol 6000 and 1.25 M NaCl in TE (10 mM HCl, pH 8.0, and 1 mM EDTA) and kept overnight at 4°C on ice. The precipitated DNA was pelleted by centrifugation at 6000 g for 15 min at 4°C. The pellet was resuspended and incubated in 5 ml of a preheated digestion buffer (100 µg/ml proteinase K in 1 M NaCl, 10 mM Tris–HCl, pH 9.0, 1 mM EDTA and 0.1% SDS) at 37°C for 60 min. Proteins were extracted twice in phenol:chloroform:isoamyl alcohol (25:24:1) equilibrated with 10 mM Tris–HCl, pH 8.0, and once with chloroform:isoamyl alcohol (24:1). The DNA was precipitated with 2.5 vol of absolute ethanol overnight at –20°C and resuspended in TE. The DNA was digested with restriction endonucleases (Boehringer Mannheim) as recommended by the manufacturer in the presence of 100 µg/ml RNase A.
Yeast strain, culture media and cell synchronization
The yeast strain used in this study was RM14-3A (MATα his6, bar1, trp1-289, leu2-2, 112 ura3-52, Cdc7-1, [rho+], [cir+]), kindly provided by the Brewer–Fangman laboratory (Department of Genetics, University of Washington, Seattle, WA). Cells were grown in complete YPAD medium or in minimal SD medium (20) supplemented with 0.67% YNB, 2% glucose, 0.106% CAA-UA (94.3% bacto casamino acids, 3.8% adenine sulphate and 1.9% uracil) for selection of Trp+ transformants. Cells were transformed using an Invitrogen Electroporator, as recommended by the manufacturer. Synchronization of the cultures was achieved following the α-factor/cdc7 procedure described by Brewer and Fangman (2).
Isolation of plasmid DNA from S.cerevisiae
DNA was isolated by the method of Huberman and co-workers (21) except that, after cell lysis and proteinase K treatment, nucleic acids were purified by phenol/chloroform extraction and ethanol precipitation, rather than by density gradient. Finally, samples were dissolved in 10 mM Tris–HCl, pH 8.0, 1 mM EDTA at an equivalent DNA concentration of 3 × 10⁷ cells/µl. The DNA obtained from 2–4 × 10⁸ cells was digested with the appropriate restriction enzymes in the presence of 100 µg/ml RNase A and used in each 2D gel.
Replication of plasmid DNA in Xenopus egg extracts
Replication-competent extracts from unfertilized Xenopus eggs (22) were prepared and used as described elsewhere (23). Addition of [α-32P]dATP to the extract allowed direct labelling of all the replication products. After incubation in this extract, plasmid DNA was isolated by digestion with RNase A and proteinase K, phenol/chloroform extraction and ethanol precipitation as described by Hyrien and Mechali (9).
Two-dimensional agarose gel electrophoresis
Analysis of RIs by 2D agarose gel electrophoresis was performed as described elsewhere (4,24,25). The first dimension was in a 0.4% agarose gel in TBE buffer at 1 V/cm and room temperature for 20–24 h. The lane containing the λ DNA/HindIII marker sizes was excised, stained with 0.5 µg/ml ethidium bromide and photographed. In the meantime, the lanes containing DNA RIs were kept in the dark. The second dimension was in a 0.85–1% agarose gel in TBE containing 0.3 µg/ml ethidium bromide at a 90° angle with respect to the first dimension. The dissolved agarose was poured around the excised lane from the first dimension and electrophoresis was at 5 V/cm in a 4°C cold room for 6–9 h.
Southern transfer and hybridization
Gels were washed for 15 min in 0.25 N HCl before an overnight transfer to Zeta-Probe blotting membranes (Bio-Rad) in 0.4 N NaOH. Prehybridization was carried out in 2× SSPE (3.6 M NaCl, 0.2 M Na2HPO4, 20 mM EDTA), 1% SDS, 10% dextran sulphate, 0.5% Blotto and 250 mg/ml sonicated salmon sperm DNA at 65°C. After 4 h, 6 × 10⁵ c.p.m./ml of probe DNA labelled with [α-32P]dCTP by random priming was added and incubated at 65°C overnight. After hybridization the membranes were washed in 2% SSC, 0.1% SDS at room temperature for 15 min followed by an additional 15 min in 0.5% SSC, 0.1% SDS also at room temperature. The last 15 min wash was in 0.1% SSC, 0.1% SDS at 65°C. Exposure of Curix RP2 (Agfa) films was carried out at –80°C with two intensifying screens for 1–3 days.
RESULTS
Our main task was to characterize, by 2D agarose gel electrophoresis, the termination patterns of YRp7′ (Fig. 1) when replicated in E.coli, S.cerevisiae and Xenopus extracts. In order to compare the patterns obtained in the three different systems, we digested the plasmid with the same restriction enzyme in all cases. We choose EcoRI, which cuts YRp7′ twice (see Fig. 1) producing two linear fragments, the bigger 4361 bp long and the smaller 1447 bp long. After electrophoresis, the DNA in the gel was transferred to nitrocellulose membranes and hybridized with 32P-labelled pBR322 DNA that detects only the bigger 4361 bp long fragment. We used the computer program developed by Viguera et al. (26) to predict the shape of the RIs and the patterns expected in each case.
Initiation and termination in uni-directional replication
Figure 2 corresponds to YRp7′ replicated in E.coli. As the computer model predicts (26), following initiation a bubble would be formed that is expected to grow in a uni-directional manner, rightward, until the replication fork reaches the right end of the fragment (Fig. 2a). While the fork replicates the other 1447 bp long fragment, a simple-Y RI, would accumulate until the fork re-enters the fragment at its left end. As the fork continues moving rightward, the mass of the RIs, now with a double-Y shape, will grow steadily until the fork reaches the initiation site. In other words, initiation and termination would take place specifically at the ColE1 origin of replication (3,16). Following initiation, the RIs are expected to increase in mass as a molecule containing an internal bubble, until the fork reaches the right end of the fragment. At this time the bubble would open up and the shape of the molecule would change to a simple-Y. As the fork re-enters the fragment at the left end, the RIs would continue to increase in mass as a double-Y. The patterns predicted by the computer model are depicted in Figure 2b. An autoradiogram of the corresponding gel is shown in Figure 2c, with a diagrammatic interpretation in Figure 2d. The results obtained were basically identical to those predicted by the computer program.
Figure 2.
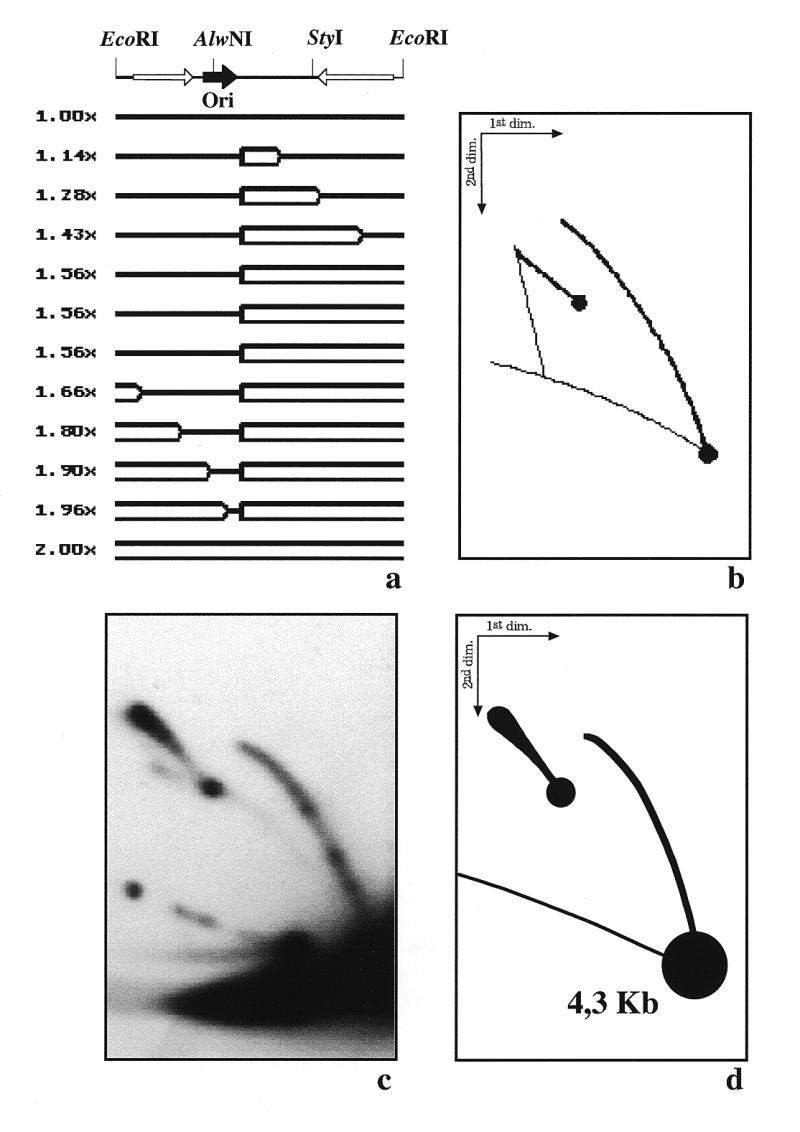
Two-dimensional agarose gel electrophoresis of the RIs of YRp7′ isolated from E.coli after digestion with EcoRI. (a) Linearized map of YRp7′ and a selected number of the expected RIs as calculated by the computer program developed by Viguera et al. (26). The corresponding masses are indicated to the left. (b) The 2D gel pattern expected. (c) Autoradiogram of the 2D gel hybridized with pBR322 used as probe. (d) Diagram of the autoradiogram that was prepared after studying different exposures in order to confirm the nature of each signal. The names given throughout the text to the most prominent signals are depicted in the diagram.
Initiation and termination in bi-directional replication
Figure 3 corresponds to YRp7′ replicated in S.cerevisiae. In this system, initiation is expected to take place specifically at ARS1 (2), which is located in the smaller 1447 bp long fragment of YRp7′. As a consequence, for the larger 4361 bp long fragment no RI would contain an internal bubble. Two replication forks would enter this fragment moving in opposite directions until they meet approximately midway (Fig. 3a). Since the initiation site at ARS1 is located closer to one end of the smaller 1447 bp long fragment of YRp7′ (17,18), the fork moving leftward would enter the larger fragment first. Therefore, the first RIs were expected to have a simple-Y shape. As soon as the other fork enters the fragment, the shape of the RIs would change to a double-Y. The patterns predicted by the computer program are depicted in Figure 3b. An autoradiogram of the corresponding gel is shown in Figure 3c, with a diagrammatic interpretation in Figure 3d. The results obtained were similar to those predicted by the computer program. However, the autoradiogram shown in Figure 3c revealed that some RIs achieved a mass corresponding to 1.5× the mass of the unreplicated linear fragment, still having a simple-Y shape. The computer program, assuming that both forks depart from the origin simultaneously and move at the same rate, predicted a switch from simple-Y to double-Y at a mass of 1.2× at the most. This apparent disagreement between the expected and observed results will be discussed later on. Anyway, the results obtained indicate that, contrary to the situation in E.coli, when YRp7′ replicated in S.cerevisiae initiation and termination of DNA replication occurred at different places. This result was consistent with a bi-directional mode of replication.
Figure 3.
Two-dimensional agarose gel electrophoresis of the RIs of YRp7′ isolated from S.cerevisiae after digestion with EcoRI. (a) Linearized map of YRp7′ and a selected number of the expected RIs as calculated by the computer program developed by Viguera et al. (26). The corresponding masses are indicated to the left. (b) The 2D gel pattern expected. (c) Autoradiogram of the 2D gel hybridized with pBR322 DNA used as probe. (d) Diagram of the autoradiogram that was prepared after studying different exposures in order to confirm the nature of each signal.
Random initiation leads to random termination
Figure 4 corresponds to YRp7′ replicated in Xenopus extracts. In this system, initiation was expected to occur at any place along the plasmid and replication would proceed in a bi-directional manner (9–11,19). Therefore, termination was also expected to occur at random. The patterns expected would reflect a mixture of molecules where initiation and termination occurred at different places. The shapes of the RIs predicted by the computer program for three different initiation sites are depicted in Figure 4a. The 2D gel pattern predicted for 20 different initiation sites is depicted in Figure 4b. An autoradiogram of the corresponding gel is shown in Figure 4c, with a diagrammatic interpretation in Figure 4d. The most dramatic changes in replication of the DNA fragment, as observed in 2D gels, are the switches from one pattern to another. The switch from a bubble to a simple-Y and from a simple-Y to a double-Y occurs at a specific mass for each individual molecule. When YRp7′ replicates in Xenopus extracts, however, each molecule initiates at a different site. As a consequence, these switches occur at a different mass for each individual molecule. The most meaningful outcome of this situation was the triangular smear detected to the left of the descending portion of the simple-Y signal. Actually, the limits of this triangular smear were the descending portion of the simple-Y arc, the signal for X-shaped recombinants and the double-Y pattern generated by those plasmids where termination occurred precisely at the middle of the fragment. In all those cases where transition from simple-Y to double-Y occurred before the RIs attained a mass of 1.5× the mass of unreplicated linear forms, the signals tended to co-migrate in the upper part of the triangular smear. This explains the differences in intensity observed across the triangular smear. Another peculiar observation in the autoradiogram shown in Figure 4c was the shape of the bubble arc. We call it ‘cobra-like’, in an attempt to describe its main characteristics: the progressive thickening and weakening of the signal in its mid portion and its sharpness at the end.
Figure 4.

Two-dimensional agarose gel electrophoresis of the RIs of YRp7′ replicated in Xenopus extracts after digestion with EcoRI. (a) Linearized maps and a selected number of the expected RIs for three different populations where initiation occurred at different places. The corresponding masses are indicated to the left. (b) The 2D gel patterns expected as calculated by the computer program developed by Viguera et al. (26). (c) Autoradiogram of the 2D gel hybridized with pBR322 DNA used as probe. (d) Diagram of the autoradiogram.
The shape of the bubble arc reflects random initiation
The shape of the bubble arc corresponding to YRp7′ replicated in E.coli (Fig. 2c) differed significantly from the ‘cobra-like’ bubble arc observed when the same plasmid replicated in Xenopus egg extracts (Fig. 4c). According to theory, however, some RIs in both systems should be identical and are expected to co-migrate in 2D gels. Figure 5a shows the shape of a number of RIs predicted by the computer program (26) for YRp7′ replicated in E.coli after digestion with EcoRI. Figure 5b shows the shape of a number of RIs corresponding to one of the many populations of YRp7′ replicated in Xenopus egg extracts. In this particular case, when initiation occurred close to the StyI site. The grey rectangle marks the RIs with a mass of 1.57× the mass of unreplicated linear forms in both cases. The mass and the shape of these RIs are identical. Therefore, they should migrate to exactly the same position in a 2D gel. To test this assumption we mixed the DNA obtained after replication of YRp7′ in E.coli and in Xenopus egg extracts and analysed them together in the same 2D gel. Similar experiments have already been performed to compare the replication patterns generated by RIs in different systems (27,28). In the autoradiogram shown in Figure 5c the ratio of YRp7′ DNA replicated in E.coli to the same plasmid DNA replicated in Xenopus was 1:1. In the autoradiogram shown in Figure 5e the DNA replicated in Xenopus was in excess. The autoradiogram shown in Figure 5c gives the false impression that the two bubble arcs did not fully co-migrate. In particular, note that the upper portion of the bubble arc corresponding to the DNA replicated in E.coli appeared to the left of the complete bubble arc corresponding to the DNA replicated in Xenopus. As mentioned before, this is a false impression due to the dispersion of the signal corresponding to the Xenopus ‘cobra-like’ bubble arc in its mid section. As shown in Figure 5e, when the amount of DNA replicated in Xenopus was increased in the mixture, the ‘cobra-like’ bubble arc from Xenopus completely covered the end of the bubble signal corresponding to the DNA replicated in E.coli. In summary, random initiation in Xenopus extracts not only produced the so-called triangular smear, but also affected the shape of the bubble arc. Progressive thickening and diffusion of the bubble arc signal in its middle section and a characteristic sharpness at the end of the signal were distinctive and reflected the heterogeneity of the population of RIs in this system.
Figure 5.
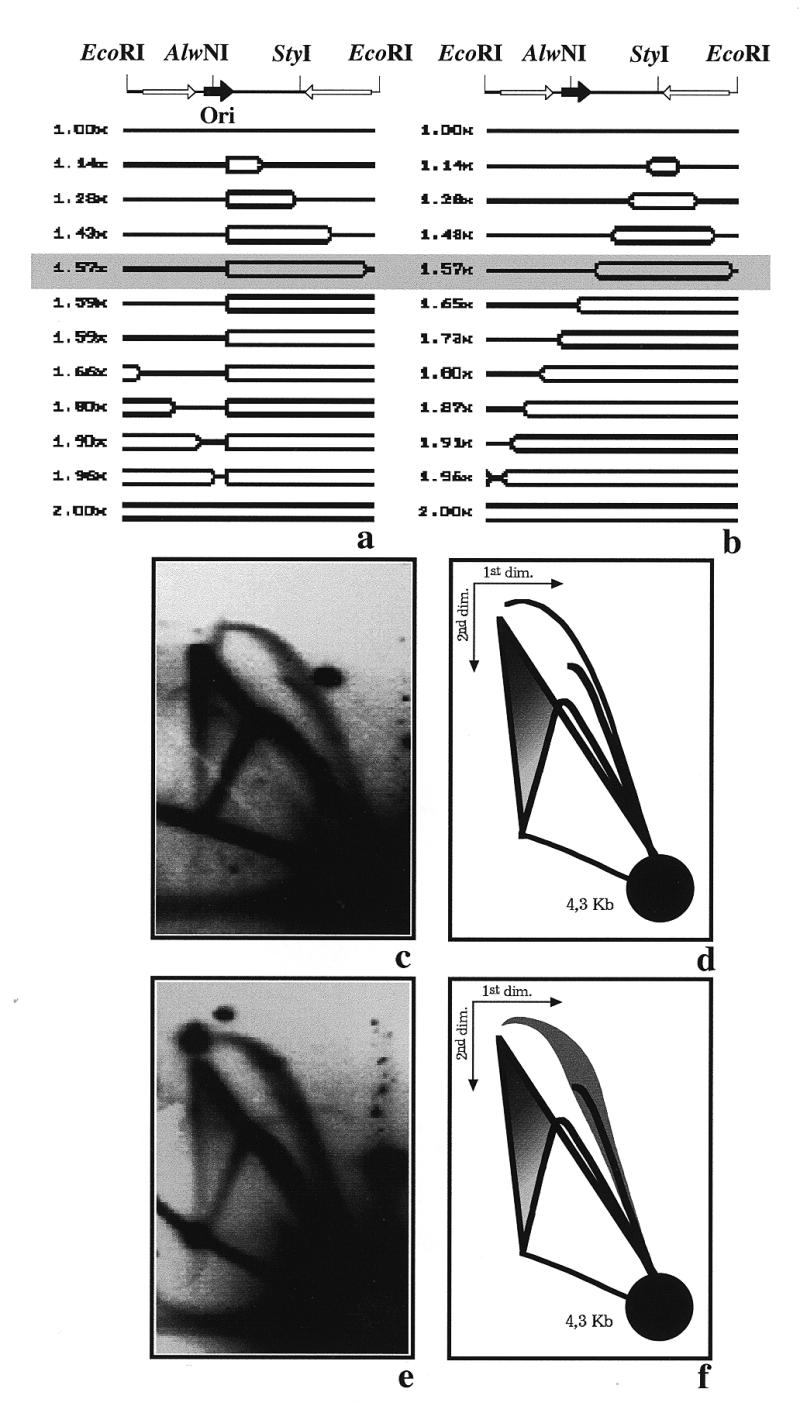
Two-dimensional agarose gel electrophoresis of YRp7′ mixtures of RIs replicated in E.coli and Xenopus extracts after digestion with EcoRI. (a) Linearized map and a selected number of the expected RIs for YRp7′ replicated in E.coli, where initiation occurs at the ColE1 origin and replication progresses in a uni-directional mode. (b) Linearized map and a selected number of the expected RIs for one of the many populations of RIs from YRp7′ replicated in Xenopus extracts, where initiation occurs at random and replication progresses in a bi-directional mode. In this particular case, initiation coincides with the StyI restriction site. The corresponding masses are indicated to the left and the shape of the RIs with a relative mass 1.57 times the mass of the unreplicated molecule are shadowed to highlight their similarity. (c) Autoradiogram of the 2D gel corresponding to a 1:1 mixture of DNA replicated in E.coli and Xenopus extracts. (d) Diagram of the autoradiogram. (e) Autoradiogram of the 2D gel corresponding to a mixture of DNAs replicated in E.coli and Xenopus extracts where the DNA replicated in Xenopus is in excess. Both blots were hybridized with pBR322 DNA used as probe. (f) Diagram of the autoradiogram.
Random termination of YRp7′ DNA replicated in S.cerevisiae
As mentioned before, an apparent disagreement between the expected and observed results was detected when YRp7′ replicated in S.cerevisiae (see Fig. 3). The autoradiogram shown in Figure 3c revealed that some RIs achieved a mass corresponding to 1.5× the mass of the unreplicated linear fragment, still having a simple-Y shape. The computer program, on the other hand, assuming that both forks depart from the origin at the same time and move at the same rate, predicted a switch from simple-Y to double-Y at a mass of 1.2× (see Fig. 3a). To confirm these results we decided to analyse the same RIs replicated in S.cerevisiae, but now after digestion with AlwNI. This restriction enzyme cuts YRp7′ only once at a position located ~180° from ARS1 (see Fig. 1). Figure 6 corresponds to YRp7′ replicated in S.cerevisiae after digestion with AlwNI. In this case initiation of DNA replication was expected to occur near the middle of the fragment (Fig. 6a). A bubble would be formed as the two growing forks moved apart, in opposite directions, towards the ends of the linearized fragment. If both forks move at the same rate, the one moving leftward would arrive at the end first and at that time the shape of the RIs would change from a bubble to a double-Y. This switch was expected to occur at a mass corresponding to 1.8× the mass of the unreplicated linear form. The patterns predicted by the computer program are depicted in Figure 6b. An autoradiogram of the corresponding gel is shown in Figure 6c, with a diagrammatic interpretation in Figure 6d. The results obtained differed significantly from those predicted by the computer program. The most important differences concerned the presence of a triangular smear to the left of the simple-Y and the shape of the bubble arc. As previously indicated in the description of the patterns corresponding to YRp7′ replicated in Xenopus egg extracts, these patterns indicate heterogeneity of the population of RIs. However, initiation of YRp7′ DNA replication in S.cerevisiae occurs at a specific site: the replication origin ARS1 (2,17,18). Therefore, the cause of this heterogeneity could only be asynchronous departure of the two forks from the origin or differences in the rate of fork progression. To our knowledge, this is the first time that it has clearly been shown that even for a small plasmid such as YRp7′, the triangular smear pattern and the ‘cobra-like’ shape of the bubble arc detected in 2D gels are not necessarily caused by random initiation of DNA replication.
Figure 6.
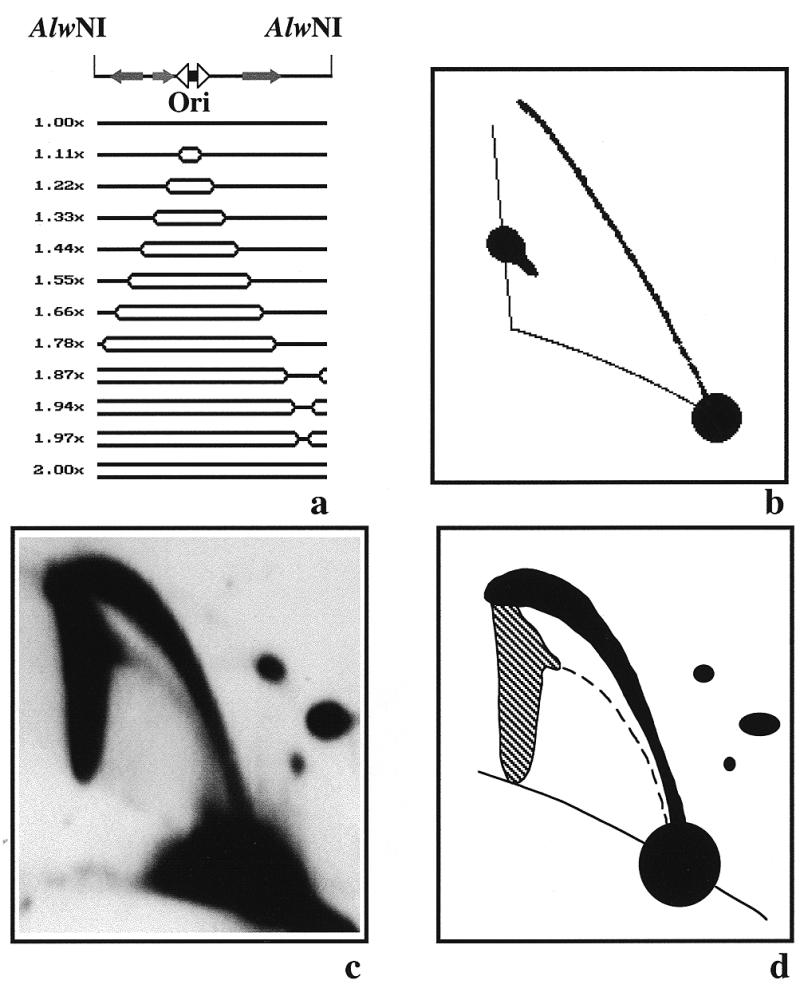
Two-dimensional agarose gel electrophoresis of the RIs of YRp7′ isolated from S.cerevisiae after digestion with AlwNI. (a) Linearized map of YRp7′ and a selected number of the expected RIs as calculated by the computer program developed by Viguera et al. (26) assuming that both forks depart from the origin at the same time and move at the same rates. The corresponding masses are indicated to the left. (b) The 2D gel pattern expected. (c) Autoradiogram of the 2D gel hybridized with pBR322 DNA used as probe. (d) Diagram of the autoradiogram.
Termination occurs almost all along the south hemisphere of YRp7′
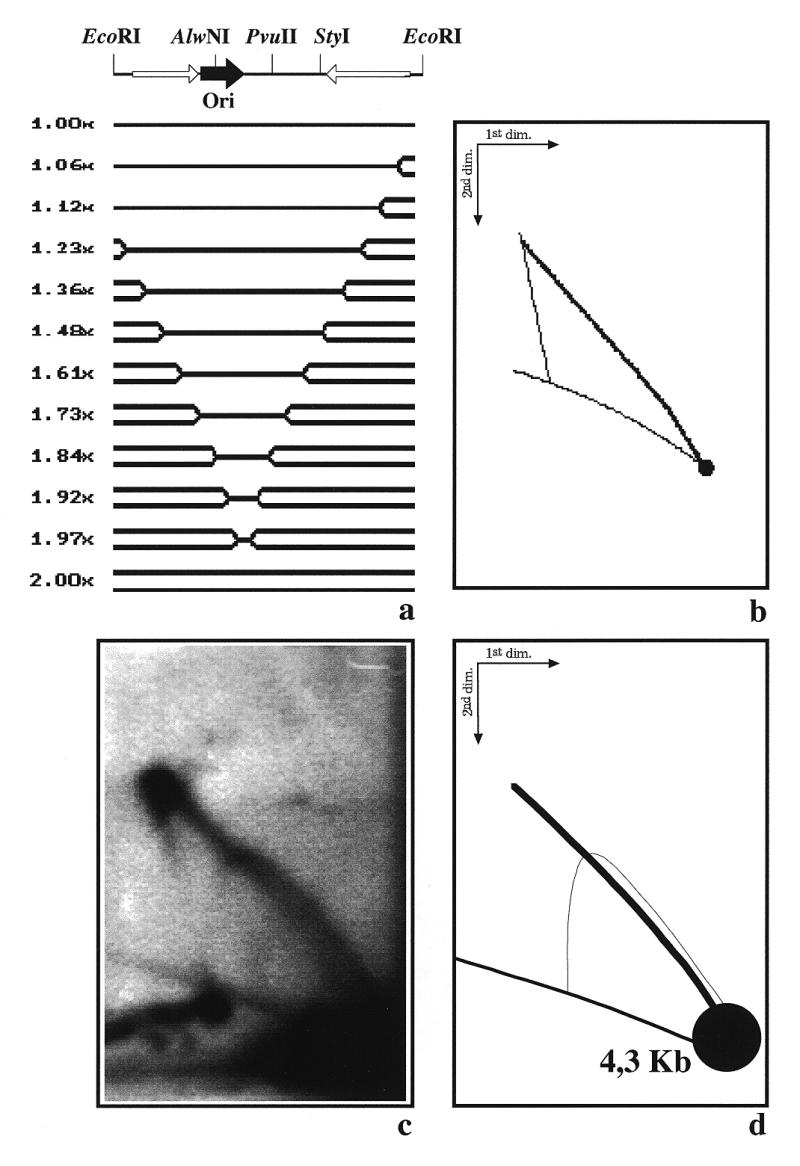
The 2D gel pattern obtained after digestion of YRp7′ with AlwNI (Fig. 6) led us to conclude that termination of DNA replication in YRp7′ did not occur at a single specific site. In order to confirm and extend this observation, we decided to analyse the RIs corresponding to a smaller fragment that covers only part of the south hemisphere of YRp7′. We chose the BglII–PvuII 2.6 kb fragment. If both forks initiate at ARS1, depart from the origin at the same time and move at the same rate, this fragment would be replicated entirely by the fork moving clockwise across the south hemisphere, generating a simple-Y pattern (Fig. 7a). The pattern predicted by the computer program is depicted in Figure 7b. An autoradiogram of the corresponding gel is shown in Figure 7c, with a diagrammatic interpretation in Figure 7d. Once again, the results obtained disagreed with the prediction. The descending portion of the simple-Y was significantly thicker and a small but clearly distinguished triangular smear was detected toward the 2.0× mark (indicated by an arrow in Fig. 7c). Altogether, these experiments indicated that termination of DNA replication could occur almost all along the south hemisphere of the plasmid. Progression of the other fork, that responsible for replication of the north hemisphere of the plasmid, did not occur as predicted by the program either (data not shown). The disagreement, however, was not so obvious as in the case of the south hemisphere.
Figure 7.
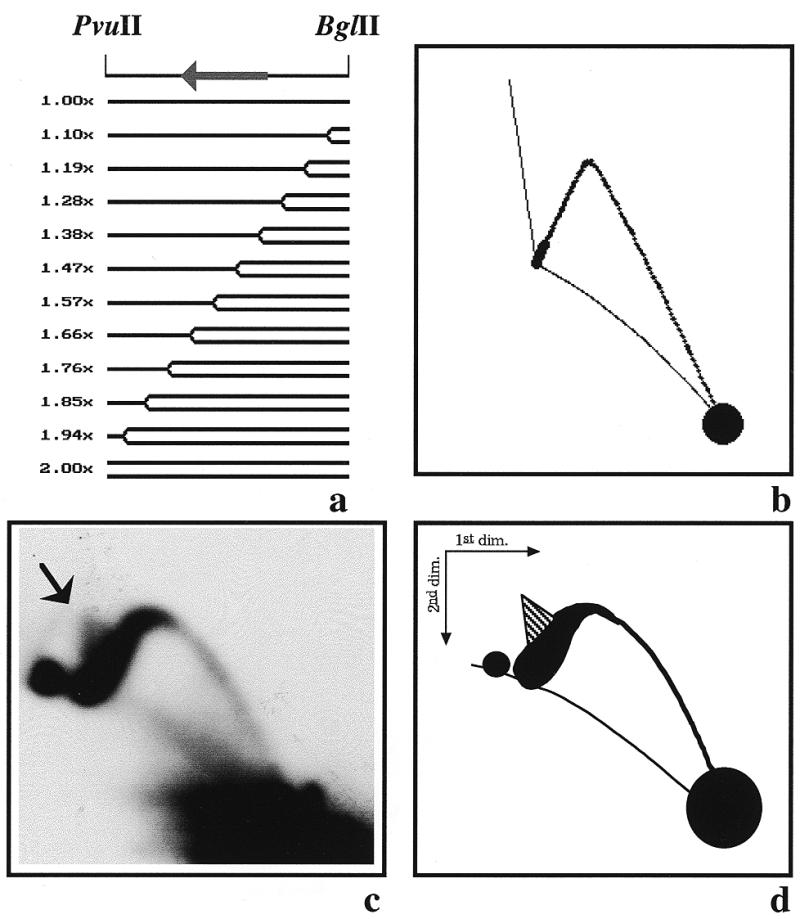
Two-dimensional agarose gel electrophoresis of the RIs of YRp7′ isolated from S.cerevisiae after digestion with PvuII and BglII. (a) Linearized map of YRp7′ and a selected number of the expected RIs as calculated by the computer program developed by Viguera et al. (26) assuming that both forks depart from the origin at the same time and move at the same rate. The corresponding masses are indicated to the left. (b) The 2D gel pattern expected. (c) Autoradiogram of the 2D gel hybridized with pBR322 DNA used as probe. (d) Diagram of the autoradiogram.
Changing the DNA sequences of the south hemisphere does not eliminate random termination
The results obtained so far indicated that during replication of YRp7′ in S.cerevisiae the fork travelling across the south hemisphere moved to different extents in different molecules. This variation led to heterogeneity in the population of RIs identified by 2D agarose gel electrophoresis. We wanted to test whether this broad termination zone was sequence dependent. To answer this question we inverted, deleted and replaced DNA sequences in this south hemisphere. YRp7′-inv was constructed by inverting the DNA fragment located between the ClaI and NdeI sites (see Fig. 1). Cells were transformed with this construction and RIs digested with AlwNI prior to analysis. The corresponding autoradiogram is shown in Figure 8a. Transcription of the gene coding for tetracycline resistance is responsible for the severe knotting observed in pBR322 (29,30). YRp7′-ΔTet was constructed by deleting the DNA fragment between the ClaI and StyI sites (see Fig. 1). As before, cells were transformed with YRp7′-ΔTet and RIs were digested with AlwNI prior to analysis. The corresponding autoradiogram is shown in Figure 8b. In a third attempt to change the DNA sequence in the south hemisphere of YRp7′, we replaced the whole ClaI–NdeI fragment of the plasmid with a 2.2 kb SalI fragment from human ribosomal DNA. The new plasmid was named YRp7′-rDNA. As in the two previous cases, cells were transformed with this construction and RIs were digested with AlwNI prior to analyses. The corresponding autoradiogram is shown in Figure 8c. As clearly noted in Figures 8a–c, none of these changes of DNA sequence in the south hemisphere of the plasmid were able to make both forks meet at a specific site. In other words, in all three cases, despite some minor variations, the patterns obtained disagreed with the predictions made by the computer program assuming that both forks depart from the origin at the same time and move at the same rate. Since randomness for termination persisted regardless of DNA sequence along the south hemisphere, we thought delayed departure of the clockwise replication fork in addition to differences in the rate of fork progression could explain the results obtained.
Figure 8.
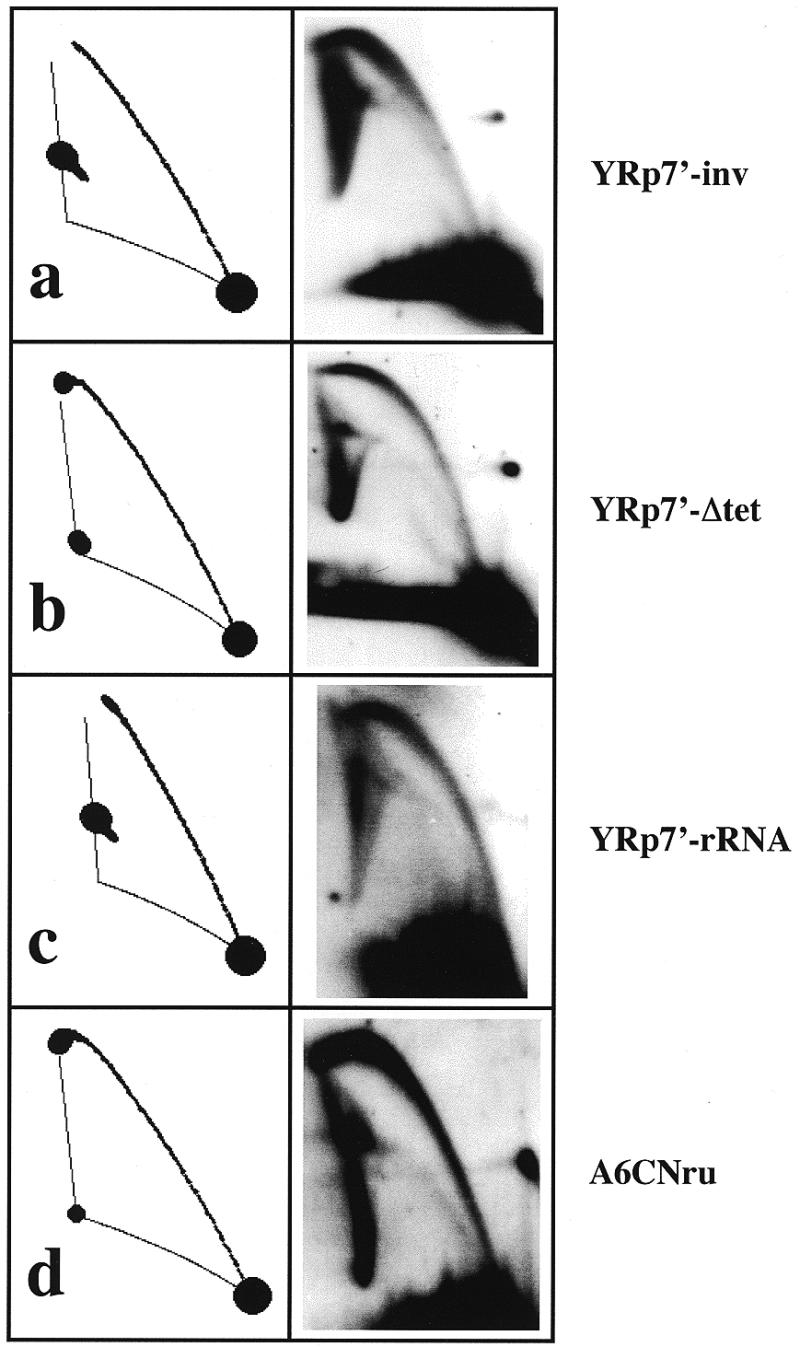
2D gel patterns expected and observed for the RIs of different plasmids isolated from S.cerevisiae. All the expected patterns were calculated by the computer program developed by Viguera et al. (26) assuming that both forks depart from the origin simultaneously and move at the same rate. The blots corresponding to YRp7′-inv, YRp7′-Δtet and YRp7′-rRNA were hybridized with pBR322 DNA whereas A6CNru was hybridized with its DNA used as probe.
Random termination of DNA replication is not restricted to ARS1-bearing plasmids
To test if the peculiar replication mode of YRp7′ in S.cerevisiae was due to the ARS1 replication origin of this plasmid, we investigated another plasmid, A6CNru. This plasmid is a derivative of YIp5, containing ARS305 from chromosome III of S.cerevisiae (31). Cells were transformed with this plasmid and RIs were digested with PvuII prior to analysis by 2D agarose gel electrophoresis. PvuII cuts A6CNru only once ~180° from the replication origin. The corresponding autoradiogram is shown in Figure 8d. Once again, the pattern obtained differed significantly from that predicted by the computer program assuming that both forks depart from the origin synchronously and move at the same rate. This observation indicated that random termination was not restricted to YRp7′ but was common to other yeast plasmids bearing different origins.
DISCUSSION
The 2D gel patterns obtained for YRp7′ replicated in E.coli (Fig. 2) indicated that in this system initiation and termination of DNA replication occurred at a specific site, the ColE1 origin. Also, they showed that replication forks proceeded in a uni-directional mode. On the other hand, when YRp7′ replicated in Xenopus extracts, the 2D gel patterns obtained implied random initiation and termination of DNA replication (Fig. 4). The triangular smear observed to the left of the simple-Y pattern and the ‘cobra-like’ shape of the bubble arc denoted heterogeneity of the population of RIs and were clear indications of a different replication mode. In these two systems, the patterns obtained were in full agreement with the predictions made by the computer model and the literature.
In S.cerevisiae, however, the 2D gel patterns obtained did not agree with the predictions made by the computer model assuming that both forks depart from the origin at the same time and move at the same rate. In this system, it has been firmly established that initiation of DNA replication occurs at the ARS1 replication origin (2,17,18). Therefore, the most likely source of this heterogeneity of RIs was the rate of fork progression. In order to test if DNA sequences in the south hemisphere of YRp7′ were responsible for changes in the rate of fork progression throughout this region of the plasmid, DNA sequences of this south hemisphere were deleted, inverted or replaced with other foreign sequences. None of these changes caused replication forks to meet at a specific site 180° opposite ARS1 (see Fig. 8a–c). Therefore, we concluded that the source of the heterogeneity could well be in the origin itself. However, the 2D gel pattern of another plasmid, bearing a different origin (ARS305), revealed the same heterogeneity of RIs as found in YRp7′ (see Fig. 8d), indicating that this peculiar behaviour was not exclusive to ARS1. Double-Y signals indicative of specific termination have been observed for the S.cerevisiae 2 µm plasmid (2) as well as for a derivative of YRp7′ (32). It should be noted, however, that in order to reveal random termination, several fragments must be analysed, as RI heterogeneity is better detected in some but not all the fragments of a plasmid (compare the autoradiograms shown in Figs 3c and 6c).
Asymmetrical progression of replication forks has been reported before. In E.coli oriC plasmids, replication forks do not progress at the same rate and, in some extreme cases, replication of these plasmids follows a uni-directional mode (33–35). A similar observation was made in Bacillus subtilis (36). Neutral–neutral and neutral–alkaline 2D gels revealed asymmetrical progression of replication forks at very early stages also in the chromosome of Mycoplasma capricolum (37). This phenomenon is not restricted to prokaryotes. The same observation was made for eukaryotic cells. In SV40, electron microscopy and 2D gels revealed that replication forks could meet at many different sites that were not necessarily located 180° opposite the origin (38–40). The same situation was observed in vitro, where up to 25% of the molecules studied terminated DNA replication at a different site (41). Tack and Proctor (42) made a detailed characterization of the asymmetry of fork progression during early and late replication in SV40. They concluded that although differences in the rate of fork progression could explain the deviation for late RIs, in the case of early RIs this asymmetry seems to rely on asynchronous departure of the replication forks from the origin itself. A very similar observation was made for polyoma virus (43). In bovine papillomavirus replicating in mouse transformed cells (6) as well as in human papillomavirus type 11 replicating in laryngeal papillomas (44), 2D agarose gel electrophoresis revealed a triangular smear in the region opposite the bi-directional origin. As previously mentioned, this pattern has been interpreted as an indication of random termination of DNA replication. The same observation was made for plasmids replicating in Schizosaccharomyces pombe (45). Finally, asymmetrical progression of replication forks has also been reported in the case of S.cerevisiae. In vitro studies showed that ARS1-bearing plasmids initiate DNA replication specifically at the origin and replication progresses bi-directionally. Progression of the replication forks, however, is not synchronous and the fact that asymmetrical molecules are detected very early after initiation suggests that the two forks rarely depart at the same time (46). 2D gels also revealed that in the 2 µm plasmid (2,40) as well as in the chromosome (8), termination events could occur over a broad zone.
Significant progress has been made lately in our understanding of the initiation process of DNA replication in yeast. The origin recognition complex (ORC) specifically binds to ARS, the yeast replicators (47). The ORC binds to origin sequences throughout the cell cycle, resulting in a characteristic DNase I footprint that undergoes G1-specific changes (48). These results suggest that ORC-specific recognition of replication origins leads to the formation of a post-replicative complex that functions as a landing pad for the late mitotic recruitment of additional proteins. In turn, these changes result in the constitution of a pre-replicative complex (pre-RC) that persists during G1 and is essential, but not sufficient, for origin firing (49).
The functional DNA elements of yeast origins are arranged asymmetrically and this asymmetry is correlated not only with the distribution of the six ORC subunits along the origin, but also with the higher order complexes whose assembly depends on the ORC. However, it is still unknown whether this asymmetry is translated into the assembly of two symmetrical replication forks (50). Finding a satisfactory answer to this question has been hampered largely by a lack of knowledge of the pre-RC stoichiometry. What remains elusive is not only the exact composition of the complex but also the role of most of its known components (51), making it difficult to determine how the replication forks are actually assembled. In this respect, Bielinsky and Gerbi (18) recently found subtle differences during the initiation process at ARS1, depending on whether the origin is chromosomal or episomal. Whereas in the chromosome initiation is confined to only 2 bp, in the episomal counterpart it spans a much broader zone. This observation suggests that initiation of DNA replication, at least in plasmids, might follow an asymmetrical model, as previously proposed for SV40 (52) and polyoma virus (53). According to this model, initiation of DNA synthesis would begin at only one of the strands. Then the replication machinery would proceed until it encounters the leading strand initiation site on the other strand, at which point a second fork would be assembled. Temporal differences during the assembly of the second replisome would cause asynchronous departure of the two replication forks. Variations in the degree of asynchrony within the population would explain the asymmetry of early RIs observed in different systems (37,42,43,46) as well as the randomness of termination events described in this and other reports for bi-directional replication.
In summary, the 2D gel patterns observed reflected the replication mode of YRp7′ in E.coli, S.cerevisiae and Xenopus extracts. In S.cerevisiae, detection of a triangular smear and a bubble arc with a characteristic ‘cobra-like’ shape indicated heterogeneity of the population of RIs. This heterogeneity has often been interpreted as an indication of random initiation of DNA replication (5–14). It was clearly shown, however, that initiation of DNA replication in ARS1-bearing plasmids occurs specifically close to the B1 element of ARS1 (17,18). We propose that the random termination events observed in S.cerevisiae could be due to asynchronous departure of the two forks from the bi-directional origin in addition to differences in the rate of fork progression. These observations could be extended to all bi-directional origins.
Acknowledgments
ACKNOWLEDGEMENTS
We are grateful to Marcel Mechali who encouraged us to establish an international cooperation, to Pilar Robles for technical assistance and to Leticia Olavarrieta and Alicia Sánchez-Gorostiaga for critical reading of the manuscript. This work was partially supported by grants 93/0161, 96/0470 and 99/0850 from the Spanish Fondo de Investigación Sanitaria, grant 08.6/0016/1997 from the Comunidad Autónoma de Madrid and grant PM97-0138 from the Spanish Comisión Interministerial de Ciencia y Tecnología (CICYT).
REFERENCES
- 1.LaDuca R., Fay,P., Chuang,C., McHenry,C. and Bambara,R. (1983) Biochemistry, 22, 5177–5188. [DOI] [PubMed] [Google Scholar]
- 2.Brewer B.J. and Fangman,W.L. (1987) Cell, 51, 463–471. [DOI] [PubMed] [Google Scholar]
- 3.Martín-Parras L., Hernández,P., Martínez-Robles,M.L. and Schvartzman,J.B. (1991) J. Mol. Biol., 220, 843–853. [DOI] [PubMed] [Google Scholar]
- 4.Santamaría D., delaCueva,G., Martínez-Robles,M.L., Krimer,D.B., Hernández,P. and Schvartzman,J.B. (1998) J. Biol. Chem., 273, 33386–33396. [DOI] [PubMed] [Google Scholar]
- 5.Vaughn J.P., Dijkwel,P.A. and Hamlin,J.L. (1990) Cell, 61, 1075–1087. [DOI] [PubMed] [Google Scholar]
- 6.Schvartzman J.B., Adolph,S., Martín-Parras,L. and Schildkraut,C.L. (1990) Mol. Cell. Biol., 10, 3078–3086. [DOI] [PMC free article] [PubMed] [Google Scholar]
- 7.Krysan P.J. and Calos,M.P. (1991) Mol. Cell. Biol., 11, 1464–1472. [DOI] [PMC free article] [PubMed] [Google Scholar]
- 8.Zhu J., Newlon,C.S. and Huberman,J.A. (1992) Mol. Cell. Biol., 12, 4733–4741. [DOI] [PMC free article] [PubMed] [Google Scholar]
- 9.Hyrien O. and Mechali,M. (1992) Nucleic Acids Res., 20, 1463–1469. [DOI] [PMC free article] [PubMed] [Google Scholar]
- 10.Mahbubani H.M., Paull,T., Elder,J.K. and Blow,J.J. (1992) Nucleic Acids Res., 20, 1457–1462. [DOI] [PMC free article] [PubMed] [Google Scholar]
- 11.Hyrien O. and Mechali,M. (1993) EMBO J., 12, 4511–4520. [DOI] [PMC free article] [PubMed] [Google Scholar]
- 12.Little R.D., Platt,T.H.K. and Schildkraut,C.L. (1993) Mol. Cell. Biol., 13, 6600–6613. [DOI] [PMC free article] [PubMed] [Google Scholar]
- 13.Dijkwel P.A. and Hamlin,J.L. (1997) Methods, 13, 235–245. [DOI] [PubMed] [Google Scholar]
- 14.Duncker B.P., Pasero,P., Braguglia,D., Heun,P., Weinreich,M. and Gasser,S.M. (1999) Mol. Cell. Biol., 19, 1226–1241. [DOI] [PMC free article] [PubMed] [Google Scholar]
- 15.Tomizawa J., Sakakibara,Y. and Kakefuda,T. (1974) Proc. Natl Acad. Sci. USA, 71, 2260–2264. [DOI] [PMC free article] [PubMed] [Google Scholar]
- 16.Martín-Parras L., Hernández,P., Martínez-Robles,M.L. and Schvartzman,J.B. (1992) J. Biol. Chem., 267, 22496–22505. [PubMed] [Google Scholar]
- 17.Bielinsky A. and Gerbi,S. (1998) Science, 279, 95–98. [DOI] [PubMed] [Google Scholar]
- 18.Bielinsky A.K. and Gerbi,S.A. (1999) Mol. Cell, 3, 477–486. [DOI] [PubMed] [Google Scholar]
- 19.Harland R.M. and Laskey,L.A. (1980) Cell, 21, 761–771. [DOI] [PubMed] [Google Scholar]
- 20.Sherman F., Fink,G.R. and Hicks,J.B. (1986) Methods in Yeast Genetics. Cold Spring Harbor Laboratory Press, Cold Spring Harbor, NY.
- 21.Huberman J.A., Spotila,L.D., Nawotka,K.A., El-Assouli,S.M. and Davis,L.R. (1987) Cell, 51, 473–481. [DOI] [PubMed] [Google Scholar]
- 22.Blow J.J. and Laskey,R.A. (1986) Cell, 47, 577–587. [DOI] [PubMed] [Google Scholar]
- 23.Martín-Parras L., Lucas,I., Martínez-Robles,M.L., Hernández,P., Krimer,D.B., Hyrien,O. and Schvartzman,J.B. (1998) Nucleic Acids Res., 26, 3424–3432. [DOI] [PMC free article] [PubMed] [Google Scholar]
- 24.Friedman K.L. and Brewer,B.J. (1995) In Campbell,J.L. (ed.), Methods in Enzymology. Academic Press, San Diego, CA, Vol. 262, pp. 613–627. [DOI] [PubMed]
- 25.Viguera E., Hernández,P., Krimer,D.B., Boistov,A.S., Lurz,R., Alonso,J.C. and Schvartzman,J.B. (1996) J. Biol. Chem., 271, 22414–22421. [DOI] [PubMed] [Google Scholar]
- 26.Viguera E., Rodríguez,A., Hernández,P., Krimer,D.B., Trellez,O. and Schvartzman,J.B. (1998) Gene, 217, 41–49. [DOI] [PubMed] [Google Scholar]
- 27.Brun C., Dijkwel,P.A., Little,R.D., Hamlin,J.L., Schildkraut,C.L. and Huberman,J.A. (1995) Chromosoma, 104, 92–102. [DOI] [PubMed] [Google Scholar]
- 28.Schvartzman J.B., Martínez-Robles,M.L. and Hernández,P. (1993) Nucleic Acids Res., 21, 5474–5479. [DOI] [PMC free article] [PubMed] [Google Scholar]
- 29.Shishido K., Komiyama,M. and Ikawa,S. (1987) J. Mol. Biol., 195, 215–218. [DOI] [PubMed] [Google Scholar]
- 30.Shishido K., Ishii,S. and Komiyaba,N. (1989) Nucleic Acids Res., 17, 9749–9759. [DOI] [PMC free article] [PubMed] [Google Scholar]
- 31.Newlon C.S., Lipchitz,L.R., Collins,I., Deshpande,A., Devenish,R.J., Green,R.P., Klein,H.L., Palzkill,T.G., Ren,R., Synn,S. and Woody,S.T. (1991) Genetics, 129, 343–357. [DOI] [PMC free article] [PubMed] [Google Scholar]
- 32.Brewer B.J. and Fangman,W.L. (1994) Proc. Natl Acad. Sci. USA, 91, 3418–3422. [DOI] [PMC free article] [PubMed] [Google Scholar]
- 33.Kaguni J.M. and Kornberg,A. (1984) Cell, 38, 183–190. [DOI] [PubMed] [Google Scholar]
- 34.Yoshimoto M., Nagai,K. and Tamura,G. (1986) Mol. Gen. Genet., 204, 214–220. [DOI] [PubMed] [Google Scholar]
- 35.Yoshimoto M., Kambe-Honjoh,H., Nagai,K. and Tamura,G. (1986) EMBO J., 5, 787–791. [DOI] [PMC free article] [PubMed] [Google Scholar]
- 36.Moriya S. and Ogasawara,N. (1996) Gene, 176, 81–84. [DOI] [PubMed] [Google Scholar]
- 37.Miyata M. and Fukumura,T. (1997) Gene, 193, 39–47. [DOI] [PubMed] [Google Scholar]
- 38.Tapper D.P. and DePamphilis,M.L. (1978) J. Mol. Biol., 120, 401–422. [DOI] [PubMed] [Google Scholar]
- 39.Tapper D.P. and DePamphilis,M.L. (1980) Cell, 22, 97–108. [DOI] [PubMed] [Google Scholar]
- 40.Levac P. and Moss,T. (1996) Chromosoma, 105, 250–260. [DOI] [PubMed] [Google Scholar]
- 41.Li J.J. and Kelly,T.J. (1985) Mol. Cell. Biol., 5, 1238–1246. [DOI] [PMC free article] [PubMed] [Google Scholar]
- 42.Tack L.C. and Proctor,G.N. (1987) J. Biol. Chem., 262, 6339–6349. [PubMed] [Google Scholar]
- 43.Buckler-White A.J., Krauss,M.R., Pigiet,V. and Benbow,R.M. (1982) J. Virol., 43, 885–895. [DOI] [PMC free article] [PubMed] [Google Scholar]
- 44.Auborn K.J., Little,R.D., Platt,T.H.K., Vaccariello,M.A. and Schildkraut,C.L. (1994) Proc. Natl Acad. Sci. USA, 91, 7340–7344. [DOI] [PMC free article] [PubMed] [Google Scholar]
- 45.Caddle M.S. and Calos,M.P. (1994) Mol. Cell. Biol., 14, 1796–1805. [DOI] [PMC free article] [PubMed] [Google Scholar]
- 46.Celniker S. and Campbell,J. (1982) Cell, 31, 201–213. [DOI] [PubMed] [Google Scholar]
- 47.Bell S.P. and Stillman,B. (1992) Nature, 357, 128–134. [DOI] [PubMed] [Google Scholar]
- 48.Diffley J.F.X., Cocker,J.H., Dowell,S.J. and Rowley,A. (1994) Cell, 78, 303–316. [DOI] [PubMed] [Google Scholar]
- 49.Santocanale C. and Diffley,J.F.X. (1996) EMBO J., 15, 6671–6679. [PMC free article] [PubMed] [Google Scholar]
- 50.Lee D.G. and Bell,S.P. (1997) Mol. Cell. Biol., 17, 7159–7168. [DOI] [PMC free article] [PubMed] [Google Scholar]
- 51.Newlon C.S. (1997) Cell, 91, 717–720. [DOI] [PubMed] [Google Scholar]
- 52.Hay R.T. and DePamphilis,M.L. (1982) Cell, 28, 767–779. [DOI] [PubMed] [Google Scholar]
- 53.Hendrickson E.A., Fritze,C.E., Folk,W.R. and DePamphilis,M.L. (1987) EMBO J., 6, 2011–2018. [DOI] [PMC free article] [PubMed] [Google Scholar]