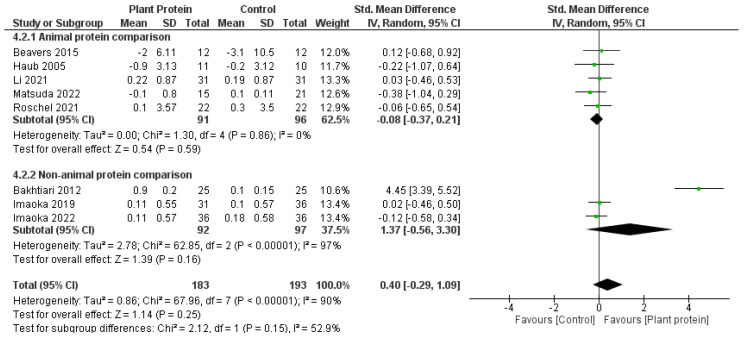
Figure 7.
Forest plot of randomized controlled studies examining the effect of plant protein interventions on lean muscle mass, sub-grouped by protein comparison component. Individual study effect estimates (green boxes) and the pooled effect estimate (diamond) are shown. Values are standardized mean differences with 95% confidence intervals (CI) determined using generic inverse-variance random-effects models. Heterogeneity was quantified by I2 at a significance of p < 0.10 [47,49,50,51,52,53,54,55,56].

