Abstract
Generation of reactive oxygen species (ROS) and activation of a transcriptional program that mimics the hypoxic response have been documented in cultured cells in the presence of cobalt chloride. We found that in the presence of hypoxia-mimicking concentrations of CoCl2, mitochondrial but not nuclear DNA damage is induced in rat neuronal, PC12 cells. To our knowledge, this is the first documentation of induction of mitochondrial DNA (mtDNA) damage under these conditions. Likewise, we provide the first evidence for elevation of MYH, the mammalian homolog of the Escherichia coli MutY DNA glycosylase, in mammalian cells. Recently, the human MYH was implicated in repair of oxidative DNA damage and shown to carry a mitochondrial localization sequence. Here, an induction of mtDNA damage and a time-dependent increase in the MYH level were detected with exposure of cells to 100 µM CoCl2. In addition, the levels of proteins involved in cellular responses to hypoxia, ROS and nuclear DNA damage; hypoxia-inducible factor 1α (HIF-1α), p53, p21 and PCNA were also modulated temporally. Earlier studies suggested that the mtDNA is a primary target for oxidative damage. Our findings extend these observations and suggest that activation of DNA repair processes is associated with the presence of mtDNA damage.
INTRODUCTION
Generation of reactive oxygen species (ROS) during hypoxia as well as in the presence of cobalt chloride has been described (1–4). Interestingly, exposure to CoCl2 triggers transcriptional changes that mimic the hypoxic response, including up-regulation of the hypoxia-inducible factor-1α (HIF-1α), erythropoietin and glycolytic enzymes (3,5,6). One common mechanism that may underlie these changes in gene expression is the increased generation of ROS (2). It was postulated that mitochondria act as O2 sensors and transduce signals by increasing the generation of ROS and thereby activate transcription during hypoxia, and that CoCl2 can mimic this response by increasing the generation of ROS during normoxia (3). Mitochondria, in fact, were shown to generate ROS during hypoxia (7–9) and even during complete anaerobiosis (10). Likewise, the involvement of CoCl2 in the generation of ROS has been well documented (11–13). Moreover, accumulation of excessive ROS at high concentrations of CoCl2 was proposed as a mechanism for formation of single strand breaks in nuclear DNA (14–17).
The objective of our study was to determine whether at a hypoxic response-mimicking concentration of CoCl2 (3,5,6) the integrity of either mitochondrial or nuclear DNA was compromised and the DNA damage response activated in PC12 cells. PC12 is a tumor cell line derived from rat pheochromocytoma used for investigating oxygen sensor mechanisms (18,19) as well as neuronal differentiation (20,21). PC12 cells respond to hypoxia with increased generation of ROS (22) and may generate ROS also in the presence of CoCl2 to induce DNA damage. To determine whether DNA damage is induced in cells treated with CoCl2, we employed two sensitive, quantitative PCR (QPCR) assays. One assay measures the integrity of the mitochondrial genome (23) and the other of nuclear DNA (nDNA). The latter is a novel assay, which utilizes the high copy number of short interspersed DNA elements (SINEs) residing in mammalian genomes (24–27). Using this approach we observed formation of damage in mitochondrial DNA (mtDNA) but no apparent DNA repair. Notably, a time-dependent increase in protein levels of the mammalian homolog of Escherichia coli MutY DNA glycosylase involved in repair of oxidative DNA damage, MYH (28–31), was observed in both nuclear and cytoplasmic extracts. The levels of two other DNA repair enzymes involved in the base excision repair (BER) pathway, namely apurinic/apyrimidinic endonuclease (APE) and DNA polymerase β (pol β) (32–34), however, remained unchanged under these conditions.
In addition, a time- and CoCl2 concentration-dependent modulation in levels of gene products implicated in hypoxic and DNA damage responses, HIF-1α, p53 and p21, was observed. Taken together, our findings show that in PC12 cells, the presence of CoCl2 not only initiates a hypoxia-mimicking response but also induces DNA damage and activates the cellular DNA damage response.
MATERIALS AND METHODS
Cell culture
The PC12 cell line (pheochromocytoma) was purchased from ATCC (Rockville, MD). Cells were grown on standard tissue culture plastic in DMEM with 5% FCS, 5% heat inactivated horse serum and 100 U/ml penicillin and 100 µg/ml streptomycin, and passaged without trypsinization by rinsing with phosphate-buffered saline (PBS), pH 7.4. Cells were seeded (4–5 × 10⁶/10 cm plate) on plates coated with poly-l-lysine (Sigma, St Louis, MO) at 50 µg/ml. A 200 mM stock solution of CoCl2 was prepared fresh before each treatment.
Detection of mtDNA damage
For detection of damage in mtDNA, the QPCR assay was carried out as described previously (23) with some modifications. The primers for amplification of the rat mitochondrial genome (sense: 5′-CCTCCCATTCATTATCGCCGC-CCTTGC-3′ and antisense primer: 5′-GATGGGGCCGGTAGGTCGATAA AGGAG-3′) were designed by Dr B. van Houten. Briefly, PCR was initiated by addition of enzyme during a hot-start at 70°C, 15 ng total DNA was amplified by 27 cycles (15 s at 94°C, 12 min at 68°C), with 0.75 µCi of 3000 Ci/mM [α-32P]dCTP, 350 µM dNTPs, 300 nmol primer and 2.5 U enzyme using the Expand 20 Kb plus PCR System (Boehringer Mannheim, Indianapolis, IN). Amplification products were resolved in native 4% polyacrylamide gels. The incorporated label was quantified and the relative fractions of non-damaged DNA templates and lesion frequencies were calculated assuming random distribution of lesions and using the Poisson equation [f(x) = e–λλ/x!]. Therefore, the average lesion frequency per strand is λ; λ = –lnAD/AC, where AD is amount amplification from damaged and AC from intact control templates (35).
Detection of nDNA damage
High molecular weight DNA was purified from cells using the EasyDNA Kit (Invitrogen, San Diego, CA). The quality of DNA was verified by electrophoresis in agarose gels and ethidium bromide (EtBr) staining. DNA was quantified by EtBr fluorescence with an A4-filter fluorometer (Optical Technology Devices, Elmsford, NY) according to the manufacturer. QPCR for nDNA was carried out using the Expand 20 Kb plus PCR System (Boehringer Mannheim), either with primers spanning the clusterin locus (sense: 5′-AGACGGGTGAGACAGCTGCACCTTTTC-3′ and antisense: 3′-CGAGAGCATCAAGTGCAGGCATTAGAG-3′, designed by Dr B. van Houten) or with primers corresponding to the consensus sequence of the rat SINE, ID (sense: 5′-GGCTGGGGATTTAG-3′ and antisense: 5′-TTCGGAGCTGGGGA-3′) (27,36). Amplification reaction of the clusterin locus was initiated by addition of enzyme during a hot-start at 70°C, 15 ng total DNA was amplified by 25 cycles (15 s at 94°C, 12 min at 67°C), with 0.75 µCi of 3000 Ci/mM [α-32P]dCTP, 350 µM dNTPs, 300 nmol primer and 2.5 U enzyme using the Expand 20 Kb plus PCR System (Boehringer Mannheim). For SINE-mediated PCR a 15 ng total DNA was amplified by eight cycles (10 s at 94°C, 30 s at 52°C, 3 min at 72°C), with 0.75 µCi of 3000 Ci/mM [α-32P]dCTP, 350 µM dNTPs, 300 nmol primer and 2.5 U enzyme. Amplification products were electrophoresed in 7 M urea, 6% polyacrylamide gels. Note that products >1.5 kb are not resolvable under these gel conditions and accumulate as a compressed band in the upper region of the gel. These compressed bands are quantified using the ImageQuant software on a PhosphorImager (Molecular Dynamics, Sunnyvale, CA). Amplification counts obtained with damaged DNA are divided by counts obtained with control templates, to express the relative amount of intact DNA templates present in each reaction.
Determination of linearity ranges for PCR amplifications
Amplification reactions were assembled in duplicates with 7.5, 15, 22.5 and 30 ng DNA purified from PC12 cells. Reactions were assembled exactly as described above except that [α-33P]dCTP was used. Amplification products were resolved on gels and quantified with the ImageQuant software on the PhosphorImager; counts obtained from three separate reactions were averaged (SEM was <5%). Counts obtained with 15 ng template were assigned the value of 100. Quantitation shows that a 50% reduction in template amount (15 to 7.5 ng) results in a 50% reduction in amplification signal. This indicates that under selected PCR conditions, amplification is linearly dependent on template availability. Notably, this is true only within a limited range. For example, a 50% increase in template from 15 to 22.5 ng results in only a 20% increase in amplification of mtDNA (Fig. 1B).
Figure 1.
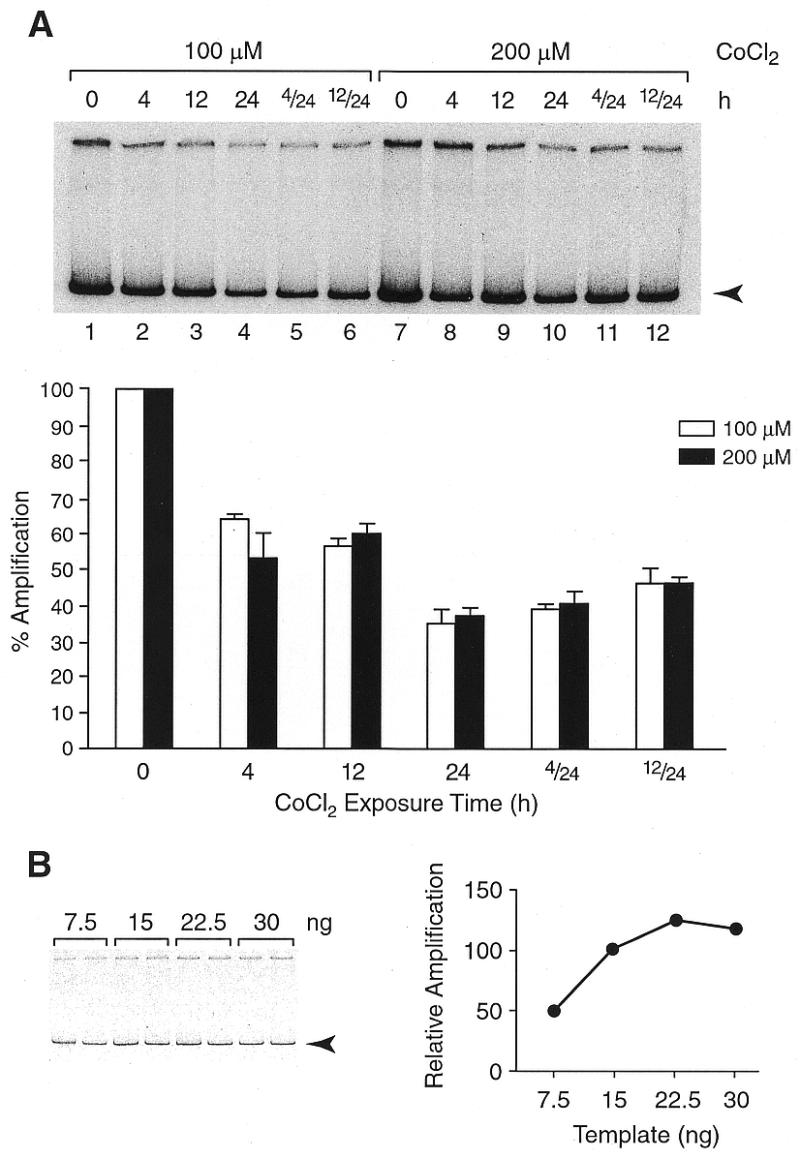
Detection of mtDNA damage induced in the presence of CoCl2. (A) PCR amplification products were resolved in native polyacrylamide gels and visualized by autoradiography. A representative autoradiogram shows a reduction in the 14-kb product (arrowhead) corresponding to the mitochondrial genome. Amplification was with DNA from cells incubated either in the presence of 100 µM (lanes 2–4) or 200 µM (lanes 8–10) CoCl2, or CoCl2 was removed after 4 (4/24, lanes 5 and 11) and 12 h (12/24, lanes 6 and 12) and incubation continued under normal conditions prior to harvesting at 24 h. Label incorporated into individual bands was quantified as integrated volume using a PhosphorImager (Molecular Dynamics) with ImageQuant software. Each DNA sample was analyzed by three PCR reactions. Vertical bars measure relative amplification that is inversely proportional to the extent of DNA damage. (B) Template titration: amplification reactions were assembled in duplicates with 7.5, 15, 22.5 and 30 ng DNA as in (A) except that [α-33P]dCTP was used. A representative autoradiogram is shown. Amplification products were quantified; counts were averaged and plotted as a function of template amount. Counts obtained with 15 ng of template were assigned the value of 100. A 50% reduction in template amount (15 to 7.5 ng) resulted in a 50% reduction in amplification signal.
Preparation of protein extracts
Cells were scraped in PBS, pelleted by low speed centrifugation and then suspended in hypotonic buffer supplemented with a 1.0 mM DTT and protease inhibitors, mixed briefly and incubated on ice for 30 s. 10% IGEPAL CA-630 was added to 1:20 v/v, mixed thoroughly and the suspension was centrifuged for 2 min at 6000 g. The cytoplasmic/supernatant fraction was stored, whereas the nuclei were suspended in high salt buffer (0.4 M NaCl) and incubated for 30 min at 4°C. Extracted nuclei were removed by centrifugation and the supernatant (nuclear extract) aliquoted and stored at –70°C.
Western blotting analysis
Nuclear or cytoplasmic extracts (20 and 40 µg/lane, respectively) were resolved by SDS–PAGE (10%), electrotransferred to PVDF membranes and incubated in Tris-buffered saline (TBS) pH 7.6 containing 0.1% Tween and 10% non-fat milk for 2 h at room temperature. After incubation with the primary antibody, blots were washed in TBS containing 0.1% Tween 1% milk and incubated with a secondary antibody. The blots were then washed four times with same solution. The ECL-Western blotting detection system (Amersham, Piscataway, NJ) was used according to the instructions of the manufacturer. Antibodies detecting p53 #sc-6243, p21 #sc-379-G PCNA #sc-56 were from Santa Cruz (Santa Cruz, CA) and HIF-1α #NB100-105 from Novus-Biologicals (Littleton, CO). Antisera detecting pol β was a gift from Dr S. Wilson and the APE antibody was described previously (37). A synthetic peptide, QEGRQKH-AKNNSQAKPSAC, corresponding to the deduced amino acid residues 33–51 of the cloned human MYH (28), was chemically coupled to keyhole limpet hemocyanin (KLH) and used for raising polyclonal antibody in rabbits.
RESULTS
PC12 cells were incubated with 100 or 200 µM CoCl2 and harvested after 4, 12 or 24 h; or CoCl2 was removed, cells rinsed and further incubated without CoCl2 prior to harvesting at 24 h. Total DNA was isolated and analyzed by QPCR. QPCR with primers that amplify the mitochondrial genome was used to analyze mtDNA (23) whereas conventional (38) and SINE-mediated PCR (24–27) were employed to examine nDNA. A substantial reduction in the 14-kb amplification product corresponding to the mitochondrial genome, was detected with DNA isolated from PC12 cells that were incubated in the presence of CoCl2 (Fig. 1A, lanes 2–4 and 8–10). A decrease of ~35% in amplification signal was observed at 4 h and reached an ~65% decrease after a 24-h incubation. Interestingly, DNA damage persisted and was even slightly intensified after removal of CoCl2 at 4 or 12 h and continued incubation under normal conditions, prior to harvesting at 24 h (compare lanes 2 and 3 with 5 and 6, and lanes 8 and 9 with 11 and 12). The resulting lesion frequencies (35) in mtDNA were calculated as 0.3/10 kb after a 4 h and 0.6/10 kb after a 24 h incubation with 100 µM CoCl2. It is noteworthy that mtDNA was reported previously to be 3–10-fold more sensitive to oxidative damage than nDNA (23,39–42).
To assess the integrity of nDNA, a conventional QPCR assay with primers spanning the single copy clusterin locus as well as the SINE-mediated QPCR were employed. QPCR of the 12-kb clusterin locus did not show a reduction in amplification after incubation of cells at either concentration of CoCl2 (Fig. 2A). In contrast, the SINE-mediated QPCR showed a marginal but reproducible reduction in amplification of DNA isolated after incubation with 200 µM CoCl2 for 24 h (Fig. 2B, lane 10) but not 4 or 12 h. Since substantial mtDNA damage was detected already after a 4-h incubation at either concentration of CoCl2, it was important to determine whether the DNA damage response was activated under these conditions. We therefore monitored cellular levels of three enzymes involved in removal of oxidative DNA damage and found that the MYH glycosylase protein level increased in a time-dependent manner (Fig. 3). Interestingly, an increase in the nuclear levels of the MYH protein was observed already after a 4-h incubation at either concentration of CoCl2. A slight increase in the cytoplasmic level of MYH lagged behind and became apparent after a longer, 12-h, incubation period. Neither the nuclear nor cytoplasmic levels of APE and pol β (pol β was undetectable in the cytoplasm, not shown) were changed in the course of incubation with CoCl2 (Fig. 3).
Figure 2.
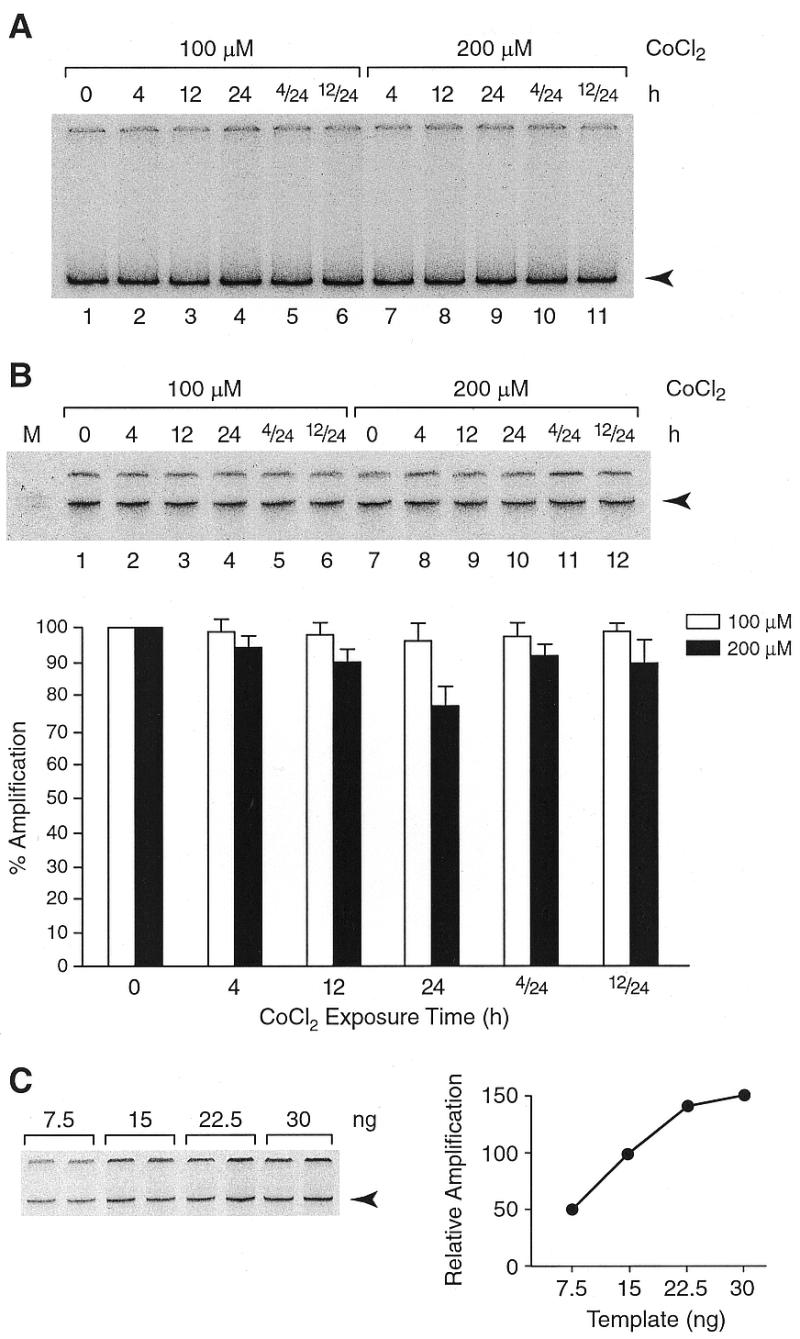
Detection of nDNA damage in the presence of CoCl2. PCR amplification products were resolved in native polyacrylamide gels and visualized by autoradiography. Representative autoradiograms are shown. (A) With primers spanning the single copy, 12-kb, clusterin locus no reduction in amplification products (arrowhead) was observed. (B) With primers complementary to the rat SINE, ID, a measurable reduction in amplification (arrowhead) of DNA isolated after incubation of cells at 200 µM CoCl2 for 24 h but not for 4 or 12 h (lanes 10, 8 and 9, respectively) is observed. Label incorporated into individual bands was quantified as described in Figure 1. Empty and solid bars represent amplification products obtained with 100 and 200 µM CoCl2, respectively. (C) Template titration: amplification reactions were assembled in duplicates with 7.5, 15, 22.5 and 30 ng DNA as in (B), except that [α-33P]dCTP was used. A representative autoradiogram is shown. Amplification products were quantified and plotted as a function of template amount. Counts obtained with 15 ng template were assigned the value of 100. A 50% reduction in template amount (15 to 7.5 ng) resulted in a 50% reduction in amplification.
Figure 3.
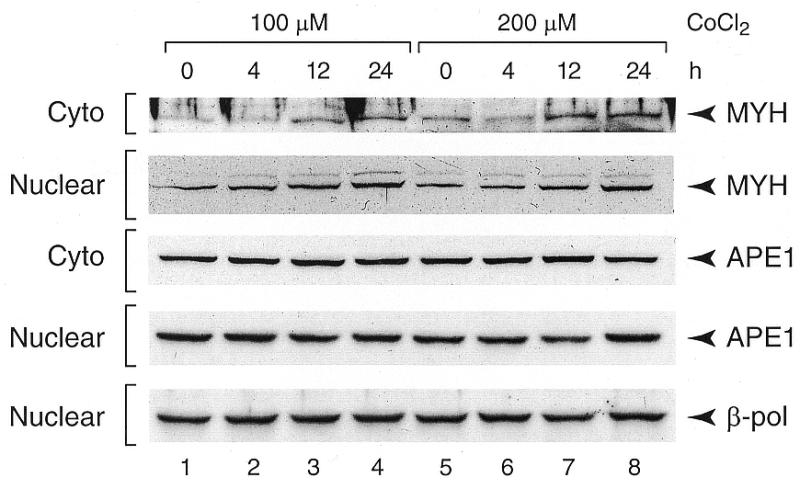
Western blot analyses of DNA repair enzymes in cells treated with CoCl2. Cells were harvested after 4, 12 or 24 h incubation with 100 or 200 µM CoCl2. Nuclear (20 µg/well) or cytoplasmic (40 µg/well) extracts were subjected to SDS–PAGE, blotted onto PVDF membranes and probed with MYH, APE or pol β antisera.
Next, we verified that exposure of PC12 cells to CoCl2 induces a hypoxia-mimicking response, i.e., causes a time- and CoCl2 concentration-dependent elevation in the HIF-1α protein level. An increase in HIF-1α protein level was detected already after a 2-h incubation, the level peaked at 4 h and declined after 12 and 24 h to near control level (Fig. 4A). It is noteworthy that the HIF-1α elevation was more pronounced at the higher concentration of CoCl2. Since post-translational stabilization of the p53 protein has been previously documented in hypoxia (6) and in response to DNA damage (43–45), we also examined the level of p53. After a 4-h exposure to CoCl2, an elevation in p53 level was observed; the p53 protein level peaked at 12 h and declined to an intermediate level after a 24-h exposure (Fig. 4B). The time course was similar for both concentrations of CoCl2 but the increase in p53, like that of HIF-1α, was more pronounced at the higher (200 µM) concentration of CoCl2. The level of p21, whose expression is inducible by p53 as well as by DNA damage (46) and ROS (47), was up-regulated in a fashion similar to that of p53. An increase was observed at 4 h, the highest level at 12 h and an intermediate level at 24 h (Fig. 4B). In addition, a gradual decrease in the level of PCNA was observed in the course of incubation with CoCl2 at either concentration, suggesting a decrease in DNA synthesis and cell cycle arrest (Fig. 4B). Interestingly, after a 24-h exposure to 200 µM CoCl2, PC12 cells developed neurite-like extensions suggestive of differentiation (Fig. 5).
Figure 4.
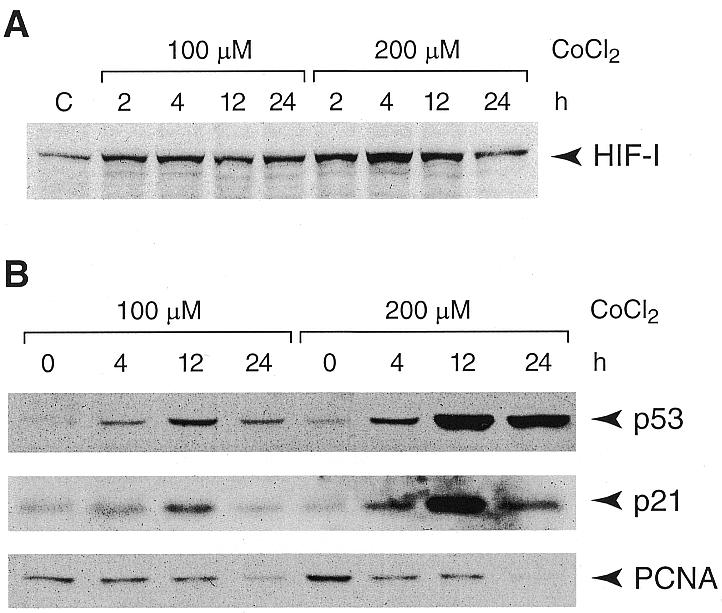
Hypoxia and DNA damage responsive proteins are temporally modulated in CoCl2-treated PC12 cells. Western blot analyses of nuclear extracts from cells incubated with 100 or 200 µM CoCl2: for HIF-1α analysis cells were harvested after 2, 4, 12 or 24 h (A) and for p53, p21 and PCNA after 4, 12 or 24 h (B).
Figure 5.
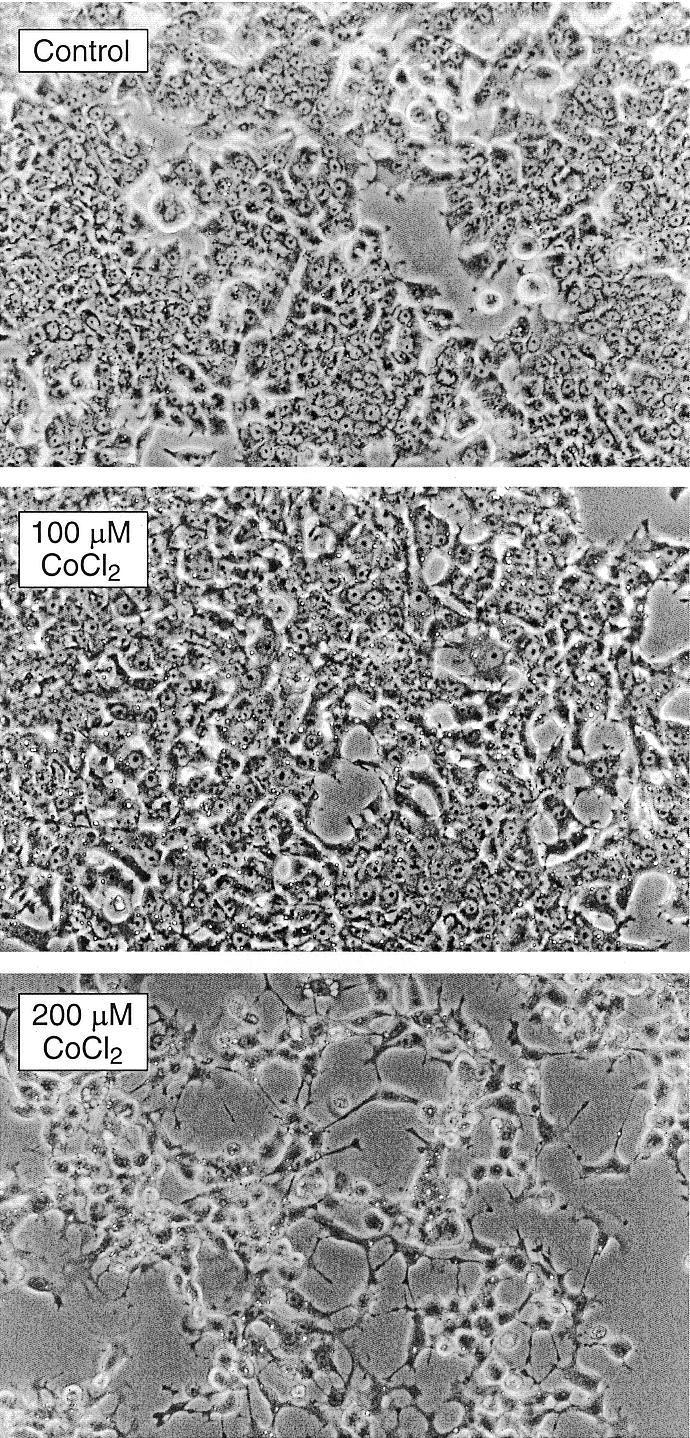
PC12 cells develop neurite-like extensions following treatment with 200 µM CoCl2. Microphotographs (×100) of PC12 cells. Neurite-like extensions were observed after a 24-h incubation with 200 µM but not with 100 µM of CoCl2.
DISCUSSION
The cellular responses induced by hypoxia and hypoxia-mimicking CoCl2 are well documented. Under both conditions, excessive generation of ROS and altered gene expression are observed (1–4,7–13,22). In search for a common mechanism, it was proposed that mitochondria act as O2 sensors and transduce signals by increasing the generation of ROS during hypoxia or in the presence of CoCl2 (2,3). The proposed critical role of mitochondria in this process was further corroborated by demonstrating that cells lacking mitochondria failed to activate HIF-1α during hypoxia plausibly due to their failure to generate mitochondrial ROS (3). Here, our observations are consistent with the described changes in protein levels in hypoxia or in the presence of CoCl2: the rapid increase in HIF-1α level is accompanied by an increase in p53. Induction of p53 in hypoxia was shown to occur primarily by protein stabilization and increased half-life; HIF-1α binds to p53 and protects it from proteosomal degradation (6). In our system, a stronger and more persistent elevation of p53 at 200 µM CoCl2 may reflect an additive effect of hypoxia and DNA damage on stabilization of p53. In fact, it has been shown that in HIF-1α deficient cells, p53 is upregulated in the presence of CoCl2 suggesting an additional mechanism different to the described HIF-1α-mediated stabilization (48). We also observed a marked temporal elevation of p21. In CoCl2 treated cells the increase was time dependent and followed a pattern similar to that of p53 suggesting that, at least at the initial stage, p21 might be induced, in part, independently of p53 and possibly in an additive fashion. A p53-independent induction of p21 has been reported (49). In fact, ROS was shown to induce p21 independently of p53 although the induction was greater when p53 was present (47). In accord with previous reports showing that hypoxia can block the S phase of cell cycle (50), we observed a time-dependent decrease in PCNA level and almost a complete disappearance of PCNA after a 24-h incubation with 200 µM CoCl2. Interestingly, under these conditions PC12 cells appear to differentiate into neuron-like cells with neurite extensions. Similar alterations in PC12 cell morphology were attributed by others to ROS generated in hyperoxia, since in those experiments morphologic alterations were prevented by antioxidants (51). It is plausible that in our system the higher and more persistent levels of HIF-1α, P53 and p21 at 200 µM CoCl2 converge to augment ROS in triggering the differentiation of PC12 cells.
We detected substantial mtDNA damage in cells treated with 100 µM CoCl2, a concentration that mimics the hypoxic response. To determine whether the DNA repair process in PC12 cells is activated under these conditions the levels of three enzymes implicated in the repair of oxidative DNA damage (31–34) were examined. Of particular interest to our study was the MYH, whose mitochondrial as well as nuclear targeting was demonstrated recently in mammalian cells (29,30). We found that cytoplasmic and nuclear levels of MYH were elevated while the levels of APE and pol β remained unchanged. Of note is that although nDNA damage was not detectable with 100 mM CoCl2, an increase in MYH in nuclear extracts was observed already at 4 h. In contrast, mtDNA damage was evident at 4 h whereas an increase in cytoplasmic MYH was detected later on, at the 12-h time point. DNA repair (33,52–55) and mitochondrial targeting of DNA glycosylases (29,30) as well as varying rates of repair in the mitochondria, ranging from fast removal to persistence of lesions were reported recently (53–56). In this context, it is possible that a 12–18-h recovery period monitored here is too short to observe repair of mtDNA damage in PC12 cells. It is also possible that the internalized CoCl2 is not readily removed with rinsing and persists in cells, especially in the mitochondria (57). It is plausible, therefore, that persistence of CoCl2 throughout the duration of the experiment continuously exacerbates damage formation and obscures repair. The lack of a measurable removal of DNA damage despite the apparent induction of MYH, may be also due to the specific activity of MYH. In an in vitro system, the human MYH has been implicated in the removal of adenine incorporated opposite 8-oxoguanine (30), a modification that is not detectable with the QPCR assays utilized in this study.
In summary, in the presence of CoCl2, we detected mtDNA damage as well as alterations in cell morphology that appear consistent with induction by excessive ROS. Marked changes in levels of proteins indicative of cellular responses to hypoxia and to DNA damage were also observed. At this time it is not possible to dissect which changes are exclusively attributable to either hypoxia or to DNA damage. p53 and p21 are inducible by both ROS and nDNA damage. Hypoxia is a potent inducer of p53, p53 is known to be stabilized by HIF-1. Most intriguing, however, is the speculation that in this system, the DNA repair machinery is activated by mtDNA damage alone. Yet the mammalian MYH protein is significantly larger than the E.coli MutY (30) and, therefore, may carry additional activities. Hence, it cannot be ruled out that under stressful conditions, MYH is induced in the absence of DNA damage, possibly by HIF-1α or by p53. The list of genes inducible by p53 or HIF-1 is far from complete. The signaling pathways that mediate induction of MYH in the presence of mtDNA damage can be dissected further, in cell lines lacking functional HIF-1α and p53 proteins.
Acknowledgments
ACKNOWLEDGEMENT
This work was supported by a Shriners Hospitals for Children grant to E.W.E.
REFERENCES
- 1.Guillemin K. and Krasnow,M.A. (1997) Cell, 89, 9–12. [DOI] [PubMed] [Google Scholar]
- 2.Semenza G.L. (1999) Cell, 98, 281–284. [DOI] [PubMed] [Google Scholar]
- 3.Chandel N.S., Maltepe,E., Goldwasser,E., Mathieu,C.E., Simon,M.C. and Schumacker,P.T. (1998) Proc. Natl Acad. Sci. USA, 95, 11715–11720. [DOI] [PMC free article] [PubMed] [Google Scholar]
- 4.Chandel N.S. and Schumacker,P.T. (1999) FEBS Lett., 454, 173–176. [DOI] [PubMed] [Google Scholar]
- 5.Jiang B.H., Zheng,J.Z., Leung,S.W., Roe,R. and Semenza,G.L. (1997) J. Biol. Chem., 272, 19253–19260. [DOI] [PubMed] [Google Scholar]
- 6.An W.G., Kanekal,M., Simon,M.C., Maltepe,E., Blagosklonny,M.V. and Neckers,L.M. (1998) Nature, 392, 405–408. [DOI] [PubMed] [Google Scholar]
- 7.Boveris A., Oshino,N. and Chance,B. (1972) Biochem. J., 128, 617–630. [DOI] [PMC free article] [PubMed] [Google Scholar]
- 8.Turrens J.F., Alexandre,A. and Lehninger,A.L. (1985) Arch. Biochem. Biophys., 237, 408–414. [DOI] [PubMed] [Google Scholar]
- 9.Duranteau J., Chandel,N.S., Kulisz,A., Shao,Z. and Schumacker,P.T. (1998) J. Biol. Chem., 273, 11619–11624. [DOI] [PubMed] [Google Scholar]
- 10.Degli Esposti M. and McLennan,H. (1998) FEBS Lett., 430, 338–342. [DOI] [PubMed] [Google Scholar]
- 11.Nemery B., Lewis,C.P. and Demedts,M. (1994) Sci. Total Environ., 150, 57–64. [DOI] [PubMed] [Google Scholar]
- 12.Lewis C.P., Demedts,M. and Nemery,B. (1991) Am. J. Respir. Cell Mol. Biol., 5, 163–169. [DOI] [PubMed] [Google Scholar]
- 13.Tomaro M.L., Frydman,J. and Frydman,R.B. (1991) Arch. Biochem. Biophys., 286, 610–617. [DOI] [PubMed] [Google Scholar]
- 14.Beyersmann D. and Hartwig,A. (1992) Toxicol. Appl. Pharmacol., 115, 137–145. [DOI] [PubMed] [Google Scholar]
- 15.Hartwig M. and Korner,I.J. (1990) Immunology, 71, 145–147. [PMC free article] [PubMed] [Google Scholar]
- 16.Hartwig A., Snyder,R.D., Schlepegrell,R. and Beyersmann,D. (1991) Mutat. Res., 248, 177–185. [DOI] [PubMed] [Google Scholar]
- 17.Lloyd D.R., Phillips,D.H. and Carmichael,P.L. (1997) Chem. Res. Toxicol., 10, 393–400. [DOI] [PubMed] [Google Scholar]
- 18.Abu Raya S., Trembovler,V., Shohami,E. and Lazarovici,P. (1993) J. Neurosci. Methods, 50, 197–203. [DOI] [PubMed] [Google Scholar]
- 19.Kroll S.L. and Czyzyk-Krzeska,M.F. (1998) Am. J. Physiol., 274, C167–C174. [DOI] [PubMed] [Google Scholar]
- 20.Greene L.A. (1978) J. Cell Biol., 78, 747–755. [DOI] [PMC free article] [PubMed] [Google Scholar]
- 21.Greene L.A. and Tischler,A.S. (1976) Proc. Natl Acad. Sci. USA, 73, 2424–2428. [DOI] [PMC free article] [PubMed] [Google Scholar]
- 22.Hohler B., Lange,B., Holzapfel,B., Goldenberg,A., Hanze,J., Sell,A., Testan,H., Moller,W. and Kummer,W. (1999) FEBS Lett., 457, 53–56. [DOI] [PubMed] [Google Scholar]
- 23.Yakes F.M. and Van Houten,B. (1997) Proc. Natl Acad. Sci. USA, 94, 514–519. [DOI] [PMC free article] [PubMed] [Google Scholar]
- 24.Englander E.W. and Howard,B.H. (1997) Mutat. Res., 385, 31–39. [DOI] [PubMed] [Google Scholar]
- 25.Wang G., Hallberg,L.M. and Englander,E.W. (1999) Mutat. Res., 434, 67–74. [DOI] [PubMed] [Google Scholar]
- 26.Wang G., Hallberg,L.M., Saphier,E. and Englander,E.W. (1999) Mutat. Res., 433, 147–157. [PubMed] [Google Scholar]
- 27.Englander E.W., Greeley,G.H., Wang,G., Perez-Polo,J.R. and Lee,H.M. (1999) J. Neurosci. Res., 58, 262–269. [PubMed] [Google Scholar]
- 28.Slupska M.M., Baikalov,C., Luther,W.M., Chiang,J.H., Wei,Y.F. and Miller,J.H. (1996) J. Bacteriol., 178, 3885–3892. [DOI] [PMC free article] [PubMed] [Google Scholar]
- 29.Takao M., Aburatani,H., Kobayashi,K. and Yasui,A. (1998) Nucleic Acids Res., 26, 2917–2922. [DOI] [PMC free article] [PubMed] [Google Scholar]
- 30.Takao M., Zhang,Q.M., Yonei,S. and Yasui,A. (1999) Nucleic Acids Res., 27, 3638–3644. [DOI] [PMC free article] [PubMed] [Google Scholar]
- 31.Ohtsubo T., Nishioka,K., Imaiso,Y., Iwai,S., Shimokawa,H., Oda,H., Fujiwara,T. and Nakabeppu,Y. (2000) Nucleic Acids Res., 28, 1355–1364. [DOI] [PMC free article] [PubMed] [Google Scholar]
- 32.Mitra S., Hazra,T.K., Roy,R., Ikeda,S., Biswas,T., Lock,J., Boldogh,I. and Izumi,T. (1997) Mol. Cells, 7, 305–312. [PubMed] [Google Scholar]
- 33.Dianov G., Bischoff,C., Piotrowski,J. and Bohr,V.A. (1998) J. Biol. Chem., 273, 33811–33816. [DOI] [PubMed] [Google Scholar]
- 34.Lindahl T. and Wood,R.D. (1999) Science, 286, 1897–1905. [DOI] [PubMed] [Google Scholar]
- 35.Yakes F.M. and van Houten,B. (1997) In Preifer,G.P. (ed.), Technologies for Detection of DNA Damage and Mutations. Plenum Press, New York, NY, pp. 171–183.
- 36.Dieninger P. (1989) In Berg,D.E. and Howe,M.M. (eds), Mobile DNA. American Society for Microbiology, Washington DC, pp. 619–636.
- 37.Izumi T., Malecki,J., Chaudhry,M.A., Weinfeld,M., Hill,J.H., Lee,J.C. and Mitra,S. (1999) J. Mol. Biol., 287, 47–57. [DOI] [PubMed] [Google Scholar]
- 38.Kalinowski D.P., Illenye,S. and Van Houten,B. (1992) Nucleic Acids Res., 20, 3485–3494. [DOI] [PMC free article] [PubMed] [Google Scholar]
- 39.Ames B.N., Shigenaga,M.K. and Hagen,T.M. (1995) Biochim. Biophys. Acta, 1271, 165–170. [DOI] [PubMed] [Google Scholar]
- 40.Croteau D.L. and Bohr,V.A. (1997) J. Biol. Chem., 272, 25409–25412. [DOI] [PubMed] [Google Scholar]
- 41.Croteau D.L., ap Rhys,C.M., Hudson,E.K., Dianov,G.L., Hansford,R.G. and Bohr,V.A. (1997) J. Biol. Chem., 272, 27338–27344. [DOI] [PubMed] [Google Scholar]
- 42.Cullinane C. and Bohr,V.A. (1998) Cancer Res., 58, 1400–1404. [PubMed] [Google Scholar]
- 43.Agarwal M.L., Taylor,W.R., Chernov,M.V., Chernova,O.B. and Stark,G.R. (1998) J. Biol. Chem., 273, 1–4. [DOI] [PubMed] [Google Scholar]
- 44.Chen X., Ko,L.J., Jayaraman,L. and Prives,C. (1996) Genes Dev., 10, 2438–2451. [DOI] [PubMed] [Google Scholar]
- 45.Ko L.J. and Prives,C. (1996) Genes Dev., 10, 1054–1072. [DOI] [PubMed] [Google Scholar]
- 46.Macleod K.F., Sherry,N., Hannon,G., Beach,D., Tokino,T., Kinzler,K., Vogelstein,B. and Jacks,T. (1995) Genes Dev., 9, 935–944. [DOI] [PubMed] [Google Scholar]
- 47.Russo T., Zambrano,N., Esposito,F., Ammendola,R., Cimino,F., Fiscella,M., Jackman,J., O’Connor,P.M., Anderson,C.W. and Appella,E. (1995) J. Biol. Chem., 270, 29386–29391. [DOI] [PubMed] [Google Scholar]
- 48.Wenger R.H., Camenisch,G., Desbaillets,I., Chilov,D. and Gassmann,M. (1998) Cancer Res., 58, 5678–5680. [PubMed] [Google Scholar]
- 49.Sheikh M.S., Chen,Y.Q., Smith,M.L. and Fornace,A.J.,Jr (1997) Oncogene, 14, 1875–1882. [DOI] [PubMed] [Google Scholar]
- 50.Amellem O. and Pettersen,E.O. (1993) Cell Prolif., 26, 25–35. [DOI] [PubMed] [Google Scholar]
- 51.Katoh S., Mitsui,Y., Kitani,K. and Suzuki,T. (1997) Biochem. Biophys. Res. Commun., 241, 347–351. [DOI] [PubMed] [Google Scholar]
- 52.Bohr V., Anson,R.M., Mazur,S. and Dianov,G. (1998) Toxicol. Lett., 102–103, 47–52. [DOI] [PubMed] [Google Scholar]
- 53.Sawyer D.E. and Van Houten,B. (1999) Mutat. Res., 434, 161–176. [DOI] [PubMed] [Google Scholar]
- 54.LeDoux S.P., Driggers,W.J., Hollensworth,B.S. and Wilson,G.L. (1999) Mutat. Res., 434, 149–159. [DOI] [PubMed] [Google Scholar]
- 55.Croteau D.L., Stierum,R.H. and Bohr,V.A. (1999) Mutat. Res., 434, 137–148. [DOI] [PubMed] [Google Scholar]
- 56.Kowaltowski A.J. and Vercesi,A.E. (1999) Free Radic. Biol. Med., 26, 463–471. [DOI] [PubMed] [Google Scholar]
- 57.Porwol T., Ehleben,W., Zierold,K., Fandrey,J. and Acker,H. (1998) Eur. J. Biochem., 256, 16–23. [DOI] [PubMed] [Google Scholar]


