

Abstract
Objective:
Prior studies on the gut microbiome in Parkinson’s disease (PD) have yielded conflicting results, and few studies have focused on prodromal (premotor) PD or used shotgun metagenomic profiling to assess microbial functional potential. We conducted a nested case-control study within two large epidemiological cohorts to examine the role of the gut microbiome in PD.
Methods:
We profiled the fecal metagenomes of 420 participants in the Nurses’ Health Study and the Health Professionals Follow-up Study with recently onset PD (N = 75), with features of prodromal PD (N = 101), controls with constipation (N = 113), and healthy controls (N = 131) to identify microbial taxonomic and functional features associated with PD and features suggestive of prodromal PD. Omnibus and feature-wise analyses identified bacterial species and pathways associated with prodromal and recently onset PD.
Results:
We observed depletion of several strict anaerobes associated with reduced inflammation among participants with PD or features of prodromal PD. A microbiome-based classifier had moderate accuracy (AUC = 0.76 for species and 0.74 for pathways) to discriminate between recently onset PD cases and controls. These taxonomic shifts corresponded with functional shifts indicative of carbohydrate source preference. Similar, but less marked, changes were observed in participants with features of prodromal PD, in both microbial features and functions.
Interpretation:
PD and features of prodromal PD were associated with similar changes in the gut microbiome. These findings suggest that changes in the microbiome could represent novel biomarkers for the earliest phases of PD.
Keywords: Microbiome, Parkinson’s, Prodromal
INTRODUCTION
Parkinson’s disease (PD) is the second most common neurodegenerative disease globally, impacting approximately 1% of the population 65 years and older[1]. Compelling evidence suggests that PD may start outside the central nervous system: in animal models, aggregated αSyn propagated from the intestinal wall along the vagal nerve to the dorsal motor nucleus of the vagus in the brainstem [2–4], demonstrating a retrograde transport from the gut to the brain. αSyn aggregation has been identified in intestinal biopsies from PD patients, and truncal vagotomy has been associated with a reduced risk of PD[5] [6], suggesting a possible gastrointestinal initiation of PD [7]. Over 80% of PD patients suffer from constipation, with onset of gastrointestinal symptoms up to 20 years before the first motor symptoms [1, 8].
The role of the gut microbiome in PD has been explored a growing number of studies[9–29], which have yielded heterogeneous results, likely due to limitations in study design and microbiome sequencing technology. Abundance of some bacterial genera have been somewhat consistently reported to be increased in PD, including Akkermansia[9, 14, 26, 27, 30–32] and Bifidobacterium[10, 13, 15, 18, 22, 26, 31–33] while others were decreased including Prevotella[9, 10, 19, 22, 33], Faecalibacterium[15, 19, 26, 34], Blautia[10, 15, 26, 30] and Roseburia[10, 18, 26, 30, 32]. Increased intestinal permeability and inflammation has also been noted in PD[35, 36]. A recent study in monozygotic twins noted only minor differences in abundance of Bifidobacterium species and bile acid biosynthesis pathways, but was of limited sample size[13]. Earlier studies used 16S rRNA gene amplicon profiling (abbreviated 16S), which in many cases cannot differentiate closely-related taxa (including species). Recently, several metagenomic studies begun to identify species-level taxonomic as well as bacterial pathways in relation to PD[9, 12, 13, 21, 23, 26], with some noting disruption in microbial carbohydrate metabolism [9, 12, 23, 26]. Most of these prior studies used a traditional case-control design prone to selection bias, [9] and while several have examined the microbiome in prodromal PD[14], none have explicitly considered the trend across phenotype groups that include constipated controls and participants with prodromal PD.
Biomarkers that can detect patients during their prodromal phase are highly sought after, since this period can last a decade or more, during which patients experience a range of subtle non-motor symptoms[37–40]. Our group has for the past 10 years rigorously assessed specific prodromal symptoms, including constipation, hyposmia, and probable RBD (pRBD) in two large cohort studies, showing that a combination of these symptoms is likely to be predictive of PD[41, 42]. By using these symptoms, we have identified a unique cohort of individuals with a constellation of features that are common in prodromal PD, from here on denoted as Prodromal Parkinson’s Syndrome (PPS). Here, we sought to newly determine whether gut microbial changes might also accompany these early PPS symptoms, preceding clinical onset of PD. This would both provide additional information for biomarkers of early PD detection, as well as potentially better explaining the causal or responsive role of the gut microbiome during progression toward disease. To thus explore the role of the gut microbiome in PD and PPS, we conducted a large, nested case-control study within these two large cohorts. We included both healthy and constipated controls to account for microbial differences related to constipation and used metagenomic sequencing to profile the microbiome.
METHODS
The study was approved by the institutional review boards at the Brigham and Women’s Hospital and the Harvard T.H. Chan School of Public Health.
Enrollment and Study participants:
The study population was selected among participants in two prospective cohort studies: the Nurses’ Health Study (NHS) and the Health Professionals Follow-up Study (HPFS). The NHS enrolled 121,700 female nurses aged 30–55 at baseline in 1976. The HPFS similarly enrolled 51,529 male health professionals aged 40–75 at baseline in 1986.
Premotor Parkinson’s Syndrome:
The procedures for PPS assessment in the NHS and HPFS have been described previously[41]. Briefly, on the 2012 questionnaire, all NHS and HPFS participants were asked about bowel movement frequency, and those with a frequency of every other day or less or who reported use of laxatives at least twice a week were classified as having constipation. Also on the 2012 questionnaire in both cohorts, we assessed pRBD using a screening question from the Mayo Sleep Questionnaire (“Has your spouse [or sleep partner] told you that you appear to ‘act out your dreams ‘ while sleeping [punched or flailed arms in the air, shouted or screamed], which has occurred at least 3 times?”)[43]. In a prior study, the above question was shown to have 100% sensitivity and 95% specificity for the diagnosis of polysomnography-confirmed RBD[44]. In 2014 (HPFS) and 2015 (NHS), participants were also administered the Brief Smell Identification Test (BSIT)[45], based on which we calculated an olfactory score as the sum of correctly identified odors. Based on prior literature, an olfactory BSIT score less than or equal to 7 was considered as substantial loss of smell. In this study, we classified participants as having Premotor Parkinson’s Syndrome (PPS) if they had all three of a) constipation, b) pRBD, and d) substantial loss of smell.
Recently Onset Parkinson’s Disease:
On biennial study questionnaires, all NHS and HPFS participants were asked to self-report diagnosis of PD, among other disorders. All NHS and HPFS participants self-reporting PD were asked to release medical records, which then underwent review by a study neurologist specializing in movement disorders who rated the certainty of PD diagnosis as ‘clinically confirmed’ or ‘possible,’ we considered only confirmed PD cases in our analyses. Our analyses included PD cases with a date of diagnosis of 2006 or later.
Healthy Controls and Controls with Constipation:
NHS and HPFS participants without diagnosed PD, under 85 years of age, who responded negatively to the 2012 constipation and pRBD questions, and who scored above the BSIT cutoff of 7 on the 2014 (HPFS) and 2015 (NHS) hyposmia were eligible for the study as healthy controls. Similarly, participants meeting the above criteria (no diagnosed PD, no pRBD, no hyposmia), but with a positive response to the 2012 constipation question were eligible for selection as constipated controls. Constipated controls and healthy controls were frequency matched to the PD and PPS participants on age within sex/cohort.
Stool Sample Collection and Storage:
A total of 837 NHS and 880 HPFS participants were selected and invited into the study. The stool collection protocol in our study followed that of the Micro-N study, designed and implemented by the Harvard Chan Microbiome Collection Core (HCMCC), as previously described [46]. Briefly, an invitation letter was mailed to eligible NHS and HPFS participants identified as PPS, PD, Constipated Controls, and Healthy Controls. Participants were asked to review and return a consent form for the stool collection and study. Consenting participants were mailed, via USPS, a package containing a toilet accessory and up to four different specimen collection kits including a) an OMNIgeneGUT tube (OMR-200, DNA Genotek), b) a tube with 95% ethanol preservative, b) a tube with Anaerobe Systems liquid dental transport medium, and d) an OMNIgeneORAL tube (OMR-120, DNA Genotek). Participants were asked to collect a small amount of stool, with the help of the toilet accessory, into the OMNIgeneGUT kit according to provided instructions. Only the material in the OMNIgeneGUT kit was used for the work described in this manuscript. Participants returned their kits through standard pre-paid mail. Upon receipt at the HCMCC, the specimen provided in the OMNIgeneGUT kit was aliquoted into five ~500ul sub-samples, which were then stored in a Hamilton BiOS robotic freezer at −80oC until sequencing.
The collection occurred in two stages: a total of 269 participants provided stool during the first phase of the collection (2019–2020), and 151 provided stool during the 2nd phase of the collection (2020–2021). Shipping and receipt times for all kits were recorded and batch effects were examined, as well as adjusted for in statistical analyses.
Shotgun metagenomic sequencing and profiling:
Shotgun metagenomic sequencing was conducted in two batches, with 269 samples sequenced in the first batch and 151 in the second. We examined differences in overall alpha and beta diversity, as well as in taxonomic and functional composition, according to batch, and batch was included as a covariate in all analyses.
DNA extraction and sequencing from stool aliquots was performed at the Alkek Center for Metagenomics and Microbiome Research (CMMR) at the Baylor College of Medicine. Libraries were constructed and sequenced on the Illumina NovaSeq S4 platform, targeting a minimum of 3 Gnt/sample with paired 150bp length reads. Artificial communities of microbes (MSA-1003[47] and MSA-2002[47]) as positive controls and extraction reagent as negative control were included to quality-control the resulting data and maximize rigor and reproducibility.
Taxonomic and functional profiling was performed on the Harvard Faculty of Arts and Sciences Cannon Research Computing cluster, using the bioBakery, a read-based microbiome bioinformatics analysis suite [48, 49]. The KneadData v0.3 pipeline (http://huttenhower.sph.harvard.edu/kneaddata) [50] was used with default parameters for quality control and removal of host ‘contaminant’ sequences, which incorporates Trimmomatic[51] (filtering) and BMTagger[52] (decontamination). Subsequently, pan-microbial (bacterial, archaeal, viral, and eukaryotic) taxonomic profiles were be determined using MetaPhlAn v3.0 profiler (http://huttenhower.sph.harvard.edu/metaphlan) [53, 54], which identifies taxa to the species level and quantifies their relative abundances. We excluded microbial species with a relative abundance < 10−5 (0.01%) in over 10% of all observations from most subsequent analyses, although to ascertain whether rare species may be associated with PD, we additionally conducted sensitivity analyses without filtering.
HUMAnN v3.0.0.alpha.4 (http://huttenhower.sph.harvard.edu/humann) [55, 56] was used to quantify the relative abundances of microbial pathways from metagenomic data (also using default parameters). HUMAnN inputs short microbial DNA reads and outputs abundance of microbial pathways, providing taxon-specific profiles of UniRef orthologous gene families,[57] MetaCyc,[58] UniPathway,[58] and KEGG pathways[59] to survey microbial community metabolic potential in each metagenome. We again filtered out pathways with a relative abundance <10−5 (0.01%) in over 10% of all observations prior to subsequent analyses.
Assessment of Covariates:
Biennial Cohort Questionnaires:
All NHS and HPFS participants were administered follow-up questionnaires every two years, on which they reported information on lifestyle exposures, medical histories, and anthropometric variables. Covariates in this study were drawn from the biennial NHS and HPFS questionnaires: smoking status, pack-years smoking, and body mass index (BMI: weight in kilograms divided by height in meters squared). Dietary information was drawn from a food frequency questionnaire (FFQ) administered biennially in NHS and HPFS, and included data on alcohol and caffeine intake; the Mediterranean Diet Score based on the FFQ was used as an aggregate measure of diet quality. The 2016 and 2014 HPFS and NHS biennial questionnaires were used for this covariate information, as those were the most recently available questionnaires prior to the collection. For patients with recently onset PD, dates of diagnosis and first symptoms were assessed based on review of medical records by a study neurologist (M.S.).
Supplemental Stool Questionnaire:
At the time of stool collection, participants completed a two-page supplemental stool questionnaire that included questions regarding recent diet, major lifestyle factors, medication (including laxative and stool softener use), medical history, as well as stool consistency and bowel movement pattern. The supplemental questionnaire used in this study was developed for the Micro-N study and has been described in detail and published previously. [46]
Statistical Analysis:
Our dataset contained 519 microbial species after quality control from MetaPhlAn2, and of these 157 were retained after filtering (as detailed above) and used in our statistical analyses. Likewise, of 453 pathways profiled by HUMAnN2, 341 were available for statistical analyses after filtering,
Overall community patterns of microbial variation (omnibus tests):
Alpha Diversity:
We examined overall intra-sample (alpha) microbiome diversity, as a simple summary statistic of microbiome structure, using Shannon and Simpson alpha diversity indexes.
Beta Diversity:
We used the Bray-Curtis dissimilarity metric for all beta-diversity analyses, both of taxonomic composition and functional potential. This included omnibus testing with permutational multivariate analysis of variance (PERMANOVA) of Bray-Curtis dissimilarities to quantify the percent variance explained by phenotype group (PD/PPS/constipated control/healthy control) and study covariates (age, sex, pack years smoking, body mass index, Mediterranean diet adherence, and batch). Beta-diversity relationships were visualized using ordination via Principal Coordinates Analyses (PCoA).
Feature-wise testing:
Data pre-processing prior to feature-wise and classifier analyses:
In preparation for regression (MaAsLin 2) and classification (Random Forest, RF) models, we removed outlying features (taxa and pathways) by applying Tukey’s fences with k = 3 prior to modelling. Additionally, in MaAsLin 2 and RF models, we only considered microbial pathways that were not strongly correlated to any individual species (r < 0.7). The Benjamini-Hochberg false discovery rate (FDR) was used to control type I error, considering FDR p-values <0.20 as statistically significant. Results with the highest level of statistical significance and biological/mechanistic relevance are generally presented in main manuscript figures.
To identify microbial features and functions associated with group (PD/PPS/constipated control/healthy control) membership, we used Multivariate Association with Linear Models version 2 (MaAsLin 2), Version 1.0.0, (https://huttenhower.sph.harvard.edu/maaslin2), [60]) a modified general linear model for feature-wise multivariate testing in microbial community profiles. All models were adjusted for covariates including batch, age, sex, adherence to the Mediterranean Dietary Pattern (Med diet), pack years smoking and Body Mass Index (BMI):
To further examine whether microbiome alterations in PPS resembled those of PD, we fit a series of fully-adjusted MaAsLin 2 models comparing a) participants with PD to healthy controls, and b) participants with PPS to healthy controls, and assessed the β coefficients from these models. We performed an analogous analysis for functional features.
Microbiome-based random forest classifier:
We used a Random Forest (RF) classifier, a microbiome-appropriate discriminative prediction model, as implemented in the scikit-learn package in Python, to generate a microbiome-based biomarker for PD, as well as PPS, vs. controls. The model was fit with cross validation based on 100 random splits (ShuffleSplit in Python) and an 80/20 random split of training and testing folds. The performance of the classifier was quantified by calculating the mean areas under the Receiver Operating Characteristic curve (ROC AUC) over 100 RF iterations. We identified the top 20 microbial features contributing to the classification, via the mean Gini importance (decrease impurity) from the RF model.
A priori species of interest:
Because of the postulated protective role of strict anaerobes associated with reduced inflammation in chronic disease, including PD[9, 30], we calculated the total (sum/summary) relative abundance of several anti-inflammatory species: Eubacterium rectale, Roseburia inulinivorans, Roseburia intestinalis, Eubacterium hallii, Anaerostipes hadrus, and Faecalibacterium prausnitzii [61], in our dataset and compared the overall levels in PD and PPS vs the other groups using the Wilcoxon rank-sum test. We tested for linear trend across phenotype groups by fitting a logistic regression model with the ordinal phenotype groups (healthy, constipation, PPS, PD) in relation to anti-inflammatory species abundance adjusting for sequencing batch, age, pack-years smoking, BMI, and MED diet adherence.
In supplemental analyses, to assess whether our data support previously published fundings regarding the microbiome and PD, we examined the association with PD of several targeted species selected based on association with PD in prior published studies. We focused on species available in our dataset within genera previously associated with PD: Akkermansia[9, 14, 26, 27, 30–32], Bifidobacterium[10, 13, 15, 18, 22, 26, 31–33], Hungatella[62], Lactobacillus[15, 23, 32], Blautia[10, 15, 26, 30], Oscillibacter, Prevotella[9, 10, 19, 22, 33], Eubacterium[9], Roseburia[10, 18, 26, 30, 32], Lachnospira[18, 63], and Faecalibacterium[15, 19, 26, 34],. We used multivariable logistic regression to estimate the OR (95% CI) of PD according to category of abundance of these targeted species. Based on the distribution among the a-priori species considered, species abundance was categorized into tertiles, or binary presence/absence if tertile categorization was not possible due to low abundance. An unconditional logistic regression model was used, adjusted for covariates, to estimate the odds of PD vs. control associated with each category of a-priori species abundance:
Senhhsitivity Analyses:
We conducted sensitivity analyses additionally adjusting for region of the US (Northeast/Midwest/South/West) and whether the sample was collected prior to or after Jan 1, 2020. We also conducted sensitivity analyses with RF models restricted to participants with Bristol Scores between 1 and 3, to examine whether our prediction was robust among participants with harder stool consistency.
The dataset is publicly available at dbGap (phs002193.v1.p1) and the complete results of our analyses are available at https://doi.org/10.7910/DVN/ZOAWNF.
RESULTS
Study design, cohort, and metagenomic profiling:
Stool samples were returned by 82 participants with PD (48% response rate), 114 of participants with PPS (59% response rate), 116 constipated controls (63% response rate), and 133 healthy controls (66% response rate). Collection progress is summarized in Fig 1. We collected and performed metagenomic profiling on stool samples from 420 NHS (N = 194) and HPFS (N = 226) participants. Samples from three participants were sequenced repeatedly during each batch for quality control; the resulting taxonomic profiles were highly correlated (Spearman r > 0.90), and replicates were subsequently analyzed as averages.
Figure 1. Parkinson’s disease gut microbiome study design.

A. STORMS flowchart outlining enrollment, data collection, and B. processing for our study of human gut metagenomes in prodromal and clinical Parkinson’s disease (PD) [86]. Since symptoms of the disease include changes to gastrointestinal transit time, both “healthy” and constipated (non-PD) control populations were also included.
Table 1 outlines the characteristics of the study participants. Because participants were frequency-matched on age, the mean age of participants did not differ substantially across groups. Participants with PD were more likely to be female (due to a higher proportion of kits returned by female NHS participants than male HPFS participants with recently onset PD) and had lower alcohol and caffeine intake. They also had lower pack-years smoking, which is consistent with observations in previous studies[64]. As expected, PD, and to a lesser extent PPS, participants reported harder stool on the Bristol scale compared to healthy controls, and long-term use of fiber supplements, laxatives, and prebiotics/probiotics was elevated in recently diagnosed PD relative to healthy controls. Participants with PD also had slightly lower BMI than healthy or constipated controls.
Table 1.
Characteristics of 420 NHS and HPFS study participants according to phenotype.
| Healthy Controls (N = 131) | Constipation Controls (N=113) | PPS (N= 101) | Recently Diagnosed PD (N= 75) | |
|---|---|---|---|---|
| Age, years | 80.7 (5.5) | 81.1 (5.8) | 80.5 95.5) | 79.5 (5.0) |
| Sex, female (%) | 43.5% | 46.0% | 41.6% | 57.3% |
| Body mass index, kg/m2 | 26.3 (4.9) | 25.5 (4.3) | 26.0 (4.0) | 25.0 (6.1) |
| Med Diet Score | 4.6 (2.1) | 4.4 (1.9) | 4.0 (2.0) | 4.6 (2.1) |
| Alcohol intake, g/day | 10.6 (11.8) | 9.7 (11.3) | 11.3 (15.1) | 7.5 (9.0) |
| Caffeine intake, g/day | 154.1 (115.0) | 157.0 (121.3) | 151.8 (122.2) | 132.0 (94.7) |
| Pack years smoking | 7.7 (13.8) | 8.8 (13.3) | 9.3 (15.6) | 4.6 (10.1) |
| Year First PD Symptoms (median) | 2010 | |||
| Year PD Diagnosis (median) | 2012 | |||
| Antibiotic use in last 1–6 months, % | 12.7% | 22.5% | 18.3% | 17.4% |
| Bristol score: | ||||
| 1–2, hard stool | 10.2% | 16.7% | 23.7% | 34.8% |
| 3–5 normal stool | 76.3% | 69.6% | 62.4% | 56.5% |
| 6–7 loose stool | 13.6% | 13.7% | 12.9% | 5.8% |
| Fiber supplement use | ||||
| % more than 1/day in last week | 8.5% | 23.5% | 21.5% | 8.7% |
| Laxative use | ||||
| % more than 1/day in last week | 0.0% | 6.9% | 12.9% | 8.7% |
| Stool softener use | ||||
| % more than 1/day in last week | 1.7% | 13.7% | 12.9% | 14.5% |
| Prebiotic use | ||||
| Long term: % more than 1/day | 3.4% | 1.0% | 1.1% | 0.0% |
| Probiotic use | ||||
| % more than 1/day in last week | 12.7% | 11.8% | 9.7%% | 10.1% |
Values are presented as means (SD) for continuous variables, proportion (%) for categorical variables, and median for dates (PD diagnosis and first symptoms).
Collection/batch (1st vs. 2nd) explained 0.34% (p= 0.08) and 0.24% (p = 0.35) in overall taxonomic and functional variation in the gut microbiome (based on Bray Curtis dissimilarity, Fig 2A). Therefore, all subsequent analyses are presented combining the two collections with a total sample size of 420 samples.
Figure 2. PD is minimally associated with overall microbiome structure.

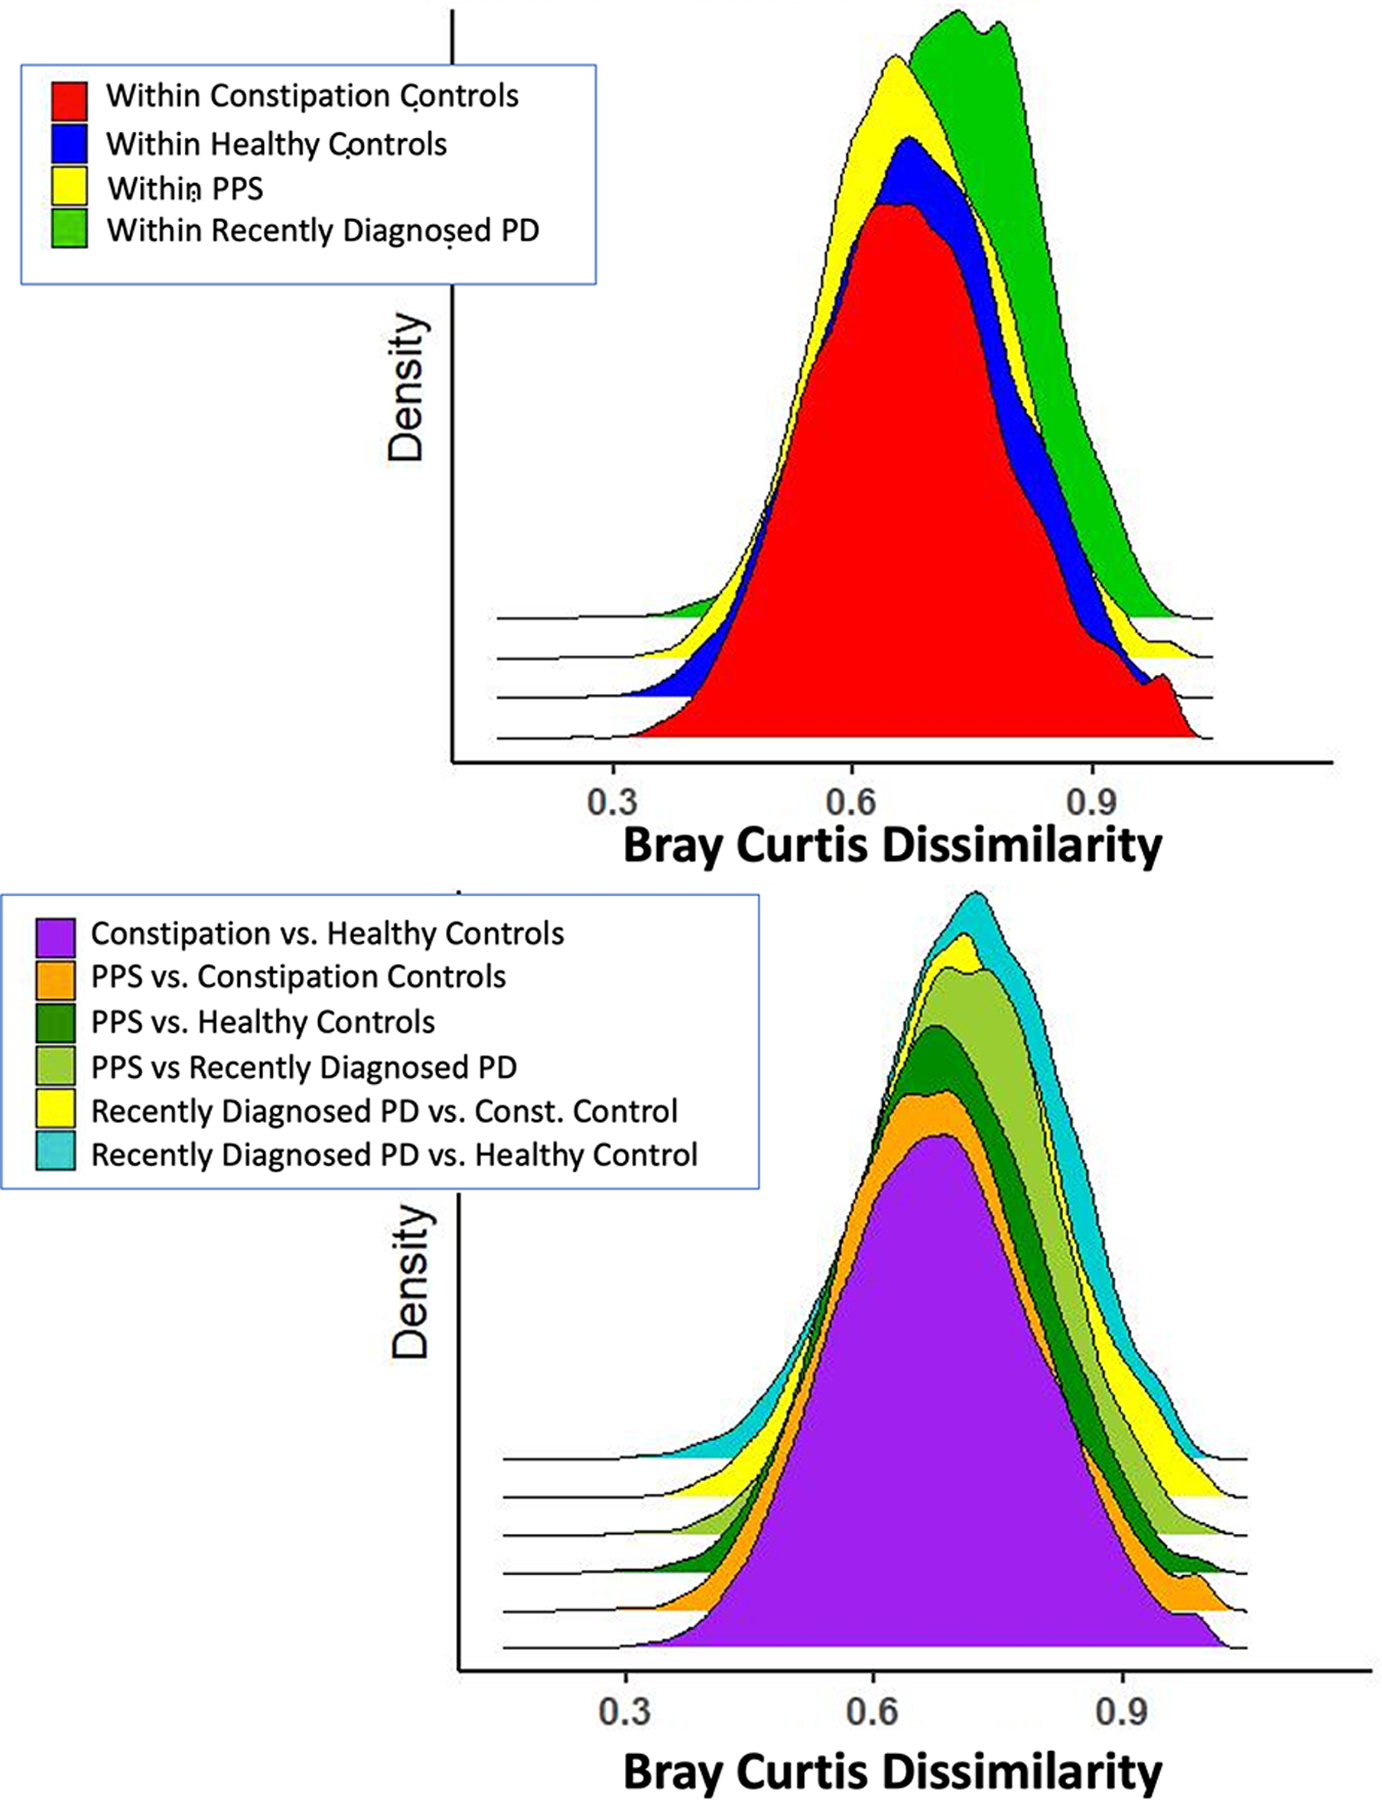
A. Univariate R2 (Bray-Curtis PERMANOVA) explained by key covariates, with corresponding PCoA ordination overlaid with phenotype group (PD/PPS/Constipated Controls/Healthy Controls). PERMANOVA shows nominal p-values. B. Distributions of taxonomic Bray-Curtis dissimilarities by phenotype group. Plot shows distribution of Bray-Curtis dissimilarities within group (eg within Recently Diagnosed PD, within PPS, etc. as well as between groups (dissimilarities between Constipation and Health Controls, etc). Colors represent the group plotted, as indicated on legend.
Overall patterns of microbial community variation in PD and PPS:
Shannon and Simpson alpha diversity indexes were similar across disease groups (data not presented). Applying univariate PERMANOVA of Bray-Curtis dissimilarities, we observed that age, smoking, MED diet, sex, caffeine intake, BMI, and alcohol intake all explained relatively small amounts of variation in gut microbiome taxonomic composition (Fig. 2A, Taxa) and functional potential (Fig. 2A, Pathways). Outcome group (PD/PPS/Constipated/Healthy) also explained a small amount of variation in both taxonomic (R2 = 1.55%; p = 0.001) and functional composition (R2 = 1.54%; p = 0.017), but this was both statistically significant and larger than variance from other covariates. In complementary analyses, we examined the within- and between-group differences in taxonomic Bray-Curtis dissimilarity comparing healthy controls, constipated controls, PPS, and PD. Overall, we observed a) more variability in the PD population and b) a small gradient of dysbiosis from health through PPS to PD (Fig. 2B). Results were similar when considering Bray-Curtis dissimilarity based on functional profiles (data not presented).
Individual species and functions are similarly associated with recently onset PD and PPS:
Subsequently, we identified individual microbial species, associated with group (PD/PPS/Constipated/Healthy) membership in our study using feature-wise microbiome-specific multivariate linear modeling in MaAsLin 2 [65]. In feature-wise models adjusted for sequencing batch, age, pack-years smoking, BMI, and MED diet adherence, we observed significantly reduced abundance of several bacterial species, including Roseburia faecis, Eubacterium rectale, and E. ramulus (known for flavonoid degradation[66], as well as Oscillibacter_sp_57_20, Bacteroides xylanisolvens, and E. siraeum in PD samples compared to healthy controls (Fig. 3A). Furthermore, in the majority of analyses, the abundance of these species followed a trend, progressing from healthy controls to constipation controls, to PPS, to PD (Fig. 3A). Similarly, we observed increased abundance of Bifidobacterium dentium and B. longum, which is consistent with prior reports of increased Bifidobacteria in PD [10, 13, 15, 18, 22, 26, 31–33], Our report of higher abundance E. tayi, C. leptum and R. lactatiformans in our recently onset PD samples compared to healthy controls is also consistent with published metagenomics work on PD[26]. Abundance of these species also increased gradually from healthy controls to constipated control, PPS, and recently onset PD (Fig. 3A).
Figure 3. Individual taxa significantly associated with PD phenotypes.

The most significantly enriched and depleted taxa and pathways associated with phenotype group identified via feature-wise analyses (MaAsLin 2), These generally exhibit a gradient across the phenotype groups. All analyses consider healthy controls as the reference group, and all p-values are presented with FDR correction.
Microbial pathways in PD and PPS:
MaAsLin 2 identified 36 microbial pathways significantly depleted in PD, including several involved in microbial carbohydrate utilization (glucose, hexose, and other sugar and polysaccharide metabolism; Fig. 3B). Akin to the taxonomic analyses described above, this depletion followed a trend with, primarily, decreasing abundance across our study groups, from healthy controls to constipation controls, PPS, and PD. Starch and tetrapyrrole biosynthesis pathways were elevated in PD compared to controls (Fig. 3B), also with a gradient across study groups.
The PPS microbiome lies on a taxonomic and functional continuum between healthy controls and PD:
When comparing key microbiome alterations observed in PPS, we observed that species over- or under- represented in PD relative to healthy controls were similarly related to PPS (Fig. 4A). When plotted against each other, βPD and βPPS exhibited a linear relationship, indicating that taxa are similarly related to both PD and PPS. An even stronger linear relationship between βPD and βPPS was observed for metagenomic pathways (Fig. 4B). Spearman correlations between βPD βPPS were 0.44 (p = 1.2*10−8) and 0.65 (p = 2.2*10−16) for species and pathways, respectively.
Figure 4. The PPS microbiome lies on a taxonomic and functional continuum between healthy controls and PD.
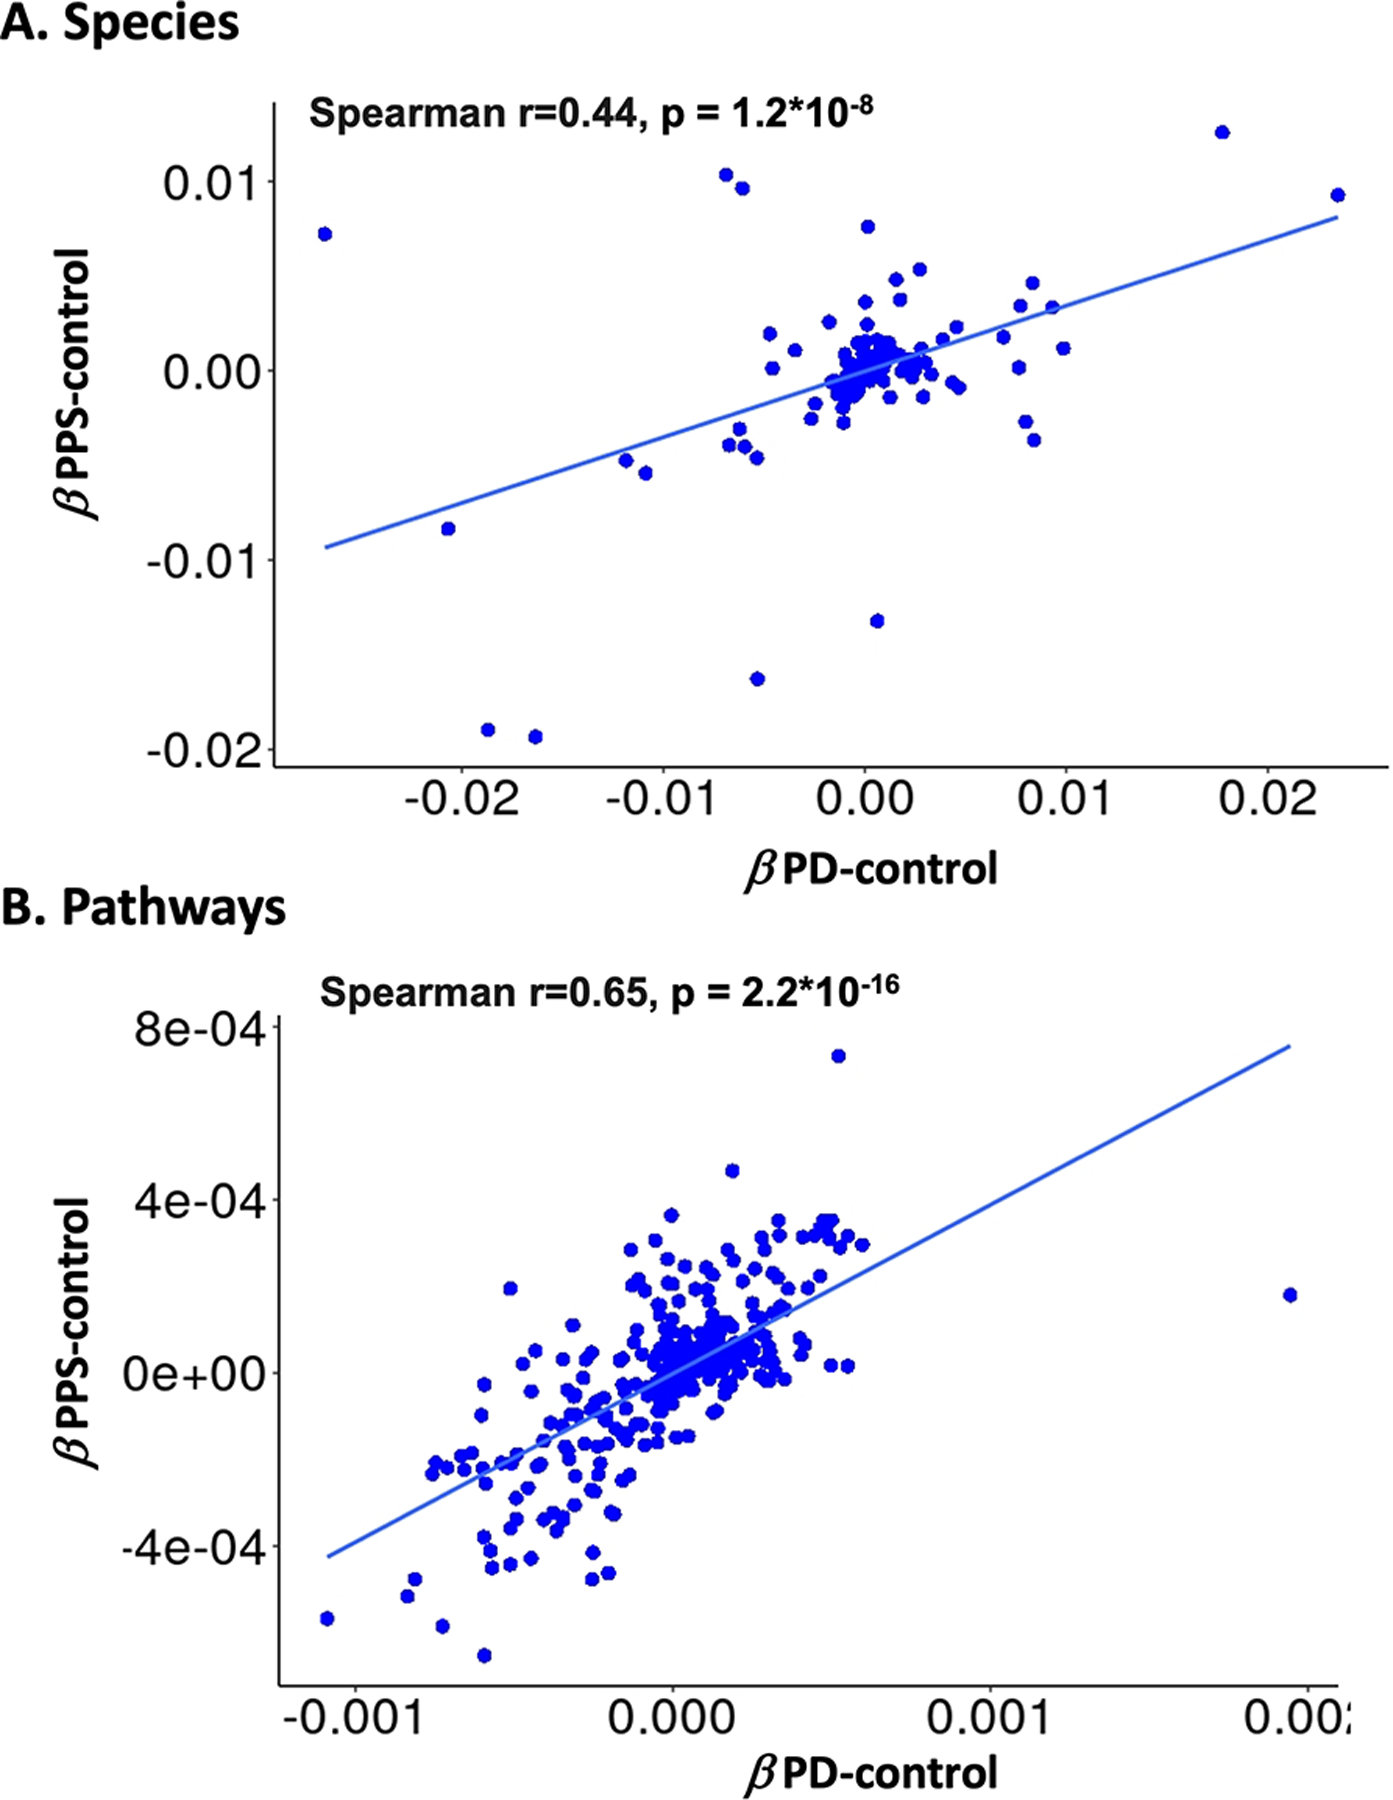
A. Taxa and B. pathways are similarly related to PD and PPS, as identified by beta coefficients from feature-wise analyses (MaAsLin 2). X axis indicates coefficients from PD vs. control comparison, Y axis PPS vs. control. Multivariate models were adjusted for batch, age, sex, adherence to the Mediterranean Dietary Pattern (Med diet), pack years smoking and Body Mass Index (BMI).
Discriminative classification of PPS/PD using microbiome profiles:
A Random Forest (RF) classifier based on bacterial taxa discriminated between PD and healthy control participants with a mean ROC of 0.76 (+/−0.08) over 100 folds. An analogous RF classifier based on bacterial pathways had a comparable ROC of 0.74 (+/−0.07). When an RF was used to discriminate PD from constipated instead of healthy controls, (Fig 5) discriminatory power was somewhat attenuated, with a resulting AUC of 0.69 (+/−0.07) for taxa and 0.68 (+/−0.09) for microbial pathways. Finally, the discriminatory power of the RF classifier was also attenuated but was still moderate when comparing PPS to healthy controls (AUC of 0.67 (+/−0.07) for taxa and 0.68 (+/−0.08) for pathways. These results are concordant with a gradient of gut microbial change occurring between health, constipation, PPS, and PD. In sensitivity analyses restricted to participants with Bristol scores of 3 or below, RF classification restricted to participants with Bristol Scores between 1 and 3, remained robust for PD (AUC of 0.70 (+/−0.12) for taxa and 0.71 (+/−0.11) for microbial pathways (Harvard Dataverse: https://doi.org/10.7910/DVN/ZOAWNF).
Figure 5. Overall gut microbial community structure moderately differentiates PD patients.

Receiver operating characteristic (ROC) performance of a random forest (RF) classifier based on microbial taxa and pathways discriminating between phenotype groups. Classification was performed for the (PD vs. control) comparison.
Anti-inflammatory species and PD:
The total abundance of a-priori defined anti-inflammatory species was lower in PD compared to healthy (p = 1.38*10−05) and to constipated controls (p = 0.015) and decreased gradually across study groups, with the highest levels in healthy controls and the lowest in PD (p-trend: 3.28*10−06) (Fig. 6). In a multivariate model adjusting for sequencing batch, age, pack-years smoking, BMI, and MED diet adherence, total abundance of these taxa was associated with decreased odds of PD (OR top vs. bottom tertile: 0.20, 95% CI: 0.09 – 0.46, p-trend 0.000152), and to a lesser extent decreased odds of PPS (OR top vs. bottom tertile: 0.36, 95% CI: 0.18–0.71, p-trend 0.003), vs. healthy controls.
Figure 6. Abundance of strict anaerobes associated with reduced inflammation by study group.

Total (sum) abundance, stratified by phenotype group, of strict anaerobes associated with production of short-chain fatty acids. Sums include abundance of Eubacterium rectale, Roseburia inulinivorans, Roseburia intestinalis, Eubacterium hallii, Anaerostipes hadrus, and Faecalibacterium prausnitzii [61]. P-values (nominal) are reported for pair-wise Wilcoxon tests. We tested for linear trend across phenotype groups by fitting a logistic regression model to ordinal phenotype (healthy, constipation, PPS, PD) in relation to summed species abundance adjusting for sequencing batch, age, pack-years smoking, BMI, and MED diet adherence.
Supplemental Analyses, species previously associated with PD:
In logistic regression models focused on taxa previously associated with PD, we confirmed previously reported associations for abundance of Bifidobacterium dentium (p-trend: 0.0001), and Hungatella hathewyi (p-trend: 0.047) with higher PD risk, as well as between abundance of Eubacterium rectale (p-trend: 0.007), Roseburia faecis (p-trend: 0.001), Roseburia intestinalis (p = 0.0017) and Faecalibacterium prausnitzii (p = 0.004) and lower PD risk (Fig 7).
Figure 7. A-priori targeted species selected based on association with PD in prior published studies.

We focused on species available in our dataset within genera previously associated with PD: Akkermansia[9, 14, 26, 27, 30–32], Bifidobacterium[10, 13, 15, 18, 22, 26, 31–33], Hungatella[62], Lactobacillus[15, 23, 32], Blautia[10, 15, 26, 30], Oscillibacter, Prevotella[9, 10, 19, 22, 33], Eubacterium[9], Roseburia[10, 18, 26, 30, 32], Lachnospira[18, 63], and Faecalibacterium[15, 19, 26, 34]. Based on the distribution among the a-priori species considered, species abundance was categorized into tertiles, or binary presence/absence if tertile categorization was not possible due to low abundance. Plotted are OR and 95% based on logistic regression adjusted for batch, age, sex, adherence to the Mediterranean Dietary Pattern (Med diet), pack years smoking and Body Mass Index (BMI). Based on the distribution among the a-priori species considered, species abundance was categorized into tertiles (top vs. bottom plotted), or binary presence/absence if tertial categorization was not possible due to low abundance.
Sensitivity Analyses:
Results of sensitivity analyses adjusting for region of the US (Northeast/Midwest/South/West) and timing of sample collection relative to the start of the COVID pandemic were similar to our primary results. Taxa and pathways associated with PD were analogous, and the same gradient across phenotypes was observed, with, as without adjustment and the corresponding β coefficients were similar. The Spearman correlation between the MaAsLin2 β coefficients from these models and our primary results (Spearman r= 0.996 p =2.2*10−16 for taxa), suggesting that adjustment for these additional covariates did not play a major role in the microbiome-phenotype association in this study.
DISCUSSION
In this rigorously designed case-control study nested within two large prospective epidemiological cohorts, the Nurses’ Health Study and the Health Professionals Follow-up Study, we observed that the microbiome of participants with prodromal PD lies on a continuum between healthy and PD microbiomes. We identified several common bacterial species and microbial pathways that were differentially abundant in both prodromal and recently onset PD relative to healthy controls. Overall, our results suggest that the microbial shifts in PD precede PD diagnosis, potentially paving the way for prodromal PD biomarkers that include microbiome features.
Some, although not all, microbial alterations observed in our study are consistent with a state of elevated intestinal inflammation in PD[35, 36]. Gastrointestinal disturbance has been recognized as a prodromal feature of PD and is present in up to 80% of patients[67]. Inflammatory gastrointestinal conditions such as the inflammatory bowel diseases (IBD) have been associated with an increased risk of PD in several large cohort studies[68–70], and the use of anti-tumor necrosis factor (anti-TNF) therapy has been associated with reduced PD risk[70]. IBD and PD have been shown to share genetic risk factors, most notably in LRRK2, where the N2081 Crohn’s disease risk allele lies on the same kinase domain as a G2019S, a mutation shown to be the major genetic cause of familiar PD and a contributor to sporadic PD[71].
Further, intestinal inflammation has been shown to lead to onset or worsening of PD-related changes in animal models[72]. In human studies, levels of pro-inflammatory cytokines, including tumor necrosis factor-α, interferon-y, IL-1, IL-1β, and CRP have been shown to be elevated in PD compared to controls[73, 74], suggestive of intestinal immune dysregulation and inflammation in PD. PD patients also have higher levels of intestinal permeability compared to controls[75]. Unlike prior studies that have also reported an inflammatory microbiome state in PD patients compared to controls, our work goes further, demonstrating that dysbiosis reflective of immune activation is present at the earliest stages of PD, and may thus play an important role in PD pathogenesis. This provides additional evidence in favor of a causal role of gastrointestinal inflammatory changes in PD pathogenesis.
Our RF species- and pathway-based classifiers were able to discriminate between recently onset PD and healthy controls, suggesting promise for a microbiome-inclusive biomarker for PD. As expected, this discriminatory ability of the classifier was attenuated, but not lost, when comparing PPS (instead of PD) to healthy controls, and the resulting PPS classifier relied on largely the same sets of species and pathways. This provides further evidence that the shared microbial changes observed both in PD and PPS may be part of, or at least parallel to, the pathological process in PD and are not the result of post-diagnosis factors such as medication and lifestyle changes. The RF classifier was also able to discriminate PD from constipated controls, again largely on the basis of the same set of features.
This study’s depletion of pathways and species involved in microbial carbohydrate utilization in PD is highly consistent with prior published metagenomic studies [9, 12, 23, 26]. This seems to be particularly the case for near-terminal monosaccharide products of polysaccharide degradation. The pathway most depleted in PD in our cohorts was beta glucuronide and glucuronate degradation (GLUCUROCAT-PWY), which was also significantly depleted in participants with PPS compared to controls. This result is consistent with three of the four published PD metagenomic studies that also reported depletion of the same pathways[9, 12, 26]. Several other polysaccharide degradation pathways that were depleted in our PD population, including fructuronate degradation (PWY-7242), mannan degradation (PWY 7456), galacturonate degradation (GALACTUROCAT-PWY), and stachyose degradation (PWY-6527) have also been reported [26]. Conversely, we observed enrichment of glycogen degradation (GLYCOCAT-PWY); this is consistent with the same prior study, which interpreted it as a potential microbiota preference for non-plant-based polysaccharides during PD.
Other changes in PD microbiota functional profiles are more difficult to interpret, sometimes due to the lack of precise pathway cataloging for typical gut microbes. Amino acid pathways, for example, are often altered in the PD metagenome (e.g. lysine and isoleucine biosynthesis enrichment in our study). However, these pathways are highly central to both microbial housekeeping and response to dietary products[26]. Bedarf reported an increase in tryptophan degradation[9], and Wallen reported reduction in tryptophan biosynthesis in PD in tandem with general enrichment of a number of proteolytic pathways[26]. In our study, tryptophan pathways were not associated with either PD or PPS. Similarly, pathways related to neuroactive metabolites are also sometimes metagenomically perturbed, but the interpretation of these changes in the human gut can be difficult[76–78]. We observed a reduction in glutamate biosynthesis (PWY-5505, βPD = −0.0002, FDR: 0.10) and increase in glutamate degradation (PWY-5188, βPD = 0.0006, FDR: 0.006). Wallen observed analogous changes[26], and our observed reduction in reduction in the GABA shunt (GLUDEG-I-PWY) was also consistent with their report of dysregulation in GABA metabolism.
Finally, we observed alterations in several B-vitamin metabolism pathways. Flavin biosynthesis (PWY-6168, bPD = −0.0006, FDR: 0.002), was reduced in PD, consistent with observations from Boktor[12]. We also observed reduction in thiamin (vitamin B1) pathways including thiamin formation (PWY-7357, βPD=−0.0006, FDR: 0.02) and thiamin diphosphate biosynthesis (THISYNARA-PWY, βPD = −0.0007, FDR: 0.06), the latter of which was also reported by Boktor[12] Adenosylcobalamin salvage from cobinamide was instead reduced (COBALSYN-PWY, βPD = −0.003, FDR: 0.06) in PD, suggesting a reduced uptake of the bioactive form of vitamin B12 in individuals with PD. Overall, our taxa and pathway results were consistent with prior studies, and we also identified additional taxa and pathways associated with PD. A key contribution of our study is demonstrating that that these pathways were associated with PPS in the same manner as during clinical disease.
The microbiome is modifiable, and several studies have demonstrated proof-of-concept that microbiota manipulation could contribute to PD prevention and treatment. Identification of PD-specific microbial features could lead to future therapies to treat PD or slow its progression. Fecal microbiota transplantation (FMT) studies in mice showed that in the MPTP and rotenone-induced PD mouse models, FMT reduced neuroinflammation and dopaminergic loss [79, 80]. Probiotic therapies have also been attempted as a mode of microbiome modulation in PD, and have shown promise for inhibiting α-synuclein aggregation [81] and improvement in motor and gastrointestinal function[82] in PD. Administration of beneficial microbial-derived metabolites is another potentially beneficial route to PD treatment, as demonstrated by the impact of sodium butyrate on promotion of aSyn degradation[83]. In addition to their potential for preventing or slowing the progression of PD, microbiome-derived therapies could also serve to improve response to existing PD treatment. Bacteria play an important role in metabolism of levodopa[84, 85], the key medication used to treat PD symptoms, suggesting that altering this metabolism may impact drug efficacy.
A key strength and unique contribution of our study is its employment of rigorously designed prospective cohorts. Drawing cases and controls from the same population substantially reduces the potential for selection bias in our comparisons. This is in contrast to most previous studies, which relied on a traditional case-control study design that is prone to this type of bias. Furthermore, to our knowledge, ours is the first study that focuses on the microbiome in a well-defined group of prodromal PD patients. Only one study to date has examined the microbiome of iRBD in addition to PD patients and healthy controls; analogously to our study, it found substantial overlap and consistent direction in taxa differential in iRBD and PD as compared to HC[14]. Our study also included a control group with constipation, allowing us to account for this important aspect of PD and prodromal PD directly. Another key advantage is the use of shotgun metagenomic profiling, allowing us to easily assess both species’ taxonomic composition and functional potential.
Our study has several limitations. While it was substantially larger than most prior investigations of the microbiome and PD, our findings suggest that the microbial changes observed in PD are subtle, and larger studies may be needed to consistently characterize these differences. Our investigation also uniquely included constipated control and PPS groups, but due to the observational nature of the study, it is difficult to distinguish the extent to which the observed dysbiosis gradient can be attributed to changes in transit time vs. other factors. It is feasible that microbial changes associated with transit time could have explained some of the observed gradient across our phenotype groups, and the extent to which this is the case should be examined in detail in future studies. However, such effects would have been completely missed in earlier studies without such controls. It is also possible that relatively small changes in the gut microbiome could lead to larger systematic effects when spread over a long period of time, or that they are reflective of as-yet-uncharacterized changes in community function. Further, we identified individuals with probable prodromal PD using low-cost and non-invasive methods, which have the advantage of being scalable to large populations, but are not specific for PD. This could explain the fact the difference in microbiota composition between PPS and controls was attenuated as compared to that observed for clinically diagnosed PD. Finally, the chronic nature and long prodromal phase of PD makes it challenging to differentiate potentially causal microbiome changes from those that may be the result of the disease and associated lifestyle modifications and treatment. To address this, our study included groups with constipation and prodromal PD, allowing us to examine microbiome variation across the spectrum from health to constipation to prodromal to recently onset PD. Despite this advantage, the comparisons are still conducted across and not within participants, and other confounding factors that vary across groups cannot be ruled out. Larger, longitudinal studies that follow healthy participants through the prodromal phase to PD onset are needed to address these limitations and more definitively confirm the findings of our study.
In summary, in this rigorously designed study nested within two prospective epidemiological cohorts, the Nurses’ Health Study and the Health Professionals Follow-up study, we identified overall shifts in the gut microbiome, as well as several specific bacterial taxa and pathways, associated in PD and PPS, and demonstrated that microbiome alterations characteristic of recently onset PD are similar to those in PPS.
FUNDING:
“The content is solely the responsibility of the authors and does not necessarily represent the official views of the National Institutes of Health.”
This work was funded by: R01NS097723 (N. Palacios PI), UM1 CA186107 and U01 CA167552
Footnotes
Potential Conflicts of Interest:
CH serves on the Scientific Advisory Board for Seres Therapeutics and Empress Therapeutics, who manufacture products that may be affected by this study. The remaining authors have nothing to report.
Data Availability:
“Further information including the procedures to obtain and access data from the Nurses’ Health Studies and Health Professionals Follow-up Study is described at https://www.nurseshealthstudy.org/researchers (contact email: nhsaccess@channing.harvard.edu) and https://sites.sph.harvard.edu/hpfs/for-collaborators/.” Metagenomic sequencing data and metadata for the study are available through dbGap (phs002193.v1.p1). Additional detailed statistical model outputs are available through Harvard Dataverse https://doi.org/10.7910/DVN/ZOAWNF.
REFERENCES
- 1.Kalia LV and Lang AE, Parkinson’s disease. Lancet, 2015. 386(9996): p. 896–912. [DOI] [PubMed] [Google Scholar]
- 2.Dehay B, et al. , Alpha-synuclein propagation: New insights from animal models. Mov Disord, 2016. 31(2): p. 161–8. [DOI] [PubMed] [Google Scholar]
- 3.Uchihara T and Giasson BI, Propagation of alpha-synuclein pathology: hypotheses, discoveries, and yet unresolved questions from experimental and human brain studies. Acta Neuropathol, 2016. 131(1): p. 49–73. [DOI] [PMC free article] [PubMed] [Google Scholar]
- 4.Holmqvist S, et al. , Direct evidence of Parkinson pathology spread from the gastrointestinal tract to the brain in rats. Acta Neuropathol, 2014. 128(6): p. 805–20. [DOI] [PubMed] [Google Scholar]
- 5.Svensson E, et al. , Vagotomy and subsequent risk of Parkinson’s disease. Ann Neurol, 2015. 78(4): p. 522–9. [DOI] [PubMed] [Google Scholar]
- 6.Liu B, et al. , Vagotomy and Parkinson disease: A Swedish register-based matched-cohort study. Neurology, 2017. 88(21): p. 1996–2002. [DOI] [PMC free article] [PubMed] [Google Scholar]
- 7.Braak H, et al. , Staging of brain pathology related to sporadic Parkinson’s disease. Neurobiol Aging, 2003. 24(2): p. 197–211. [DOI] [PubMed] [Google Scholar]
- 8.Postuma RB, et al. , Risk factors for neurodegeneration in idiopathic rapid eye movement sleep behavior disorder: a multicenter study. Ann Neurol, 2015. 77(5): p. 830–9. [DOI] [PMC free article] [PubMed] [Google Scholar]
- 9.Bedarf JR, et al. , Functional implications of microbial and viral gut metagenome changes in early stage L-DOPA-naive Parkinson’s disease patients. Genome Med, 2017. 9(1): p. 39. [DOI] [PMC free article] [PubMed] [Google Scholar]
- 10.Aho VTE, et al. , Gut microbiota in Parkinson’s disease: Temporal stability and relations to disease progression. EBioMedicine, 2019. 44: p. 691–707. [DOI] [PMC free article] [PubMed] [Google Scholar]
- 11.Boertien JM, et al. , Fecal microbiome alterations in treatment-naive de novo Parkinson’s disease. NPJ Parkinsons Dis, 2022. 8(1): p. 129. [DOI] [PMC free article] [PubMed] [Google Scholar]
- 12.Boktor JC, et al. , Integrated Multi-Cohort Analysis of the Parkinson’s Disease Gut Metagenome. Mov Disord, 2023. 38(3): p. 399–409. [DOI] [PubMed] [Google Scholar]
- 13.Bolliri C, et al. , Gut Microbiota in Monozygotic Twins Discordant for Parkinson’s Disease. Ann Neurol, 2022. 92(4): p. 631–636. [DOI] [PubMed] [Google Scholar]
- 14.Heintz-Buschart A, et al. , The nasal and gut microbiome in Parkinson’s disease and idiopathic rapid eye movement sleep behavior disorder. Mov Disord, 2017. [DOI] [PMC free article] [PubMed]
- 15.Hill-Burns EM, et al. , Parkinson’s disease and Parkinson’s disease medications have distinct signatures of the gut microbiome. Mov Disord, 2017. 32(5): p. 739–749. [DOI] [PMC free article] [PubMed] [Google Scholar]
- 16.Li F, et al. , Alteration of the fecal microbiota in North-Eastern Han Chinese population with sporadic Parkinson’s disease. Neurosci Lett, 2019. 707: p. 134297. [DOI] [PubMed] [Google Scholar]
- 17.Li P, et al. , Gut Microbiota Dysbiosis Is Associated with Elevated Bile Acids in Parkinson’s Disease. Metabolites, 2021. 11(1). [DOI] [PMC free article] [PubMed] [Google Scholar]
- 18.Lin A, et al. , Gut microbiota in patients with Parkinson’s disease in southern China. Parkinsonism Relat Disord, 2018. 53: p. 82–88. [DOI] [PubMed] [Google Scholar]
- 19.Lin CH, et al. , Altered gut microbiota and inflammatory cytokine responses in patients with Parkinson’s disease. J Neuroinflammation, 2019. 16(1): p. 129. [DOI] [PMC free article] [PubMed] [Google Scholar]
- 20.Minato T, et al. , Progression of Parkinson’s disease is associated with gut dysbiosis: Two-year follow-up study. PLoS One, 2017. 12(11): p. e0187307. [DOI] [PMC free article] [PubMed] [Google Scholar]
- 21.Nie S, et al. , The link between increased Desulfovibrio and disease severity in Parkinson’s disease. Appl Microbiol Biotechnol, 2023. [DOI] [PubMed]
- 22.Petrov VA, et al. , Analysis of Gut Microbiota in Patients with Parkinson’s Disease. Bull Exp Biol Med, 2017. 162(6): p. 734–737. [DOI] [PubMed] [Google Scholar]
- 23.Qian Y, et al. , Gut metagenomics-derived genes as potential biomarkers of Parkinson’s disease. Brain, 2020. 143(8): p. 2474–2489. [DOI] [PubMed] [Google Scholar]
- 24.Qian Y, et al. , Alteration of the fecal microbiota in Chinese patients with Parkinson’s disease. Brain Behav Immun, 2018. 70: p. 194–202. [DOI] [PubMed] [Google Scholar]
- 25.Scheperjans F, et al. , Gut microbiota are related to Parkinson’s disease and clinical phenotype. Mov Disord, 2015. 30(3): p. 350–8. [DOI] [PubMed] [Google Scholar]
- 26.Wallen ZD, et al. , Metagenomics of Parkinson’s disease implicates the gut microbiome in multiple disease mechanisms. Nat Commun, 2022. 13(1): p. 6958. [DOI] [PMC free article] [PubMed] [Google Scholar]
- 27.Zhang K, et al. , Parkinson’s Disease and the Gut Microbiome in Rural California. J Parkinsons Dis, 2022. 12(8): p. 2441–2452. [DOI] [PMC free article] [PubMed] [Google Scholar]
- 28.Zheng SY, et al. , Potential roles of gut microbiota and microbial metabolites in Parkinson’s disease. Ageing Res Rev, 2021. 69: p. 101347. [DOI] [PubMed] [Google Scholar]
- 29.Babacan Yildiz G, et al. , Altered gut microbiota in patients with idiopathic Parkinson’s disease: an age-sex matched case-control study. Acta Neurol Belg, 2023. [DOI] [PubMed]
- 30.Keshavarzian A, et al. , Colonic bacterial composition in Parkinson’s disease. Mov Disord, 2015. 30(10): p. 1351–60. [DOI] [PubMed] [Google Scholar]
- 31.Unger MM, et al. , Short chain fatty acids and gut microbiota differ between patients with Parkinson’s disease and age-matched controls. Parkinsonism Relat Disord, 2016. 32: p. 66–72. [DOI] [PubMed] [Google Scholar]
- 32.Barichella M, et al. , Unraveling gut microbiota in Parkinson’s disease and atypical parkinsonism. Mov Disord, 2019. 34(3): p. 396–405. [DOI] [PubMed] [Google Scholar]
- 33.Li Y, et al. , [Features of gut microbiota in patients with idiopathic Parkinson’s disease]. Zhonghua Yi Xue Za Zhi, 2020. 100(13): p. 1017–1022. [DOI] [PubMed] [Google Scholar]
- 34.Li W, et al. , Structural changes of gut microbiota in Parkinson’s disease and its correlation with clinical features. Sci China Life Sci, 2017. 60(11): p. 1223–1233. [DOI] [PubMed] [Google Scholar]
- 35.Schwiertz A, et al. , Fecal markers of intestinal inflammation and intestinal permeability are elevated in Parkinson’s disease. Parkinsonism Relat Disord, 2018. [DOI] [PubMed]
- 36.Dumitrescu L, et al. , Serum and Fecal Markers of Intestinal Inflammation and Intestinal Barrier Permeability Are Elevated in Parkinson’s Disease. Front Neurosci, 2021. 15: p. 689723. [DOI] [PMC free article] [PubMed] [Google Scholar]
- 37.Ross GW, et al. , Association of olfactory dysfunction with risk for future Parkinson’s disease. Ann Neurol, 2008. 63(2): p. 167–73. [DOI] [PubMed] [Google Scholar]
- 38.Postuma RB, et al. , Quantifying the risk of neurodegenerative disease in idiopathic REM sleep behavior disorder. Neurology, 2009. 72(15): p. 1296–300. [DOI] [PMC free article] [PubMed] [Google Scholar]
- 39.Walter U, et al. , Potential impact of self-perceived prodromal symptoms on the early diagnosis of Parkinson’s disease. J Neurol, 2013. 260(12): p. 3077–85. [DOI] [PubMed] [Google Scholar]
- 40.Diederich NJ, et al. , Discriminative power of different nonmotor signs in early Parkinson’s disease. A case-control study. Mov Disord, 2010. 25(7): p. 882–7. [DOI] [PubMed] [Google Scholar]
- 41.Hughes KC, et al. , Non-motor features of Parkinson’s disease in a nested case-control study of US men. J Neurol Neurosurg Psychiatry, 2018. 89(12): p. 1288–1295. [DOI] [PubMed] [Google Scholar]
- 42.Hughes KC, et al. , Non-Motor Features of Parkinson’s Disease in Women. J Parkinsons Dis, 2021. 11(3): p. 1237–1246. [DOI] [PubMed] [Google Scholar]
- 43.Bolyen E, et al. , Reproducible, interactive, scalable and extensible microbiome data science using QIIME 2. Nat Biotechnol, 2019. 37(8): p. 852–857. [DOI] [PMC free article] [PubMed] [Google Scholar]
- 44.Boeve BF, et al. , Validation of the Mayo Sleep Questionnaire to screen for REM sleep behavior disorder in a community-based sample. J Clin Sleep Med, 2013. 9(5): p. 475–80. [DOI] [PMC free article] [PubMed] [Google Scholar]
- 45.Doty RL, Marcus A, and Lee WW, Development of the 12-item Cross-Cultural Smell Identification Test (CC-SIT). Laryngoscope, 1996. 106(3 Pt 1): p. 353–6. [DOI] [PubMed] [Google Scholar]
- 46.Everett C, et al. , Overview of the Microbiome Among Nurses study (Micro-N) as an example of prospective characterization of the microbiome within cohort studies. Nat Protoc, 2021. 16(6): p. 2724–2731. [DOI] [PMC free article] [PubMed] [Google Scholar]
- 47.; Available from: https://www.atcc.org/products/msa-2002.
- 48.bioBakery. Available from: https://bitbucket.org/biobakery/biobakery/wiki/Home.
- 49.McIver LJ, et al. , bioBakery: a meta’omic analysis environment. Bioinformatics, 2018. 34(7): p. 1235–1237. [DOI] [PMC free article] [PubMed] [Google Scholar]
- 50.KneadDATAv0.3 pipeline. Available from: https://bitbucket.org/biobakery/kneaddata.
- 51.Bolger AM, Lohse M, and Usadel B, Trimmomatic: a flexible trimmer for Illumina sequence data. Bioinformatics, 2014. 30(15): p. 2114–20. [DOI] [PMC free article] [PubMed] [Google Scholar]
- 52.A framework for human microbiome research. Nature, 2012. 486(7402): p. 215–21. [DOI] [PMC free article] [PubMed] [Google Scholar]
- 53.Segata N, et al. , Metagenomic microbial community profiling using unique clade-specific marker genes. Nat Methods, 2012. 9(8): p. 811–4. [DOI] [PMC free article] [PubMed] [Google Scholar]
- 54.MetaPhlAn2 profiler. Available from: http://huttenhower.sph.harvard.edu/metaphlan2.
- 55.Abubucker S, et al. , Metabolic reconstruction for metagenomic data and its application to the human microbiome. PLoS Comput Biol, 2012. 8(6): p. e1002358. [DOI] [PMC free article] [PubMed] [Google Scholar]
- 56.HUMAnN2. Available from: http://huttenhower.sph.harvard.edu/humann2.
- 57.Suzek BE, et al. , UniRef: comprehensive and non-redundant UniProt reference clusters. Bioinformatics, 2007. 23(10): p. 1282–8. [DOI] [PubMed] [Google Scholar]
- 58.Morgat A, et al. , UniPathway: a resource for the exploration and annotation of metabolic pathways. Nucleic Acids Res, 2012. 40(Database issue): p. D761–9. [DOI] [PMC free article] [PubMed] [Google Scholar]
- 59.Kanehisa M, et al. , Data, information, knowledge and principle: back to metabolism in KEGG. Nucleic Acids Res, 2014. 42(Database issue): p. D199–205. [DOI] [PMC free article] [PubMed] [Google Scholar]
- 60.Mallick H, R. A, McIver L, Ma S, Zhang Y, Nguyen LH, Tickle TL, Ren B, Schawager EH, Chatterjee S, Thompson KN, Wilkinson JE, Subramanian Y, Lu Y, Waldron L, Paulson JN, Franzosa EA, Bravo HC, Huttenhower C, Miltivariable Association Discovery in Population-scale Meta-omics Studies. PLos Comp Bio, 2021. In Press. [DOI] [PMC free article] [PubMed]
- 61.Louis P and Flint HJ, Formation of propionate and butyrate by the human colonic microbiota. Environ Microbiol, 2017. 19(1): p. 29–41. [DOI] [PubMed] [Google Scholar]
- 62.Romano S, et al. , Meta-analysis of the Parkinson’s disease gut microbiome suggests alterations linked to intestinal inflammation. NPJ Parkinsons Dis, 2021. 7(1): p. 27. [DOI] [PMC free article] [PubMed] [Google Scholar]
- 63.Li C, et al. , Gut Microbiota Differs Between Parkinson’s Disease Patients and Healthy Controls in Northeast China. Front Mol Neurosci, 2019. 12: p. 171. [DOI] [PMC free article] [PubMed] [Google Scholar]
- 64.Ascherio A and Schwarzschild MA, The epidemiology of Parkinson’s disease: risk factors and prevention. Lancet Neurol, 2016. 15(12): p. 1257–1272. [DOI] [PubMed] [Google Scholar]
- 65.Mallick H ML, Rahnavard AS, Zhang Y, Nguyen LH, et al. , Multivariable association discovery in population-sclae meta-omics studies 2020. [DOI] [PMC free article] [PubMed]
- 66.Schneider H and Blaut M, Anaerobic degradation of flavonoids by Eubacterium ramulus. Arch Microbiol, 2000. 173(1): p. 71–5. [DOI] [PubMed] [Google Scholar]
- 67.Knudsen K, et al. , Objective Colonic Dysfunction is Far more Prevalent than Subjective Constipation in Parkinson’s Disease: A Colon Transit and Volume Study. J Parkinsons Dis, 2017. 7(2): p. 359–367. [DOI] [PubMed] [Google Scholar]
- 68.Villumsen M, et al. , Inflammatory bowel disease increases the risk of Parkinson’s disease: a Danish nationwide cohort study 1977–2014. Gut, 2019. 68(1): p. 18–24. [DOI] [PubMed] [Google Scholar]
- 69.Weimers P, et al. , Inflammatory Bowel Disease and Parkinson’s Disease: A Nationwide Swedish Cohort Study. Inflamm Bowel Dis, 2019. 25(1): p. 111–123. [DOI] [PubMed] [Google Scholar]
- 70.Peter I, et al. , Anti-Tumor Necrosis Factor Therapy and Incidence of Parkinson Disease Among Patients With Inflammatory Bowel Disease. JAMA Neurol, 2018. 75(8): p. 939–946. [DOI] [PMC free article] [PubMed] [Google Scholar]
- 71.Hui KY, et al. , Functional variants in the LRRK2 gene confer shared effects on risk for Crohn’s disease and Parkinson’s disease. Sci Transl Med, 2018. 10(423). [DOI] [PMC free article] [PubMed] [Google Scholar]
- 72.Matheoud D, et al. , Intestinal infection triggers Parkinson’s disease-like symptoms in Pink1(−/−) mice. Nature, 2019. 571(7766): p. 565–569. [DOI] [PubMed] [Google Scholar]
- 73.Devos D, et al. , Colonic inflammation in Parkinson’s disease. Neurobiol Dis, 2013. 50: p. 42–8. [DOI] [PubMed] [Google Scholar]
- 74.Houser MC, et al. , Stool Immune Profiles Evince Gastrointestinal Inflammation in Parkinson’s Disease. Mov Disord, 2018. 33(5): p. 793–804. [DOI] [PMC free article] [PubMed] [Google Scholar]
- 75.Forsyth CB, et al. , Increased intestinal permeability correlates with sigmoid mucosa alpha-synuclein staining and endotoxin exposure markers in early Parkinson’s disease. PLoS One, 2011. 6(12): p. e28032. [DOI] [PMC free article] [PubMed] [Google Scholar]
- 76.Miri S, et al. , Neuromicrobiology, an emerging neurometabolic facet of the gut microbiome? Front Microbiol, 2023. 14: p. 1098412. [DOI] [PMC free article] [PubMed] [Google Scholar]
- 77.Cox LM and Weiner HL, Microbiota Signaling Pathways that Influence Neurologic Disease. Neurotherapeutics, 2018. 15(1): p. 135–145. [DOI] [PMC free article] [PubMed] [Google Scholar]
- 78.Wiley NC, et al. , Production of Psychoactive Metabolites by Gut Bacteria. Mod Trends Psychiatry, 2021. 32: p. 74–99. [DOI] [PubMed] [Google Scholar]
- 79.Zhao Z, et al. , Fecal microbiota transplantation protects rotenone-induced Parkinson’s disease mice via suppressing inflammation mediated by the lipopolysaccharide-TLR4 signaling pathway through the microbiota-gut-brain axis. Microbiome, 2021. 9(1): p. 226. [DOI] [PMC free article] [PubMed] [Google Scholar]
- 80.Sun MF, et al. , Neuroprotective effects of fecal microbiota transplantation on MPTP-induced Parkinson’s disease mice: Gut microbiota, glial reaction and TLR4/TNF-alpha signaling pathway. Brain Behav Immun, 2018. 70: p. 48–60. [DOI] [PubMed] [Google Scholar]
- 81.Goya ME, et al. , Probiotic Bacillus subtilis Protects against alpha-Synuclein Aggregation in C. elegans. Cell Rep, 2020. 30(2): p. 367–380 e7. [DOI] [PMC free article] [PubMed] [Google Scholar]
- 82.Barichella M, et al. , Probiotics and prebiotic fiber for constipation associated with Parkinson disease: An RCT. Neurology, 2016. 87(12): p. 1274–80. [DOI] [PubMed] [Google Scholar]
- 83.Qiao CM, et al. , Sodium butyrate causes alpha-synuclein degradation by an Atg5-dependent and PI3K/Akt/mTOR-related autophagy pathway. Exp Cell Res, 2020. 387(1): p. 111772. [DOI] [PubMed] [Google Scholar]
- 84.Maini Rekdal V, et al. , Discovery and inhibition of an interspecies gut bacterial pathway for Levodopa metabolism. Science, 2019. 364(6445). [DOI] [PMC free article] [PubMed] [Google Scholar]
- 85.van Kessel SP, et al. , Gut bacterial tyrosine decarboxylases restrict levels of levodopa in the treatment of Parkinson’s disease. Nat Commun, 2019. 10(1): p. 310. [DOI] [PMC free article] [PubMed] [Google Scholar]
- 86.Mirzayi C, et al. , Reporting guidelines for human microbiome research: the STORMS checklist. Nat Med, 2021. 27(11): p. 1885–1892. [DOI] [PMC free article] [PubMed] [Google Scholar]
Associated Data
This section collects any data citations, data availability statements, or supplementary materials included in this article.
Data Availability Statement
“Further information including the procedures to obtain and access data from the Nurses’ Health Studies and Health Professionals Follow-up Study is described at https://www.nurseshealthstudy.org/researchers (contact email: nhsaccess@channing.harvard.edu) and https://sites.sph.harvard.edu/hpfs/for-collaborators/.” Metagenomic sequencing data and metadata for the study are available through dbGap (phs002193.v1.p1). Additional detailed statistical model outputs are available through Harvard Dataverse https://doi.org/10.7910/DVN/ZOAWNF.