

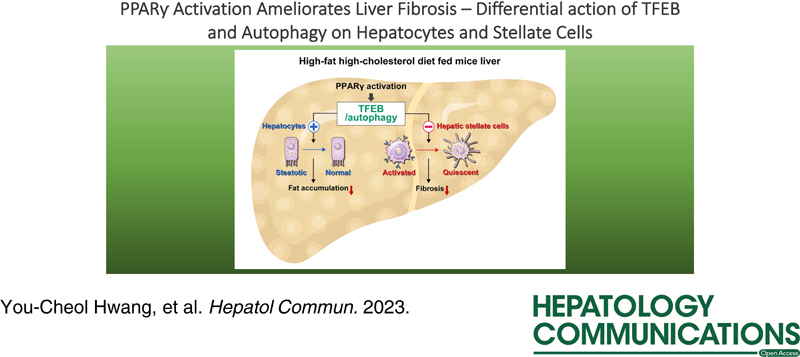
Abstract
Background:
Peroxisome proliferator-activated receptor γ (PPARγ) activation suppresses HSC activation and liver fibrosis. Moreover, autophagy is implicated in hepatic lipid metabolism. Here, we determined whether PPARγ activation ameliorates HSC activation by downregulating transcription factor EB (TFEB)-mediated autophagy.
Methods and Results:
Atg7 or Tfeb knockdown in human HSC line LX-2 cells downregulated the expression of fibrogenic markers including α smooth muscle actin, glial fibrillary acidic protein, and collagen type 1. Conversely, Atg7 or Tfeb overexpression upregulated fibrogenic marker expression. Rosiglitazone (RGZ)-mediated PPARγ activation and/or overexpression in LX-2 cells and primary HSCs decreased autophagy, as indicated by LC3B conversion, total and nuclear-TFEB contents, mRFP-LC3 and BODIPY 493/503 colocalization, and GFP-LC3 and LysoTracker colocalization. RGZ treatment decreased liver fat content, liver enzyme levels, and fibrogenic marker expression in high-fat high-cholesterol diet-fed mice. Electron microscopy showed that RGZ treatment restored the high-fat high-cholesterol diet-mediated lipid droplet decrease and autophagic vesicle induction in primary HSCs and liver tissues. However, TFEB overexpression in LX-2 cells offset the aforementioned effects of RGZ on autophagic flux, lipid droplets, and fibrogenic marker expression.
Conclusions:
Activation of PPARγ with RGZ ameliorated liver fibrosis and downregulation of TFEB and autophagy in HSCs may be important for the antifibrotic effects of PPARγ activation.
INTRODUCTION
NAFLD is the most prevalent cause of chronic liver disease and currently affects ~25% of the adult population worldwide.1 Obesity and insulin resistance have been implicated in NAFLD pathogenesis, and it encompasses a wide disease spectrum from simple steatosis and NASH to more advanced stages of liver fibrosis, cirrhosis, and HCC.2
HSC is a resident liver cell that plays a key role in liver fibrosis. In the normal liver, HSCs maintain a nonproliferative and quiescent phenotype characterized by abundant retinoid-containing cytoplasmic lipid droplets (LDs) and high peroxisome proliferator-activated receptor γ (PPARγ) expression. However, HSCs are activated on liver injury and transdifferentiate to myofibroblasts characterized by LD loss, decreased PPARγ expression, and increased extracellular matrix production.3 Accordingly, PPARγ agonist treatment and adenoviral PPARγ overexpression in rodents downregulate pro-fibrogenic gene expression and reduce liver fibrosis.4 Moreover, HSC‐specific PPARγ knockout upregulates α-smooth muscle actin (α-SMA) expression and aggravates liver fibrosis.5 Collectively, these findings suggest a link between PPARγ activation and liver fibrosis improvement.
Recently, autophagy has been regarded as a key player in hepatic lipid metabolism. Singh et al6 have shown that autophagy inhibition increases hepatic triglycerides and LDs in hepatocytes (HCs) and mouse liver. In addition, triglycerides and LD structural proteins colocalize with autophagic membrane and lysosomal markers. However, to date, the role of autophagy in liver fibrosis remains inconclusive. Autophagy activation degrades LDs into free fatty acids, which provide energy for HSC activation through mitochondrial β-oxidation and subsequent liver fibrosis development.7 However, another study has argued that autophagy in HSCs attenuates liver fibrosis by suppressing fibrogenic extracellular vesicle release.8
Based on the uncertainty regarding the role of autophagy in liver fibrosis and the close connection between PPARγ and HSC activation, we aimed to determine whether PPARγ agonists prevent HSC activation and subsequent liver fibrosis through autophagy regulation. In particular, we have focused on the role of transcription factor EB (TFEB), a master regulator of lysosomal biogenesis and autophagy, in these processes.
METHODS
Cell culture and treatment
LX-2 cells (human HSC line) and stable Tfeb-GFP-transfected HeLa cells were cultured in DMEM (Gibco) supplemented with 10% fetal bovine serum and 1% penicillin/streptomycin at 37 °C in a humidified atmosphere containing 5% CO2. Rosiglitazone (RGZ; Sigma Aldrich) and GW9662 (Sigma Aldrich) were dissolved in DMSO and diluted in the medium.
Liver parenchymal cells isolation
HSC and HCs isolation from mouse liver was performed according to 3 main sequential stages: in situ collagenase perfusion of mouse liver, subsequent in vitro digestion, and density gradient-based separation of liver cells. First, the setup was adjusted to achieve a water bath temperature of ~37 °C for warming the 1×EGTA and collagenase solutions (37.5 mg/50 mL HBSS). Successful IVC cannulation with 0.75 IN I.V. catheter (BD) and stabilization of the perfusion setup are key steps to avoid catheter dislocation during the perfusion. The initial EGTA solution flushes out blood and thus avoids contamination with red blood cells and hepatic vessel clotting. Subsequently, perfusion with EGTA solution was performed for 15 minutes, followed by collagenase perfusion for 40 minutes to digest the liver. The liver was carefully removed and minced with scissors. The digested liver was further incubated in a shaker-incubator with collagenase solution at 37 °C for 20 minutes, filtered through a 0.72 μm cell strainer to eliminate undigested liver tissue remnants, and washed to remove excess digestion enzymes using low-force centrifugation. The final step of the isolation procedure is a density gradient centrifugation and the hepatocyte and HSC collection. For hepatocyte isolation, the dissected liver cells were released into suspension and centrifuged. The pellet contained the HCs, and the isolated HCs were counted and plated on collagen-coated cell culture plates. For HSCs, it is important to resuspend the hepatocyte suspension in a density gradient medium and then slowly add the density-HBSS on top of the cell-density gradient solution, followed by centrifugation under no break condition (1380 × g for 17 min). After centrifugation, the HSCs were carefully collected by removing the cell layer from the gradient interface. After the final centrifugation, the pellet was obtained to collect the HSCs. Mouse HSCs were cultured in RPMI 1640 (Gibco) supplemented with 10% fetal bovine serum and 1% penicillin/streptomycin at 37 °C in a humidified atmosphere containing 5% CO2.
Plasmid-based reporter system
LX-2 cells and primary HSCs (4×10⁴ cells/60 mm dish) were transfected with pGFP-LC3, mRFP-LC3B, flag-Tfeb, pcDNA flag-PPARγ (Addgene, #8895), or pCMV–myc-atg7 (Addgene, #24921) plasmid using Lipofectamine 2000 (Invitrogen) in Opti-MEM (Gibco) according to the manufacturer’s instructions.
Western blot
Total proteins were extracted from cultured cells and liver tissue using a PRO-PREPTM protein extraction solution (iNtRON Biotechnology, Inc.). The samples were lysed on ice for 30 minutes and centrifuged at 14,000 rpm for 15 minutes. The protein concentration was determined by the Bradford method. Equal amounts of protein sample (10–20 μg) were separated by 10%–15% SDS-PAGE and transferred to Immobilon Transfer Membranes (EMD Millipore Corporation). Membranes were then incubated overnight with primary antibodies against TFEB (Bethyl Laboratories, Inc.), LC3B (Novus bio), p62 (MBL Life science), α-SMA, collagen1, glial fibrillary acidic protein (GFAP), PPARγ (Cell Signaling), lamin B (Santa Cruz Biotechnology), and glyceraldehyde 3-phosphate dehydrogenase (Bethyl Laboratories, Inc.). The membranes were further incubated with horseradish peroxidase-conjugated secondary antibodies (Bethyl Laboratories, Inc.). Finally, immune-reactive protein bands were detected using an enhanced chemiluminescence detection kit (Pierce Biotechnology). The protein expression data were quantified by measuring the hybridization signal intensity using ImageJ analysis software (NIH).
RNA interference
For TFEB and ATG7 silencing, small interfering RNA On-TARGETplus SMARTpool reagents were used (Dharmacon), and scrambled small interfering RNAs (Bioneer) were transfected into LX-2 cells and primary HSCs using Lipofectamine 2000 in Opti-MEM according to the manufacturer’s instructions. After transfecting for 48 hours, the cells were treated with 30 µM RGZ for 18 hours and the proteins were extracted for western blot analysis.
Animals
All animal experiments were approved by the Animal Research Ethics Committee of Kyung Hee University Hospital at Gangdong. Five-week-old male C57B/6J mice weighing 18–22 g were purchased from Central Lab Animal Inc. and maintained at a 12-hour light/dark cycle, 23 ± 3 °C, and 35 ± 5% humidity with free access to normal chow diet (ND) and water for 1 week. Then, they were randomly divided into 4 experimental groups (n = 7–10/group) and fed ND (10% energy derived from fat) or high-fat high-cholesterol diet (HFHCD; ENVIGO Diet catalog number TD02028: 1.25% cholesterol, 0.5% cholic acid, 42.0 kcal% fat, 15.4 kcal% protein, and 41.9 kcal% carbohydrate) for 9 weeks. Then, they were fed ND or HFHCD with or without 30 mg/kg body weight RGZ (Sigma Aldrich) for 4 weeks. Body weight and food intake were monitored weekly. Blood samples were collected and the liver tissue was harvested for subsequent use in various assays. Data collection and evaluation were performed blindly, and the researchers were unaware of group treatments.
Oral glucose tolerance test and insulin tolerance test
Oral glucose tolerance test was performed on overnight-fasting mice (12 h). Blood samples were collected from each mouse immediately and 0, 30, 60, 90, and 120 minutes after orally administering 2 g/kg glucose solution. Blood glucose levels were measured using Accu-Chek (Performa Nano). Insulin tolerance test was performed on another day. The mice fasted for 4 hours and were intraperitoneally injected with 0.4 U/kg insulin after measuring the baseline glucose levels. Glucose levels in tail blood were determined 15, 30, 60, 90, and 120 minutes after insulin injection.
Measurement of biochemical parameters
The animals were euthanized, and blood was collected and allowed to clot for 20 minutes on ice. The serum was then separated by centrifugation at 500 × g for 15 minutes and stored in a deep freezer. Liver tissue from each mouse was weighed, frozen in liquid nitrogen, and fixed with formalin or sectioned. Biochemical parameters, including aspartate aminotransferase, alanine aminotransferase, cholesterol, and triglyceride levels were measured in duplicate using spectrophotometry with commercial assay kits (Asan Pharm Co.) according to the manufacturer’s instructions.
Histologic analysis
After euthanizing, the liver tissues were fixed in formalin and embedded in paraffin. Then, 5 μm specimens were cut and stained using hematoxylin and eosin and Masson trichrome stain. Moreover, fresh liver tissues were frozen in OCT Embedding Matrix (FSC 22 Clear, Leica) and cut at 5 μm thickness. The sections were sequentially stained with oil red O solution and counterstained with hematoxylin. Liver histologic analysis was performed using light microscopy (400 magnification × ) by a single pathologist (L.S.J.) blinded to experimental details.
Transmission electron microscopy
For transmission electron microscopy observations, the liver tissues were fixed in 4% paraformaldehyde and 2.5% glutaraldehyde in 0.1 M phosphate buffer overnight. After washing in 0.1 M phosphate buffer, the specimens were postfixed with 1% osmium tetroxide in the same buffer for 30 minutes and dehydrated with a series of graded ethyl alcohol solutions.
The liver tissues were embedded in Epon 812 and polymerized at 60 °C for 1 day. Ultrathin sections (60–70 nm) were obtained using an ultramicrotome (Leica Ultracut UCT). Ultrathin sections collected on grids (200 mesh) were examined with a transmission electron microscope (JEM 1010) operating at 60 kV, and images were recorded using a CCD camera (SC1000, Gatan Inc.).
Statistical analyses
All statistical analyses were performed using GraphPad Prism 5.0 (GraphPad Software Inc.). Sample size of each protocol was determined based on our previous study.9 Comparisons between two groups were analyzed using the Student t test and for more than 3 groups, 1-way ANOVA was used, followed by Tukey range testing. All data are presented as the mean ± SEM. Post hoc tests were run only when F achieved p < 0.05, and there was no significant variance in homogeneity. p <0.05 was considered to indicate statistically significant differences between mean values.
RESULTS
PPARγ activation increases lipid droplet formation and reduces fibrotic marker expression in HSCs
We first isolated primary HSCs from ND and HFHCD-fed mice and plated them to observe the morphologic changes for 7 days. Compared with HSCs from ND-fed mice, those from HFHCD-fed mice showed lesser LDs in the cytoplasm even 1 day after plating. In addition, HSCs from HFHCD-fed mice showed a more rapid myofibroblast-like transformation including LD loss, prominent stress fibers, and increased proliferation than those from ND-fed mice (Supplemental Figure S1, http://links.lww.com/HC9/A278). RGZ treatment increased cytoplasmic LDs in oil red O and BODIPY 493/503-stained LX-2 cells and primary HSCs (Figure 1A). Moreover, PPARγ overexpression in LX-2 cells transfected with a PPARγ-expressing plasmid increased cytoplasmic LDs (Figure 1B).
FIGURE 1.
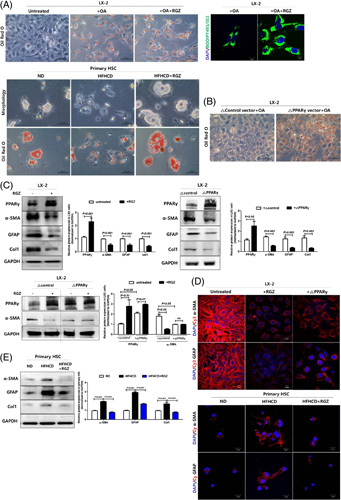
PPARγ activation increases LD formation and reduces fibrotic marker expression in HSCs. (A) Representative staining of LX-2 cells with oil red O after 0.1 mM oleic acid and/or 30 µM RGZ treatment for 24 hours (scale bars: 50 µm). Representative fluorescence images of BODIPY 493/503 (green) and DAPI-stained nuclei (blue). LX-2 cells were loaded with or without 0.1 mM oleic acid and then treated with 30 μM RGZ for 18 hours. After staining with BODIPY 493/503, the cells were viewed using confocal microscopy to determine the LD count (scale bars: 10 µm). Primary HSCs isolated from mice fed HFHCD for 13 weeks were in vitro cultured for 5 days, and morphologic changes and LD formation were determined with oil red O staining. Data are shown as mean ± SEM (n = 8–15 mice per group). (B) LX-2 cells were transfected with the PPARγ-expressing plasmid for 24 hours and stained with oil red O (scale bars: 50 µm). (C) LX-2 cells were treated with 30 µM RGZ for 18 hours. LX-2 cells were transfected with PPARγ-expressing plasmid for 24 hours and treated with or without 30 µM RGZ for 18 hours. PPARγ, α-SMA, GFAP, and Col1 expression in cell lysates was assessed using western blotting. (D) LX-2 cells were treated with RGZ for 18 hours or transfected with plasmid expressing PPARγ for 24 hours and then incubated with Cy3 (red) and DAPI (blue) and examined under a confocal microscope (scale bars: 10 µm). (E) Mice on a ND or HFHCD for 9 weeks were then treated with RGZ for 4 weeks. Freshly isolated HSCs were cultured for 5 days. Western blot analysis was used to assess the expression of fibrotic markers including α-SMA, GFAP, and Col1. Protein expression was normalized to that of the GAPDH control. Data are presented as the mean ± SEM from 2 to 3 independent experiments. Immunocytochemistry shows the altered expression of fibrotic markers, including Cy3-α-SMA (red) and Cy3-GFAP (red), and DAPI-stained nuclei (blue; Scale bars: 10 µm). Abbreviations: α-SMA, α-smooth muscle actin; Col1, collagen1; Cy3, cyanine-3; GAPDH, glyceraldehyde 3-phosphate dehydrogenase; GFAP, glial fibrillary acidic protein; HFHCD, high-fat high-cholesterol diet; LD, lipid droplet; ND, normal chow diet; OA, oleic acid; PPARγ, peroxisome proliferator-activated receptor γ; RGZ, rosiglitazone.
We next determined the effect of PPARγ activation on fibrotic markers in LX-2 cells. LX-2 cells were activated even immediately after replating, and PPARγ activation with RGZ treatment and/or PPARγ overexpression significantly mitigated the expression of fibrogenic markers including α-SMA, GFAP, and collagen type 1, as reported.10 However, the combined effects of PPARγ overexpression and agonist treatment on the expression of fibrogenic markers were not evident in this study (Figure 1C). In addition, cyanine-3-α-SMA and cyanine-3-GFAP were strongly expressed under basal conditions, whereas RGZ treatment or PPARγ overexpression diminished global fluorescence intensity (Figure 1D). Consistent with the results from LX-2 cells, primary HSCs isolated from HFHCD-fed mice showed increased fibrogenic marker expression than those from ND-fed mice, which was mitigated in RGZ-treated HSCs from HFHCD-fed mice (Figure 1E).
We sought to determine whether the effects of RGZ on fibrotic markers were PPARγ dependent. Cotreatment with the PPARγ antagonist GW9662 offsets the effect of RGZ on HSC activation; thus the effects of RGZ on HSC activation might be PPARγ dependent (Supplemental Figure S2, http://links.lww.com/HC9/A278).
PPARγ activation suppresses autophagy in HSCs
Recent studies have shown that autophagy is implicated in liver fibrosis pathogenesis.7,11 Consistent with previous reports, Atg7 knockdown in LX-2 cells decreased the expression of not only autophagy-related genes including autophagosome formation-related genes LC3B and TFEB but also fibrogenic markers, as indicated by both immunoblot and immunofluorescence staining (Figure 2A, B). Conversely, Atg7 overexpression had the opposite effect on autophagy-related gene and fibrogenic marker expressions in LX-2 cells (Figure 2C, D).
FIGURE 2.
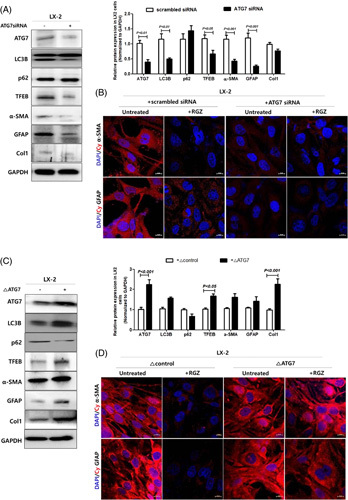
Modulation of autophagy affects fibrogenic marker expressions in LX-2 cells. LX-2 cells were transfected with scrambled or Atg7 siRNA for 48 hours and then treated with 30 µM RGZ for 18 hours. (A) Western blot analysis was used to assess ATG7, LC3B, p62, TFEB, α-SMA, GFAP, and Col1 protein expression, which was normalized to GAPDH expression. (B) Representative fluorescence images of immunocytochemistry. Fibrogenic marker stained with Cy3-α-SMA (red) and Cy3-GFAP (red) and DAPI-stained nuclei (blue) (scale bars: 50 µm). LX-2 cells were transfected with control or Atg7-expressing plasmid for 24 hours and then treated with 30 µM RGZ for 18 hours (scale bars: 50 µm). (C) Western blot analysis was used to assess ATG7, LC3B, p62, TFEB, α-SMA, GFAP, and Col1 protein expression, which was normalized to GAPDH expression. (D) Representative fluorescence images of immunocytochemistry. Fibrotic marker stained with Cy3–α-SMA (red) and Cy3–GFP (red) and DAPI-stained nuclei (blue; scale bars: 50 µm). Abbreviations: α-SMA, α-smooth muscle actin; Col1, collagen1; Cy3, cyanine-3; GAPDH, glyceraldehyde 3-phosphate dehydrogenase; GFAP, glial fibrillary acidic protein; RGZ, rosiglitazone; siRNA, small interfering RNA; TFEB, transcription factor EB.
We, therefore, examined whether PPARγ activation affects the expression of autophagy-related genes. RGZ treatment and PPARγ overexpression ameliorated the increased autophagy in LX-2 cells (Figure 3A, B). However, fibrogenic marker expression indicated that the effects of RGZ treatment and PPARγ overexpression on autophagy were not additive. To determine whether autophagy was responsible for LD accumulation, BODIPY 493/503 staining was used. In untreated LX-2 cells, mRFP-LC3 (red) and BODIPY 493/503 (green) signals were merged; however, the colocalization was reduced after RGZ treatment (Figure 3C). In addition, exogenous GFP-LC3 and LysoTracker colocalization were also reduced after RGZ treatment (Figure 3D). These results suggest that LD accumulation after RGZ treatment might be associated with decreased lipophagy, thus reducing LD degradation.
FIGURE 3.
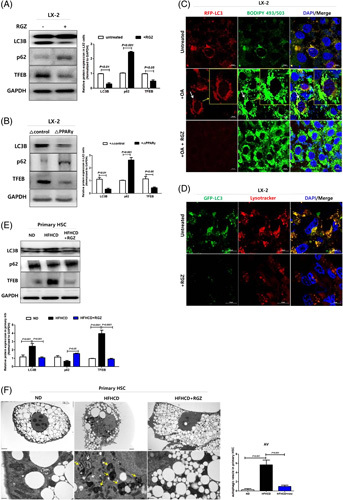
PPARγ activation suppresses autophagy in HSCs. (A) LX-2 cells were treated with 30 µM RGZ for 18 hours. Western blot was used to assess LC3B, p62, and TFEB protein expression. Relative intensities were normalized to that of GAPDH. (B) LX-2 cells were transfected with PPARγ-expressing plasmid for 24 hours. LC3B, p62, and TFEB expression in total protein lysates were analyzed using western blotting. (C) Representative fluorescence images of mRFP–LC3 (red), BODIPY 493/503 (green), and DAPI-stained nucleus (blue). mRFP–LC3-transfected LX-2 cells were loaded with 0.1 mM oleate and then treated with or without 30 μM RGZ for 18 hours. After staining with BODIPY 493/503, the cells were viewed using confocal microscopy to determine the LD count (scale bars: 10 µm). (D) Immunofluorescence microscopy of LC3B and LysoTracker in LX-2 cells. Cells transfected with GFP-LC3B (green) vector plasmids were treated with vehicle (DMSO) or RGZ for 18 hours and stained with 100 µM LysoTracker (red) for 1 hour. The cells were then incubated with a fluorescence-labeled secondary antibody and visualized using fluorescence microscopy (scale bars: 10 µm). (E) LC3B, p62, and TFEB expression in isolated primary HSCs was assessed using western blotting. (F) TEM showing autophagosomes or autolysosomal structures in primary HSCs from RGZ or DMSO-treated HFHCD-fed mice. White and yellow arrows indicate autophagosomes and autolysosomal structures, respectively. Abbreviations: GAPDH, glyceraldehyde 3-phosphate dehydrogenase; HFHCD, high-fat high-cholesterol diet; LD, lipid droplet; PPARγ, peroxisome proliferator-activated receptor γ; RGZ, rosiglitazone; TEM, transmission electron microscopy; TFEB, transcription factor EB.
Similarly, LC3B and total-TFEB expression levels decreased after RGZ treatment in primary HSCs isolated from HFHCD-fed mice (Figure 3E). Moreover, electron microscopy showed lesser cytoplasmic LDs in primary HSCs isolated from HFHCD-fed mice than that in those isolated from ND mice, which was restored after RGZ treatment. Furthermore, the autophagic vesicles were more abundant in primary HSCs isolated from HFHCD-fed mice than in those isolated from ND-fed mice, which disappeared after RGZ treatment (Figure 3F). In contrast, primary HCs from HFHCD-fed mice revealed increased LDs and decreased autophagic flux, and this effect was recovered by RGZ treatment (Figure 4A, B). Moreover, electron microscopic findings of primary HCs were opposite to those of primary HSCs. Primary HCs from ND-fed mice showed scanty LDs but numerous autophagic vesicles in the cytoplasm; however, LDs accumulated and autophagic vesicles reduced in HFHCD-fed mice, which was reversed after RGZ treatment (Figure 4C).
FIGURE 4.
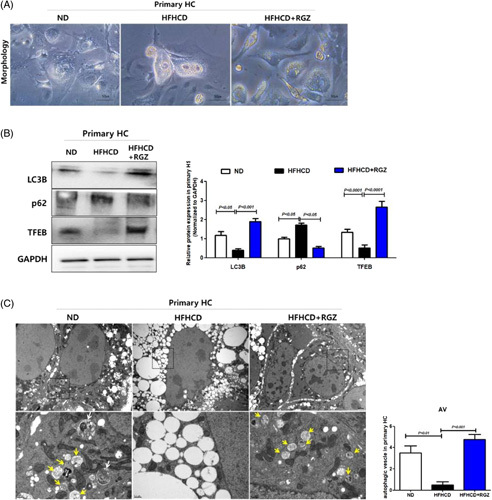
RGZ decreases LD formation and increases autophagy in primary HCs. Mice were fed ND or HFHCD for 9 weeks and then treated with RGZ for 4 weeks. Freshly isolated HCs were in vitro cultured for 5 days. (A) Morphologic changes in primary HCs. (B) Western blot was used to assess TFEB, LC3B, and p62 protein expression. Relative intensities were normalized to that of GAPDH. (C) TEM shows autophagosomes or autolysosomal structures in primary HSCs isolated from HFHCD-fed and RGZ or vehicle-treated mice. White and yellow arrows indicate the autophagosomes and autolysosomal structures, respectively. Abbreviations: AV, autophagic vesicle; GAPDH, glyceraldehyde 3-phosphate dehydrogenase; HC, hepatocyte ; HFHCD, high-fat high-cholesterol diet; LD, lipid droplet; ND, normal chow diet; RGZ, rosiglitazone; TEM, transmission electron microscopy; TFEB, transcription factor EB.
Transcription factor EB is a key mediator of the antifibrotic effect of PPARγ activation in HSCs
Consistent with the effects of PPARγ activation on LC3B and p62, RGZ treatment decreased the total TFEB expression levels in LX-2 cells and primary HSCs. In particular, RGZ treatment decreased the nuclear translocation of TFEB, which exerts its regulatory function, rather than cytoplasmic TFEB (Figure 5A). Similarly, immunostaining showed that RGZ treatment decreased the global TFEB intensity and induced nuclear-TFEB exclusion in LX-2 cells (Figure 5B). In addition, RGZ treatment decreased nuclear-TFEB fluorescence in stable Tfeb-GFP-transfected HeLa cells (Figure 5C).
FIGURE 5.
PPARγ activation ameliorates hepatic fibrosis and reduces autophagy through TFEB downregulation in HSCs. (A) TFEB expressions in LX-2 nucleus and cytoplasm extracts were analyzed using western blotting. Nuclear-TFEB expression was normalized to H3 expression, whereas cyto-TFEB and total-TFEB expressions were normalized to GAPDH expression. Freshly isolated HSCs were in vitro cultured for 5 days and then lysed for protein assay. Western blot analysis was used to assess total TFEB expression in primary HSCs. Relative intensities were normalized to that of GAPDH. (B) RGZ suppressed nuclear translocation of TFEB. LX-2 cells were treated with or without 30 µM RGZ for 18 hours, incubated with Cy3-TFEB (red) and DAPI (blue), and examined under a confocal microscope (scale bars: 10 µm). (C) Tfeb-GFP-transfectants were treated with RGZ, incubated with DAPI (blue), and viewed under a confocal microscope to examine nuclear translocation of TFEB (scale bars: 10 µm). (D) LX-2 cells were transfected with scrambled or Tfeb siRNA for 48 hours and then treated with 30 µM RGZ for 18 hours. Western blot analysis was used to assess TFEB, LC3B, p62, α-SMA, GFAP, and Col1 protein expression, which was normalized to GAPDH expression. Freshly isolated primary HSCs from HFHCD-fed mice were cultured for 5 days in vitro, transfected with scrambled or Tfeb siRNA for 48 hours, and then treated with 30 µM RGZ for 18 hours. Western blot analysis was used to assess TFEB, α-SMA, and Col1 expression in primary HSCs. Relative intensities were normalized to that of GAPDH. (E) Tfeb knockdown blocked HSC activation in LX-2 cells. Cells were incubated with Cy3-α-SMA (red), Cy3-GFAP (red), and DAPI (blue) and examined under a confocal microscope (scale bars: 10 µm). (F) Freshly isolated primary HSCs from HFHCD-fed mice were transfected with scrambled or Tfeb siRNA for 48 hours and then treated with 30 µM RGZ for 18 hours and stained with oil red O (scale bars: 50 µm). (G) LX-2 cells were transfected with Tfeb-expressing plasmid for 24 hours and treated with or without 30 µM RGZ for 18 hours. Western blot analysis was used to assess TFEB, LC3B, p62, α-SMA, GFAP, and Col1 protein expression, which was normalized to GAPDH expression. (H) Immunofluorescence microscopy indicating LC3B and LysoTracker localization in LX-2 cells. Cells transfected with GFP-LC3B (green) vector plasmids were treated with RGZ for 18 hours and stained with 100 µM LysoTracker (red) (scale bars: 10 µm). (I) LX-2 cells transfected with Tfeb-expressing plasmid, then treated with oleic acid and/or RGZ for 24 hours, and stained with oil red O. Freshly isolated primary HSCs from HFHCD-fed mice were in vitro cultured for 5 days, transfected with Tfeb-expressing plasmid, treated with 30 µM RGZ for 18 hours, and stained with oil red O (scale bars: 50 µm). (J) TFEB overexpression offsets the effect of RGZ on fibrosis. (K) Immunocytochemistry shows the expression of fibrotic markers, including Cy3-α-SMA (red) and Cy3-GFAP (red), and DAPI-stained nuclei (blue; scale bars: 10 µm). Abbreviations: α-SMA, α-smooth muscle actin; Col1, collagen1; Cy3, cyanine-3; GAPDH, glyceraldehyde 3-phosphate dehydrogenase; GFAP, glial fibrillary acidic protein; HFHCD, high-fat high-cholesterol diet; OA, oleic acid; PPARγ, peroxisome proliferator-activated receptor γ; RGZ, rosiglitazone; siRNA, small interfering RNA; TFEB, transcription factor EB.
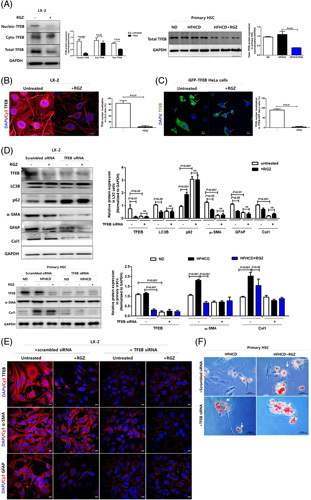
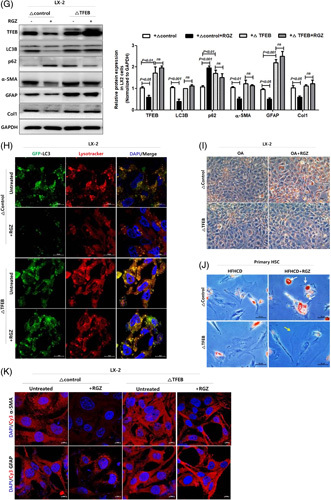
Tfeb knockdown in LX-2 cells and primary HSCs decreased autophagic flux and fibrogenic marker expression in immunoblot and immunostaining (Figure 5D, E) and increased cytoplasmic LDs in primary HSCs (Figure 5F). Conversely, TFEB overexpression in LX-2 cells increased autophagic flux, as determined by LC3B expression in immunoblot and GFP-LC3 and LysoTracker colocalization in immunostaining (Figure 5G, H). In addition, TFEB overexpression activated HSCs, as determined by the decreased cytoplasmic LD count and increased fibrotic marker expression (Figure 5G, I, J). Importantly, TFEB overexpression offset the aforementioned effects of RGZ treatment on autophagic flux, LDs, and fibrogenic marker expression (Figure 5G–K). Collectively, TFEB might be an important target for PPARγ-mediated autophagy suppression and antifibrosis.
Rosiglitazone treatment ameliorates hepatic fibrosis in high-fat high-cholesterol diet-fed mice
During the entire study, despite the higher calorie intake in HFHCD-fed mice than that in ND mice, the body weight did not differ (Figure 6A). In addition, AUC glucose during oral glucose tolerance test and insulin tolerance test were similar between the two groups. However, insulin sensitivity improved slightly but significantly in RGZ-treated HFHCD-fed mice than that in vehicle-treated HFHCD-fed mice (Figure 6B). RGZ treatment decreased serum liver enzyme levels in HFHCD-fed mice. However, serum cholesterol and triglyceride levels did not change significantly in RGZ-treated HFHCD-fed mice (Figure 7A). HFHCD feeding increased liver weight, but no change was observed after RGZ treatment (Figure 7B). Gross morphology, hematoxylin and eosin staining, and oil red O staining of liver sections showed increased liver fat after HFHCD feeding, which was reduced after RGZ treatment (Figure 7C). Liver fat quantification showed similar results after HFHCD feeding and RGZ treatment (Figure 7D). In addition, RGZ treatment improved hepatic steatosis, hepatocellular ballooning, and NAFLD activity scores in HFHCD-fed mice (Figure 7E).
FIGURE 6.
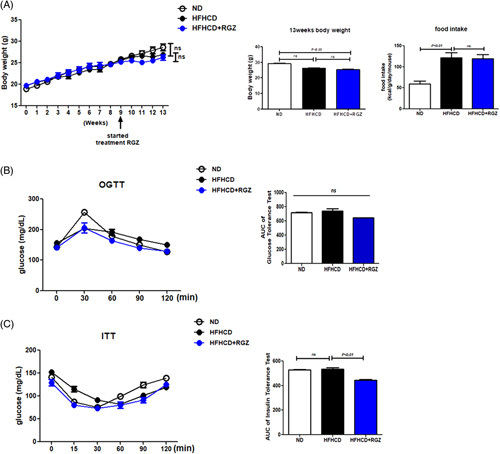
Effects of RGZ treatment on body weight, food intake, and glucose tolerance in HFHCD-fed mice. C57BL/6J mice were fed either ND or HFHCD for 9 weeks, treated with RGZ for 4 weeks, and then euthanized before liver tissue collection (n = 8–15 mice per group). (A) Body weight and food intake. (B) OGTT (2 g/kg) was performed after overnight fasting. Blood glucose levels were measured before and 30, 60, 90, and 120 minutes after glucose administration. (C) After the overnight fast, blood glucose levels were measured before and 15, 30, 60, 90, and 120 minutes after 0.3 U/kg insulin injection. Abbreviations: HFHCD, high-fat high-cholesterol diet; ITT, insulin tolerance test; OGTT, oral glucose tolerance test; ND, normal chow diet; RGZ, rosiglitazone.
FIGURE 7.
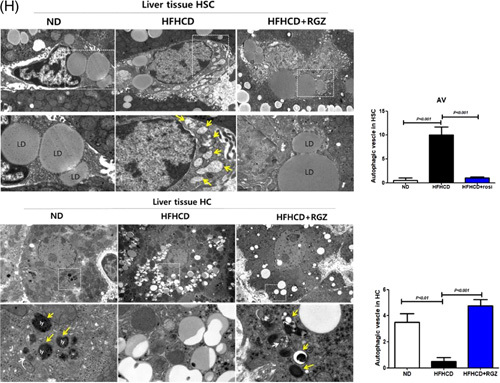
RGZ ameliorates hepatic fibrosis in HFHCD-fed mice. C57BL/6J mice were fed either ND or HFHCD for 9 weeks, then treated with RGZ for 4 weeks, and euthanized before liver tissue collection (n = 8–15 mice per group). (A) Serum AST, ALT, total cholesterol, and triglyceride concentrations were measured. (B) Liver weight and liver: body weight ratio was determined. (C) Changes in liver tissue morphology. Liver gross morphology representatives after staining with oil red O and H and E. (D) Hepatic triglyceride content quantification. (E) Steatosis score, lobular inflammation, ballooning score, and NAS (calculated from individual steatosis, lobular inflammation, and ballooning scores). Results are presented as mean ± SEM. Data were analyzed using 1-way ANOVA. (F) Liver sections stained with Masson trichrome and immunohistochemically stained with α-SMA, GFAP, and Col1 for liver fibrosis analysis. (G) Fibrosis 1a lesion was determined. (H) Mouse liver tissue specimens prepared for TEM. AL (yellow arrowhead), AP (white arrowhead), LD, and Ly (original magnification, 15 K ×) in HSCs and HC (scale bars: 50 µm). Abbreviations: α-SMA, α-smooth muscle actin; AL, autolysosome; ALT, alanine aminotransferase; AP, autophagosome; AST, aspartate aminotransferase; AV, autophagic vesicle; BW, body weight; Col1, collagen1; GFAP, glial fibrillary acidic protein; H and E, hematoxylin and eosin; HC, hepatocyte; HFHCD, high-fat high-cholesterol diet; LD, lipid droplet; Ly, lysosome; NAS, NAFLD activity score; ND, normal chow diet; RGZ, rosiglitazone; TEM, transmission electron microscopy; TG, triglyceride.
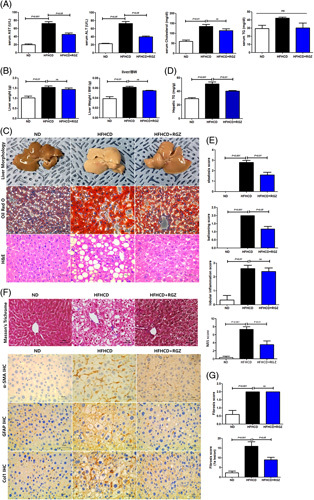
We next determined liver fibrosis in liver tissue. Consistent with the results from primary HSCs, HFHCD feeding increased the expression of fibrogenic markers including α-SMA, GFAP, and collagen type 1 compared with ND feeding, and this effect was reversed after RGZ treatment (Figure 7F). In terms of liver fibrosis, perisinusoidal F1a fibrosis significantly increased after HFHCD feeding, which was improved after RGZ treatment (Figure 7G).
Finally, HFHCD feeding decreased LDs and increased the number of autophagic vesicles in HSCs of liver tissue compared with ND feeding, and these effects were reversed by RGZ treatment. Contrarily, the effects of HFHCD feeding and RGZ treatment on HCs of liver tissue showed opposite results to those from HSCs (Figure 7H).
DISCUSSION
To date, numerous studies have reported the antisteatogenic and antifibrotic effects of PPARγ activation.4 However, the role of PPARγ is complex and different among HCs and nonparenchymal cells. Adenoviral PPARγ overexpression in HCs induces liver steatosis, whereas PPARγ knockout in HCs decreased the triglyceride content in obese mice.12 However, HSC‐specific PPARγ ablation aggravated hepatic inflammation and fibrosis after CCL4 injection.5 Moreover, although the role of PPARγ in HCs seems to be steatogenic, treatment with PPARγ ligands in genetically or diet-induced obese mice improved liver steatosis.4 In addition, treatment with synthetic PPARγ agonists RGZ and pioglitazone reduced hepatic steatosis in patients with NAFLD.13,14 In terms of liver fibrosis, RGZ treatment attenuated the expression of liver fibrosis-related genes, including TGF1β, collagen IV, and collagen I, and sinusoidal fibrosis in a mouse model mimicking human NASH.15 Moreover, RGZ inhibits NF-κB activation and liver fibrosis after bile duct ligation in a PPARγ-dependent manner.16 Furthermore, the direct effects of PPARγ agonists on HSCs have also been determined. In human HSCs, GW7845 inhibits the TGFβ1/Smad3-dependent expression of extracellular matrix-related genes including PAI-1 and collagen-1αI.17 In addition, PPARγ activation with 15-deoxy-D12,14-prostaglandin J2 or troglitazone inhibited HSC proliferation and platelet-derived growth factor-induced chemotaxis and monocyte chemotactic protein 1 expression.18
Because the role of autophagy in liver fibrosis is inconclusive and it was reported that nuclear-TFEB expression is decreased gradually in human steatosis and NASH samples,19 we sought to investigate another mechanism of antifibrotic effects of PPARγ activation and suggest a novel mechanism of RGZ-mediated reduction of activation of TFEB, a master regulator of autophagy and lysosomal biogenesis, and autophagy in HSCs and liver fibrosis. We first identified whether autophagy modulation could affect HSC phenotype. Atg7 knockdown suppressed HSC activation, as determined by increased cytoplasmic LDs and decreased fibrotic marker expression; conversely, Atg7 overexpression transdifferentiated HSCs from a quiescent state into myofibroblast-like phenotype. Notably, genetic modulation of Tfeb showed similar effects on HSC activation to those of Atg7 knockdown or overexpression. Next, we sought to determine whether PPARγ activation affects autophagy in HSCs. BODIPY 493/503 and mRFP–LC3 signals merged, GFP-LC3 colocalized with LysoTracker in acidic organelles, and LC3B and total and activated TFEB were highly expressed in untreated cells, as indicated using immunoblot and immunostaining. However, the aforementioned upregulated autophagy and/or lipophagy in activated HSCs were suppressed by RGZ-mediated PPARγ activation and/or PPARγ plasmid transfection. Finally, TFEB overexpression in LX-2 cells offset the beneficial effects of RGZ on GFP–LC3 colocalization with LysoTracker and fibrogenic marker expression. In addition, as the antifibrotic effects of RGZ were not observed after GW9662 cotreatment and all in vitro and in vivo experiments were performed in the fasting state, which activates nutrient-sensing mTORC1 signaling, RGZ-mediated autophagy suppression might be PPARγ dependent and mTORC1 independent.
In this study, the effects of RGZ treatment on HCs and HSCs were completely opposite. HFHCD feeding increased cytoplasmic LDs and decreased autophagic vesicle number in both primary HCs and HCs in liver tissues, which were restored after RGZ treatment. In contrast, HFHCD feeding decreased cytoplasmic LDs and increased autophagic vesicle number in both primary HSCs and HSCs in liver tissues, which were also restored after RGZ treatment. Therefore, the effects of RGZ-mediated PPARγ activation on autophagy may be cell-type–specific and could be different among diverse types of liver cells at least at a certain period of time. The role of autophagy on liver fibrosis is cell-type–specific, and thus can be beneficial or detrimental.20 In general, autophagy in HCs is regarded as a protective pathway and antifibrotic. Hepatocyte-specific Atg7 knockout mice were vulnerable to TNF-mediated liver injury by caspase 8 activation and mitochondrial death pathway.21 Furthermore, hepatocyte-specific Atg5 knockout mice showed an extensive collagen deposition in liver, and the expression of profibrotic genes including collagen type 1, connective tissue growth factor, TGFβ1, and α-SMA increased through p62 accumulation and Nrf2 activation.22 However, autophagy in HSCs can be detrimental and induce liver fibrosis. During mouse HSC culture, HSCs were activated and autophagic flux was increased; however, autophagy inhibition in mouse and human HSCs with bafilomycin A1 decreased cell proliferation and activation marker expression.23 Another study has argued that autophagy provides the energy required for HSC activation through LD mobilization, free fatty acid release, and mitochondrial β-oxidation. Moreover, genetic inhibition of autophagy in HSCs, Atg7 F/F -GFAP-Cre mice resulted in reduced HSC activation and liver fibrosis due to CCl4 or thioacetamide-induced liver injury.7 Based on the aforementioned possible different roles of autophagy in liver fibrosis in various liver cell types, such as HCs and HSCs, simple autophagy upregulation or downregulation might not be optimal to treat NAFLD at least at a single time point. Thus, like the selective estrogen receptor modulator to treat osteoporosis, which binds to estrogen receptors and acts as both an agonist or an antagonist depending on the target tissue,24 modulating specific cell type autophagy instead of upregulating or downregulating autophagy on all occasions is more appropriate to treat NAFLD more efficiently and cover diverse disease stages from simple steatosis to liver fibrosis and HCC.
Although the role of hyperinsulinemia and hyperglycemia on HSC activation remains inconclusive, at least in vitro, many studies have reported the associations between hyperinsulinemia and hyperglycemia and HSC activation. For instance, insulin treatment transdifferentiates freshly isolated quiescent HSCs into activated HSCs, as determined by the reduced LD contents.25 In addition, high-concentration glucose-stimulated type I collagen production and proliferation in HSCs. In this study, administering high-concentration glucose to HSCs induced reactive oxygen species production through protein kinase C-dependent NADPH oxidase activation and stimulated mitogen-activated protein kinase phosphorylation.26 Furthermore, administering high-concentration glucose activates protein inhibitor of activated STAT 4-mediated sirtuin 1 repression in cultured primary mouse HSCs, which stimulates SMAD3 binding to fibrogenic gene promoters.27 RGZ is a well-known antidiabetic drug that reduces blood sugar levels mainly by improving insulin sensitivity in insulin target tissues.28 In this study, HFHCD-fed mice did not show any glucose intolerance. In addition, systemic insulin sensitivity assessed by insulin tolerance test did not differ between HFHCD and ND-fed mice (Figure 6). These findings are in agreement with previous reports,29,30 and thus according to our experiments, improvements in glucose tolerance and/or insulin sensitivity might not be the main mechanism to suppress RGZ-mediated HSC activation.
Several issues should be considered with caution for interpreting our results. First, although we performed in vitro experiments to dissect the role of PPARγ activation on HSC activation and liver fibrosis, resident liver cells interact closely. Thus, we could not completely exclude the paracrine signals from other liver cell populations including HCs, liver sinusoidal endothelial cells, Kupffer cells, and natural killer/natural killer T cells to HSCs that indirectly regulate HSCs transdifferentiation and activation.31 Second, the antifibrotic effect of PPARγ agonist may differ by the time of treatment and disease severity.32 In advanced stages of liver fibrosis such as bridging fibrosis, PPARγ expression levels decrease with prolonged HSC activation. In this situation, receptor availability for PPARγ agonists decreases and antifibrotic effect of PPARγ agonists could be minimal. In our mouse model, no bridging fibrosis was observed and liver fibrosis was mainly confined to the perisinusoidal area, which is consistent with the results of a previous report.33 Therefore, autophagy-modulating antifibrotic mechanism of RGZ reported in this study may not be applicable to the advanced stages of liver fibrosis. Third, a possible antifibrotic action of autophagy in HSCs has also been suggested.34 Excess autophagy may promote HSC death, degradation of profibrotic factors including collagens and metalloproteinases, or diminish the release of exosomes with profibrotic signals. Thus, the role of autophagy in HSC activation seems to be complex and it could have dual action depending on autophagy duration and severity.
CONCLUSION
RGZ-mediated PPARγ activation suppresses TFEB activation and subsequently decreases autophagy, thus reducing HSC activation and liver fibrosis. Our data further suggest that the effect of RGZ is cell-type–specific and ameliorates both hepatic steatosis and fibrosis in diet-induced obese mice. Further studies are needed to apply our bench results in humans to disclose the dual action of PPARγ and autophagy on NAFLD treatment.
Supplementary Material
AUTHOR CONTRIBUTIONS
Yunjin J. Yum and Jin Yoo: designed, performed, analyzed experiments, and wrote the manuscript. Kyuhoon Bang: performed and analyzed experiments. Ji Eun Jun, In-Kyung Jeong, Kyu Jeung Ahn, and Ho Yeon Chung: designed experiments and analyzed data. You-Cheol Hwang: supervised the study and revised the manuscript.
ACKNOWLEDGMENTS
The authors thank Myung-Shik Lee (Soonchunhyang University) for providing stable tfeb-GFP-transfected HeLa cells and Keun-Gyu Park (Kyungpook National University) for providing LX-2 cells.
CONFLICTS OF INTEREST
The authors have no conflicts to report.
Footnotes
Funding information This work was supported by the Bio and Medical Technology Development Program of the National Research Foundation (NRF) funded by the Korean government (MSIT) (No. 2018-M3A9E807881113) and NRF grant (No. 2022R1A2C2009221) funded by the Korean government (MEST).
Abbreviations: α-SMA, α-smooth muscle actin; AL, autolysosome; ALT, alanine aminotransferase; AP, autophagosome; AST, aspartate aminotransferase; Col1, collagen1; Cy3, cyanine-3; GAPDH, glyceraldehyde 3-phosphate dehydrogenase; GFAP, glial fibrillary acidic protein; H and E, hematoxylin and eosin; HC, hepatocyte; HFHCD, high-fat high-cholesterol diet; ITT, insulin tolerance test; LD, lipid droplet; Ly, lysosome; NAS, NAFLD activity scores; ND, normal chow diet; ob, obese; OGTT, oral glucose tolerance test; PPARγ, peroxisome proliferator-activated receptor γ; RGZ, rosiglitazone; siRNA, small interfering RNA; TEM, transmission electron microscopy; TFEB, transcription factors EB.
Yunjin J. Yum and Jin Yoo contributed equally to this work as the first authors.
Supplemental Digital Content is available for this article. Direct URL citations are provided in the HTML and PDF versions of this article on the journal's website, www.hepcommjournal.com.
Contributor Information
Yunjin J. Yum, Email: joanneyum23@gmail.com.
Jin Yoo, Email: nakrang83@naver.com.
Kyuhoon Bang, Email: bkh0552@naver.com.
Ji Eun Jun, Email: woshi98@naver.com.
In-Kyung Jeong, Email: jik1016@naver.com.
Kyu Jeung Ahn, Email: ahnkj@khu.ac.kr.
Ho Yeon Chung, Email: chy1009@hotmail.com.
You-Cheol Hwang, Email: khmcilyong@naver.com.
REFERENCES
- 1. Younossi ZM, Koenig AB, Abdelatif D, Fazel Y, Henry L, Wymer M. Global epidemiology of nonalcoholic fatty liver disease-Meta-analytic assessment of prevalence, incidence, and outcomes. Hepatology. 2016;64:73–84. [DOI] [PubMed] [Google Scholar]
- 2. Adams LA, Lymp JFSt, Sauver J, Sanderson SO, Lindor KD, Feldstein A, et al. The natural history of nonalcoholic fatty liver disease: a population-based cohort study. Gastroenterology. 2005;129:113–21. [DOI] [PubMed] [Google Scholar]
- 3. Tsuchida T, Friedman SL. Mechanisms of hepatic stellate cell activation. Nat Rev Gastroenterol Hepatol. 2017;14:397–411. [DOI] [PubMed] [Google Scholar]
- 4. Skat-Rordam J, Hojland Ipsen D, Lykkesfeldt J, Tveden-Nyborg P. A role of peroxisome proliferator-activated receptor gamma in non-alcoholic fatty liver disease. Basic Clin Pharmacol Toxicol. 2019;124:528–37. [DOI] [PMC free article] [PubMed] [Google Scholar]
- 5. Moran-Salvador E, Titos E, Rius B, Gonzalez-Periz A, Garcia-Alonso V, Lopez-Vicario C, et al. Cell-specific PPARgamma deficiency establishes anti-inflammatory and anti-fibrogenic properties for this nuclear receptor in non-parenchymal liver cells. J Hepatol. 2013;59:1045–53. [DOI] [PubMed] [Google Scholar]
- 6. Singh R, Kaushik S, Wang Y, Xiang Y, Novak I, Komatsu M, et al. Autophagy regulates lipid metabolism. Nature. 2009;458:1131–5. [DOI] [PMC free article] [PubMed] [Google Scholar]
- 7. Hernández-Gea V, Ghiassi-Nejad Z, Rozenfeld R, Gordon R, Fiel MI, Yue Z, et al. Autophagy releases lipid that promotes fibrogenesis by activated hepatic stellate cells in mice and in human tissues. Gastroenterology. 2012;142:938–46. [DOI] [PMC free article] [PubMed] [Google Scholar]
- 8. Gao J, Wei B, de Assuncao TM, Liu Z, Hu X, Ibrahim S, et al. Hepatic stellate cell autophagy inhibits extracellular vesicle release to attenuate liver fibrosis. J Hepatol. 2020;73:1144–54. [DOI] [PMC free article] [PubMed] [Google Scholar]
- 9. Yoo J, Jeong IK, Ahn KJ, Chung HY, Hwang YC. Fenofibrate, a PPARα agonist, reduces hepatic fat accumulation through the upregulation of TFEB-mediated lipophagy. Metabolism. 2021;120:154798. [DOI] [PubMed] [Google Scholar]
- 10. Xu L, Hui AY, Albanis E, Arthur MJ, O’Byrne SM, Blaner WS, et al. Human hepatic stellate cell lines, LX-1 and LX-2: new tools for analysis of hepatic fibrosis. Gut. 2005;54:142–51. [DOI] [PMC free article] [PubMed] [Google Scholar]
- 11. Jin Y, Bai Y, Ni H, Qiang L, Ye L, Shan Y, et al. Activation of autophagy through calcium-dependent AMPK/mTOR and PKCθ pathway causes activation of rat hepatic stellate cells under hypoxic stress. FEBS Lett. 2016;590:672–82. [DOI] [PubMed] [Google Scholar]
- 12. Matsusue K, Haluzik M, Lambert G, Yim SH, Gavrilova O, Ward JM, et al. Liver-specific disruption of PPARgamma in leptin-deficient mice improves fatty liver but aggravates diabetic phenotypes. J Clin Invest. 2003;111:737–47. [DOI] [PMC free article] [PubMed] [Google Scholar]
- 13. Aithal GP, Thomas JA, Kaye PV, Lawson A, Ryder SD, Spendlove I, et al. Randomized, placebo-controlled trial of pioglitazone in nondiabetic subjects with nonalcoholic steatohepatitis. Gastroenterology. 2008;135:1176–84. [DOI] [PubMed] [Google Scholar]
- 14. Ratziu V, Giral P, Jacqueminet S, Charlotte F, Hartemann-Heurtier A, Serfaty L, et al. Rosiglitazone for nonalcoholic steatohepatitis: one-year results of the randomized placebo-controlled Fatty Liver Improvement with Rosiglitazone Therapy (FLIRT) Trial. Gastroenterology. 2008;135:100–110. [DOI] [PubMed] [Google Scholar]
- 15. Gupte AA, Liu JZ, Ren Y, Minze LJ, Wiles JR, Collins AR, et al. Rosiglitazone attenuates age- and diet-associated nonalcoholic steatohepatitis in male low-density lipoprotein receptor knockout mice. Hepatology. 2010;52:2001–11. [DOI] [PMC free article] [PubMed] [Google Scholar]
- 16. Wei Z, Zhao D, Zhang Y, Chen Y, Zhang S, Li Q, et al. Rosiglitazone ameliorates bile duct ligation-induced liver fibrosis by down-regulating NF-kappaB-TNF-alpha signaling pathway in a PPARgamma-dependent manner. Biochem Biophys Res Commun. 2019;519:854–60. [DOI] [PubMed] [Google Scholar]
- 17. Zhao C, Chen W, Yang L, Chen L, Stimpson SA, Diehl AM. PPARgamma agonists prevent TGFbeta1/Smad3-signaling in human hepatic stellate cells. Biochem Biophys Res Commun. 2006;350:385–91. [DOI] [PMC free article] [PubMed] [Google Scholar]
- 18. Marra F, Efsen E, Romanelli RG, Caligiuri A, Pastacaldi S, Batignani G, et al. Ligands of peroxisome proliferator-activated receptor gamma modulate profibrogenic and proinflammatory actions in hepatic stellate cells. Gastroenterology. 2000;119:466–78. [DOI] [PubMed] [Google Scholar]
- 19. Kim SH, Kim G, Han DH, Lee M, Kim I, Kim B, et al. Ezetimibe ameliorates steatohepatitis via AMP activated protein kinase-TFEB-mediated activation of autophagy and NLRP3 inflammasome inhibition. Autophagy. 2017;13:1767–81. [DOI] [PMC free article] [PubMed] [Google Scholar]
- 20. Hung TM, Hsiao CC, Lin CW, Lee PH. Complex cell type-specific roles of autophagy in liver fibrosis and cirrhosis. Pathogens. 2020;9:225. [DOI] [PMC free article] [PubMed] [Google Scholar]
- 21. Amir M, Zhao E, Fontana L, Rosenberg H, Tanaka K, Gao G, et al. Inhibition of hepatocyte autophagy increases tumor necrosis factor-dependent liver injury by promoting caspase-8 activation. Cell Death Differ. 2013;20:878–887. [DOI] [PMC free article] [PubMed] [Google Scholar]
- 22. Ni HM, Woolbright BL, Williams J, Copple B, Cui W, Luyendyk JP, et al. Nrf2 promotes the development of fibrosis and tumorigenesis in mice with defective hepatic autophagy. J Hepatol. 2014;61:617–25. [DOI] [PMC free article] [PubMed] [Google Scholar]
- 23. Thoen LF, Guimarães EL, Dollé L, Mannaerts I, Najimi M, Sokal E, et al. A role for autophagy during hepatic stellate cell activation. J Hepatol. 2011;55:1353–60. [DOI] [PubMed] [Google Scholar]
- 24. Dutertre M, Smith CL. Molecular mechanisms of selective estrogen receptor modulator (SERM) action. J Pharmacol Exp Ther. 2000;295:431–7. [PubMed] [Google Scholar]
- 25. Lin J, Zheng S, Chen A. Curcumin attenuates the effects of insulin on stimulating hepatic stellate cell activation by interrupting insulin signaling and attenuating oxidative stress. Lab Invest. 2009;89:1397–409. [DOI] [PMC free article] [PubMed] [Google Scholar]
- 26. Sugimoto R, Enjoji M, Kohjima M, Tsuruta S, Fukushima M, Iwao M, et al. High glucose stimulates hepatic stellate cells to proliferate and to produce collagen through free radical production and activation of mitogen-activated protein kinase. Liver Int. 2005;25:1018–26. [DOI] [PubMed] [Google Scholar]
- 27. Sun L, Fan Z, Chen J, Tian W, Li M, Xu H, et al. Transcriptional repression of SIRT1 by protein inhibitor of activated STAT 4 (PIAS4) in hepatic stellate cells contributes to liver fibrosis. Sci Rep. 2016;6:28432. [DOI] [PMC free article] [PubMed] [Google Scholar]
- 28. Olefsky JM. Treatment of insulin resistance with peroxisome proliferator-activated receptor gamma agonists. J Clin Invest. 2000;106:467–72. [DOI] [PMC free article] [PubMed] [Google Scholar]
- 29. Liang H, Jiang F, Cheng R, Luo Y, Wang J, Luo Z, et al. A high-fat diet and high-fat and high-cholesterol diet may affect glucose and lipid metabolism differentially through gut microbiota in mice. Exp Anim. 2021;70:73–83. [DOI] [PMC free article] [PubMed] [Google Scholar]
- 30. Matsuzawa N, Takamura T, Kurita S, Misu H, Ota T, Ando H, et al. Lipid-induced oxidative stress causes steatohepatitis in mice fed an atherogenic diet. Hepatology. 2007;46:1392–403. [DOI] [PubMed] [Google Scholar]
- 31. Cai X, Wang J, Wang J, Zhou Q, Yang B, He Q, et al. Intercellular crosstalk of hepatic stellate cells in liver fibrosis: New insights into therapy. Pharmacol Res. 2020;155:104720. [DOI] [PubMed] [Google Scholar]
- 32. Kawaguchi K, Sakaida I, Tsuchiya M, Omori K, Takami T, Okita K. Pioglitazone prevents hepatic steatosis, fibrosis, and enzyme-altered lesions in rat liver cirrhosis induced by a choline-deficient L-amino acid-defined diet. Biochem Biophys Res Commun. 2004;315:187–95. [DOI] [PubMed] [Google Scholar]
- 33. Savard C, Tartaglione EV, Kuver R, Haigh WG, Farrell GC, Subramanian S, et al. Synergistic interaction of dietary cholesterol and dietary fat in inducing experimental steatohepatitis. Hepatology. 2013;57:81–92. [DOI] [PMC free article] [PubMed] [Google Scholar]
- 34. Lucantoni F, Martínez-Cerezuela A, Gruevska A, Moragrega ÁB, Víctor VM, Esplugues JV, et al. Understanding the implication of autophagy in the activation of hepatic stellate cells in liver fibrosis: are we there yet? J Pathol. 2021;254:216–28. [DOI] [PubMed] [Google Scholar]
Associated Data
This section collects any data citations, data availability statements, or supplementary materials included in this article.