Abstract
Rat models have assumed an increasingly important role in cardiac research. However, a detailed profile of regional cardiac mechanics, such as strains and torsion, is lacking in rats. We hypothesized that healthy rat left ventricles (LV) exhibit regional differences in cardiac mechanics, which are part of normal function. In this study, images of the LV were obtained with 3D cine displacement encoding with stimulated echoes (DENSE) cardiovascular magnetic resonance (CMR) in 10 healthy rats. To evaluate regional cardiac mechanics, the LV was divided into basal, mid-ventricular, and apical regions. The myocardium at the mid-LV was further partitioned into four wall segments (i.e., septal, inferior, lateral, and anterior) and three transmural layers (i.e., sub-endocardium, mid-myocardium, and sub-epicardium). The 6 Lagrangian strain components (i.e., Err, Ecc, Ell, Ecl, Erl, and Ecr) were computed from the 3D displacement field and averaged within each region of interest. Torsion was quantified using the circumferential-longitudinal shear angle. While peak systolic Ecl differed between the mid-ventricle and apex, the other 5 components of peak systolic strain were similar across the base, mid-ventricle, and apex. In the mid-LV myocardium, Ecc decreased gradually from the sub-endocardial to the sub-epicardial layer. Ell demonstrated significant differences between the four wall segments with the largest magnitude in the inferior segment. Err was uniform among the four wall segments. Ecl varied along the transmural direction and among wall segments, whereas Erl differed only among the wall segments. Erc was not associated with significant variations. Torsion also varied along the transmural direction and among wall segments. These results provide fundamental insights into the regional contractile function of healthy rat hearts, and form the foundation for future studies on regional changes induced by disease or treatments.
Keywords: 3D cine DENSE CMR, strain, torsion, rat
INTRODUCTION
Rat models have been increasingly used in cardiac research to better understand the progression of heart disease, including myocardial infarction and age-associated heart failure [1–3]. Previous studies have reported transmural differences in ventricular mechanics during disease development [4–7], which were linked to adverse changes in cardiac output and dyssynchrony. In addition, it has been shown that ventricular myocardium from different regions of the heart respond differently to pharmacological treatments [5]. These findings highlight the need for accurate normative data (including 3D strain and ventricular torsion) in order to assess regional changes in cardiac performance due to disease and treatment. Since this information is currently lacking for rat models, a detailed characterization of normal cardiac mechanics in the left ventricle (LV) of healthy rats, therefore, is of considerable importance.
Cardiovascular magnetic resonance (CMR) has emerged as the gold standard method for non-invasively tracking LV motion. Compared to other common non-invasive methods, such as echocardiography, CMR is generally considered to be more accurate and reproducible [8]. With cine imaging and tissue tracking methods, CMR is able to quantify not only the LV volume, stroke volume, ejection fraction, and wall thickening, but also the myocardial strain, twist, and torsion [9]. Current CMR tissue tracking methods include myocardial tagging [10], harmonic phase analysis (HARP) [11], velocity encoded phase contrast [12], and displacement encoding with stimulated echoes (DENSE) [13, 14]. Previous studies have measured principal strains and/or torsion in normal healthy rats using HARP and DENSE, respectively [15, 16]. Results from these studies, however, were in 2 dimensions. Moreover, detailed transmural patterns of cardiac mechanics, especially at the mid-ventricle, were neglected in these studies.
In the present study, we hypothesized that healthy rat LVs exhibit regional differences in cardiac mechanics. For this purpose, 3D cine DENSE CMR, which provides the advantages of high strain resolution, high displacement accuracy, and rapid post-processing, was performed to quantify the regional distribution of 3D myocardial mechanics (i.e., Lagrangian strains and ventricular torsion) in healthy rat LVs. Inter-observer reproducibility was also quantified. The results of the present study provide fundamental insights into regional contractile function of the LV myocardium in rats, which is currently lacking in the literature, and will facilitate future experimental and computational investigation of heart disease in rat models.
METHODS
Animal preparation
10 female Sprague-Dawley rats (~6 months; Harlan) were used in this study. Animals were anesthetized with 2.5% isoflurane in oxygen at a rate of 1.5 L/min. Cutaneous ECG electrodes were placed on three legs for cardiac gating. Respiratory gating was performed with a respiratory sensor placed underneath the abdomen. Body temperature was monitored with a rectal thermometer and maintained at 36±1 °C with a customized heating pad. All vital signs including heart rate (334±7 beats per minute), respiratory rate (32±2 per minute) and body temperature were monitored with a fiber optic system (SA Instruments, Inc, Stony Brook, NY). All animal procedures were approved by the Institutional Animal Care and Use Committee at the University of Kentucky and were in agreement with the National Institute of Health’s guidelines for the care and use of laboratory animals (NIH Publication 85–23, revised 1996).
CMR image acquisition
CMR was performed on a 7-Tesla Bruker ClinScan system (Bruker, Ettlingen, Germany) equipped with a 2 × 2 hydrogen phased-array coil and a gradient system (strength: 450 mT/m; slew rate: 4500 T/m/s). Multi-slice 3D encoded spiral cine DENSE (i.e., 3D cine DENSE) CMR was performed for image acquisition as described previously [9, 17]. Briefly, immediately following an ECG R-wave trigger detection, a displacement encoding module, which consists of radiofrequency and gradient pulses, was applied to store position-encoded longitudinal magnetization. This was followed by successive applications of a readout module, which employed a radiofrequency excitation pulse (constant flip angle = 20 degrees), a displacement un-encoding gradient, and an interleaved spiral k-space trajectory. As a result, a magnitude image was constructed and three phase images were independently encoded for ‘x’, ‘y’, and ‘z’ displacements, respectively, at each frame (Figure 1) via balanced encoding [18]. For each animal, a total of 17–22 frames per cardiac cycle were collected using both cardiac and respiratory gating with a repetition time of 7.4 ms and an echo time of 1 ms. Other relevant acquisition parameters included: pixel size = 0.357 × 0.357 mm, field of view = 50 × 50 mm, slice thickness = 1.3 mm, spiral interleaves = 36, and displacement encoding frequency = 0.3 cycles/mm.
Figure 1. Representative end-systolic 3D cine DENSE CMR images and end-systolic strain maps from one mid-ventricular short-axis slice of a rat left ventricle.
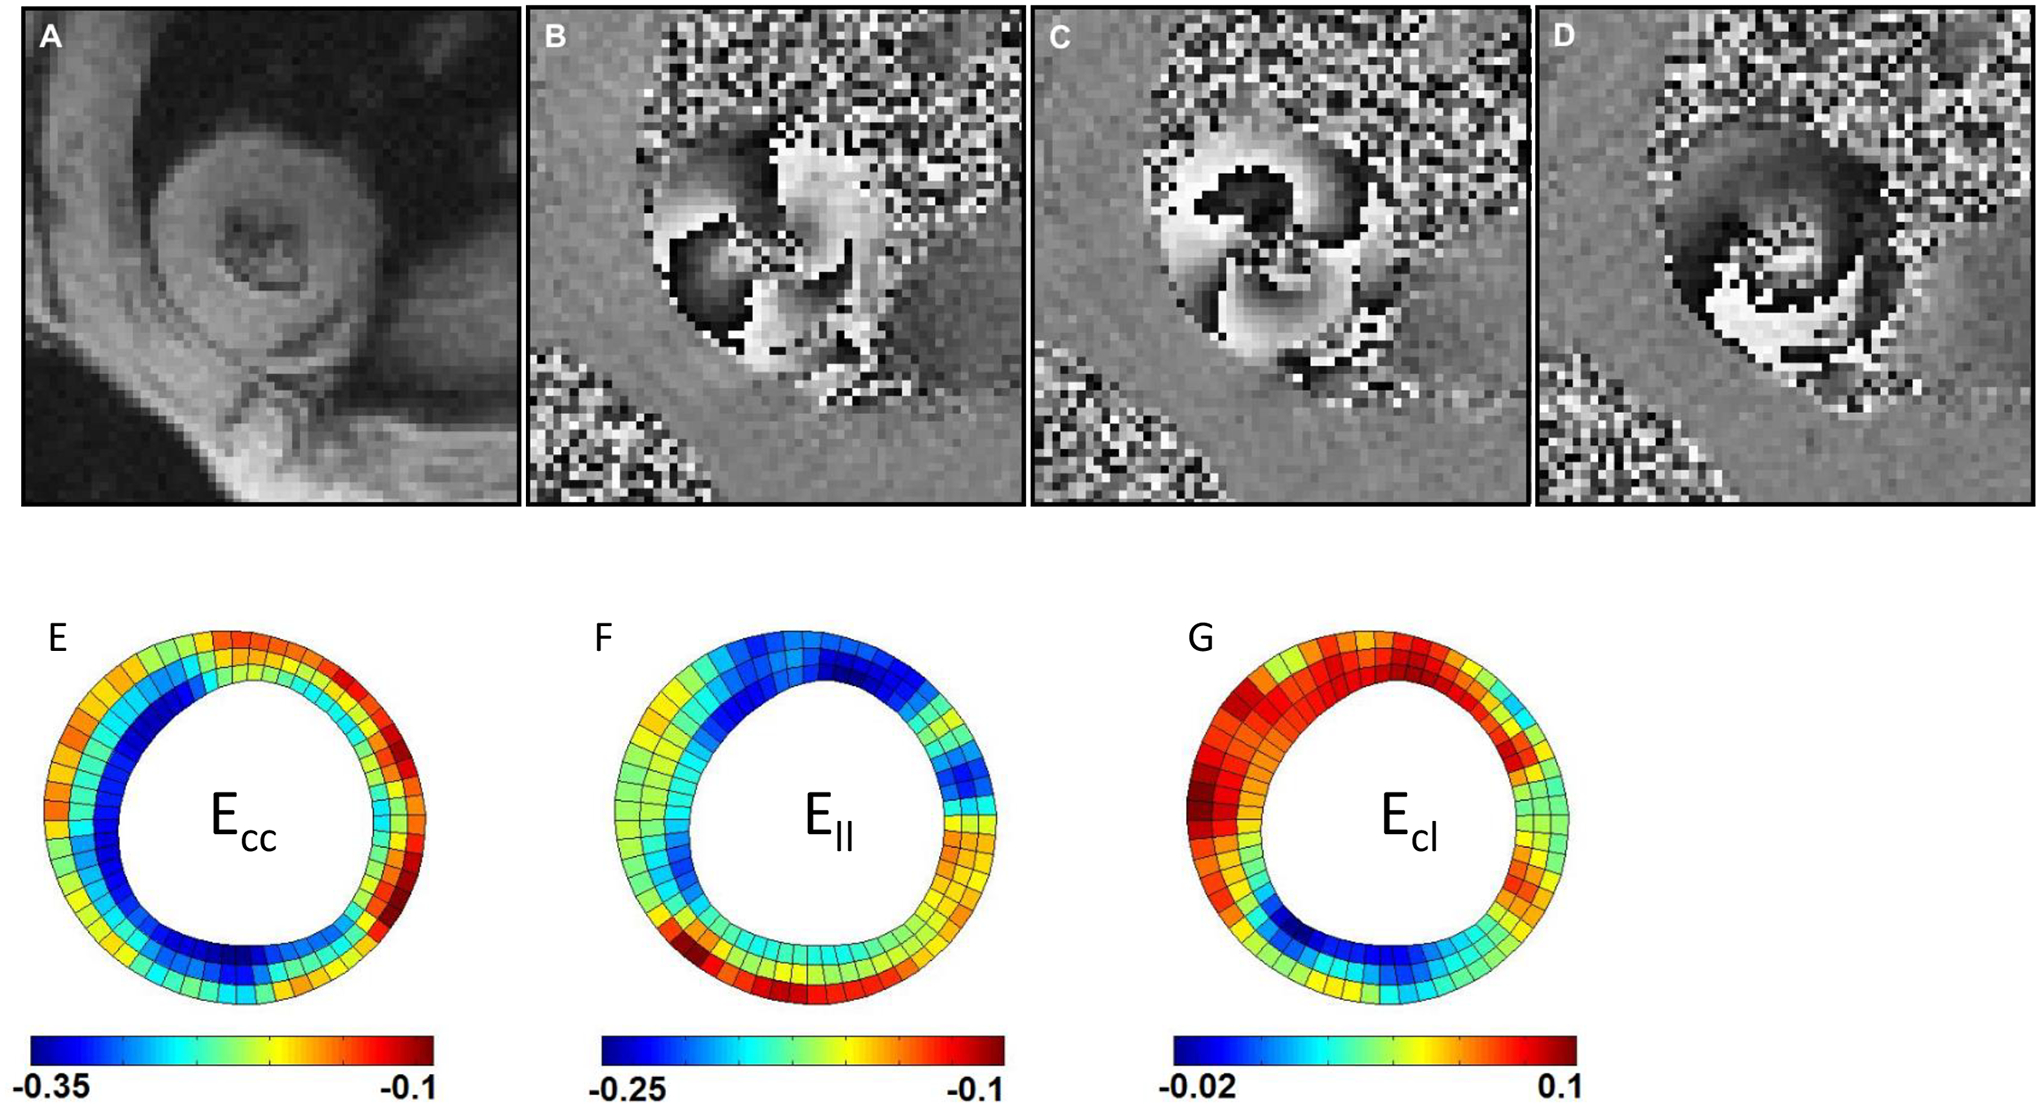
(A) A magnitude-reconstructed image; (B) a phase image encoded for x-displacement; (C) a phase image encoded for y-displacement; (D) a phase image encoded for z-displacement; (E) example of Ecc strain distribution; (F) example of Ell strain distribution; (G) example of Ecl strain distribution. Note: Panels (E), (F), and (G) each have their own distinct scale bar.
To consistently visualize the majority of the LV wall throughout the entire cardiac cycle, 5–6 short-axis slices without slice gaps were defined, depending on the ventricular size, at end systole (ES) to cover approximately 80% of end-systolic ventricular length. Both 4-chamber and 2-chamber long-axis images were also acquired. The average acquisition time of 3D cine DENSE CMR images was around 30 minutes for each animal.
Image analysis
The displacement-encoded phase images were analyzed offline using DENSEanalysis, an open-source application available at www.denseanalysis.com [19, 20] that has been used to investigate the 3D myocardial mechanics in mice [9]. The myocardium was segmented from the blood pool and surrounding tissue using a semi-automated motion-guided segmentation method [21], for which manual correction was performed as needed. It should be noted that the papillary muscles were identified and excluded from myocardial contours by displaying the short-axis contours in the long-axis images. Moreover, the abnormal segments of myocardial contours caused by noise in the phase images were also marked and excluded from the strain calculation. Following semi-automatic phase unwrapping, 3D displacement of each pixel throughout the cardiac cycle was derived with a tissue tracking technique [9, 20]. The components of the 3D Lagrangian finite strain tensor were derived in polar coordinates, relative to the referential frame at end diastole (ED; i.e., the first time frame), which consisted of 6 components: radial strain Err, circumferential strain Ecc, longitudinal strain Ell, and 3 shear strains (Ecl, Erl, and Ecr) [9]. Details related to the calculation of the displacement field, deformation gradient tensor, and Lagrangian strain tensor are provided in [9, 19].
Left ventricular torsion was represented as the circumferential-longitudinal (CL) shear angle αCL between the basal and apical slices from ED to the time point of interest, and was computed using 3 strain components as follows [22]:
In order to evaluate the regional distribution of cardiac mechanics, the ventricle was initially divided into basal, mid-ventricular, and apical regions. For a more in-depth analysis, the myocardium at the mid-LV was divided into four wall segments (i.e., septal, inferior, lateral, and anterior segments) (Figure 2). Specifically, the septum was identified as the segment between the two right ventricular insertion points; the remaining wall was then divided into thirds for the other three regions. Moreover, each segment was partitioned equally into three transmural layers (i.e., sub-endocardium, mid-myocardium, and sub-epicardium). The strain and CL shear angle were then averaged within each region of interest. All of the regional segmenting was performed in DENSEanalysis, which allowed for the partitioning of the LV in the longitudinal, circumferential, and transmural directions.
Figure 2.
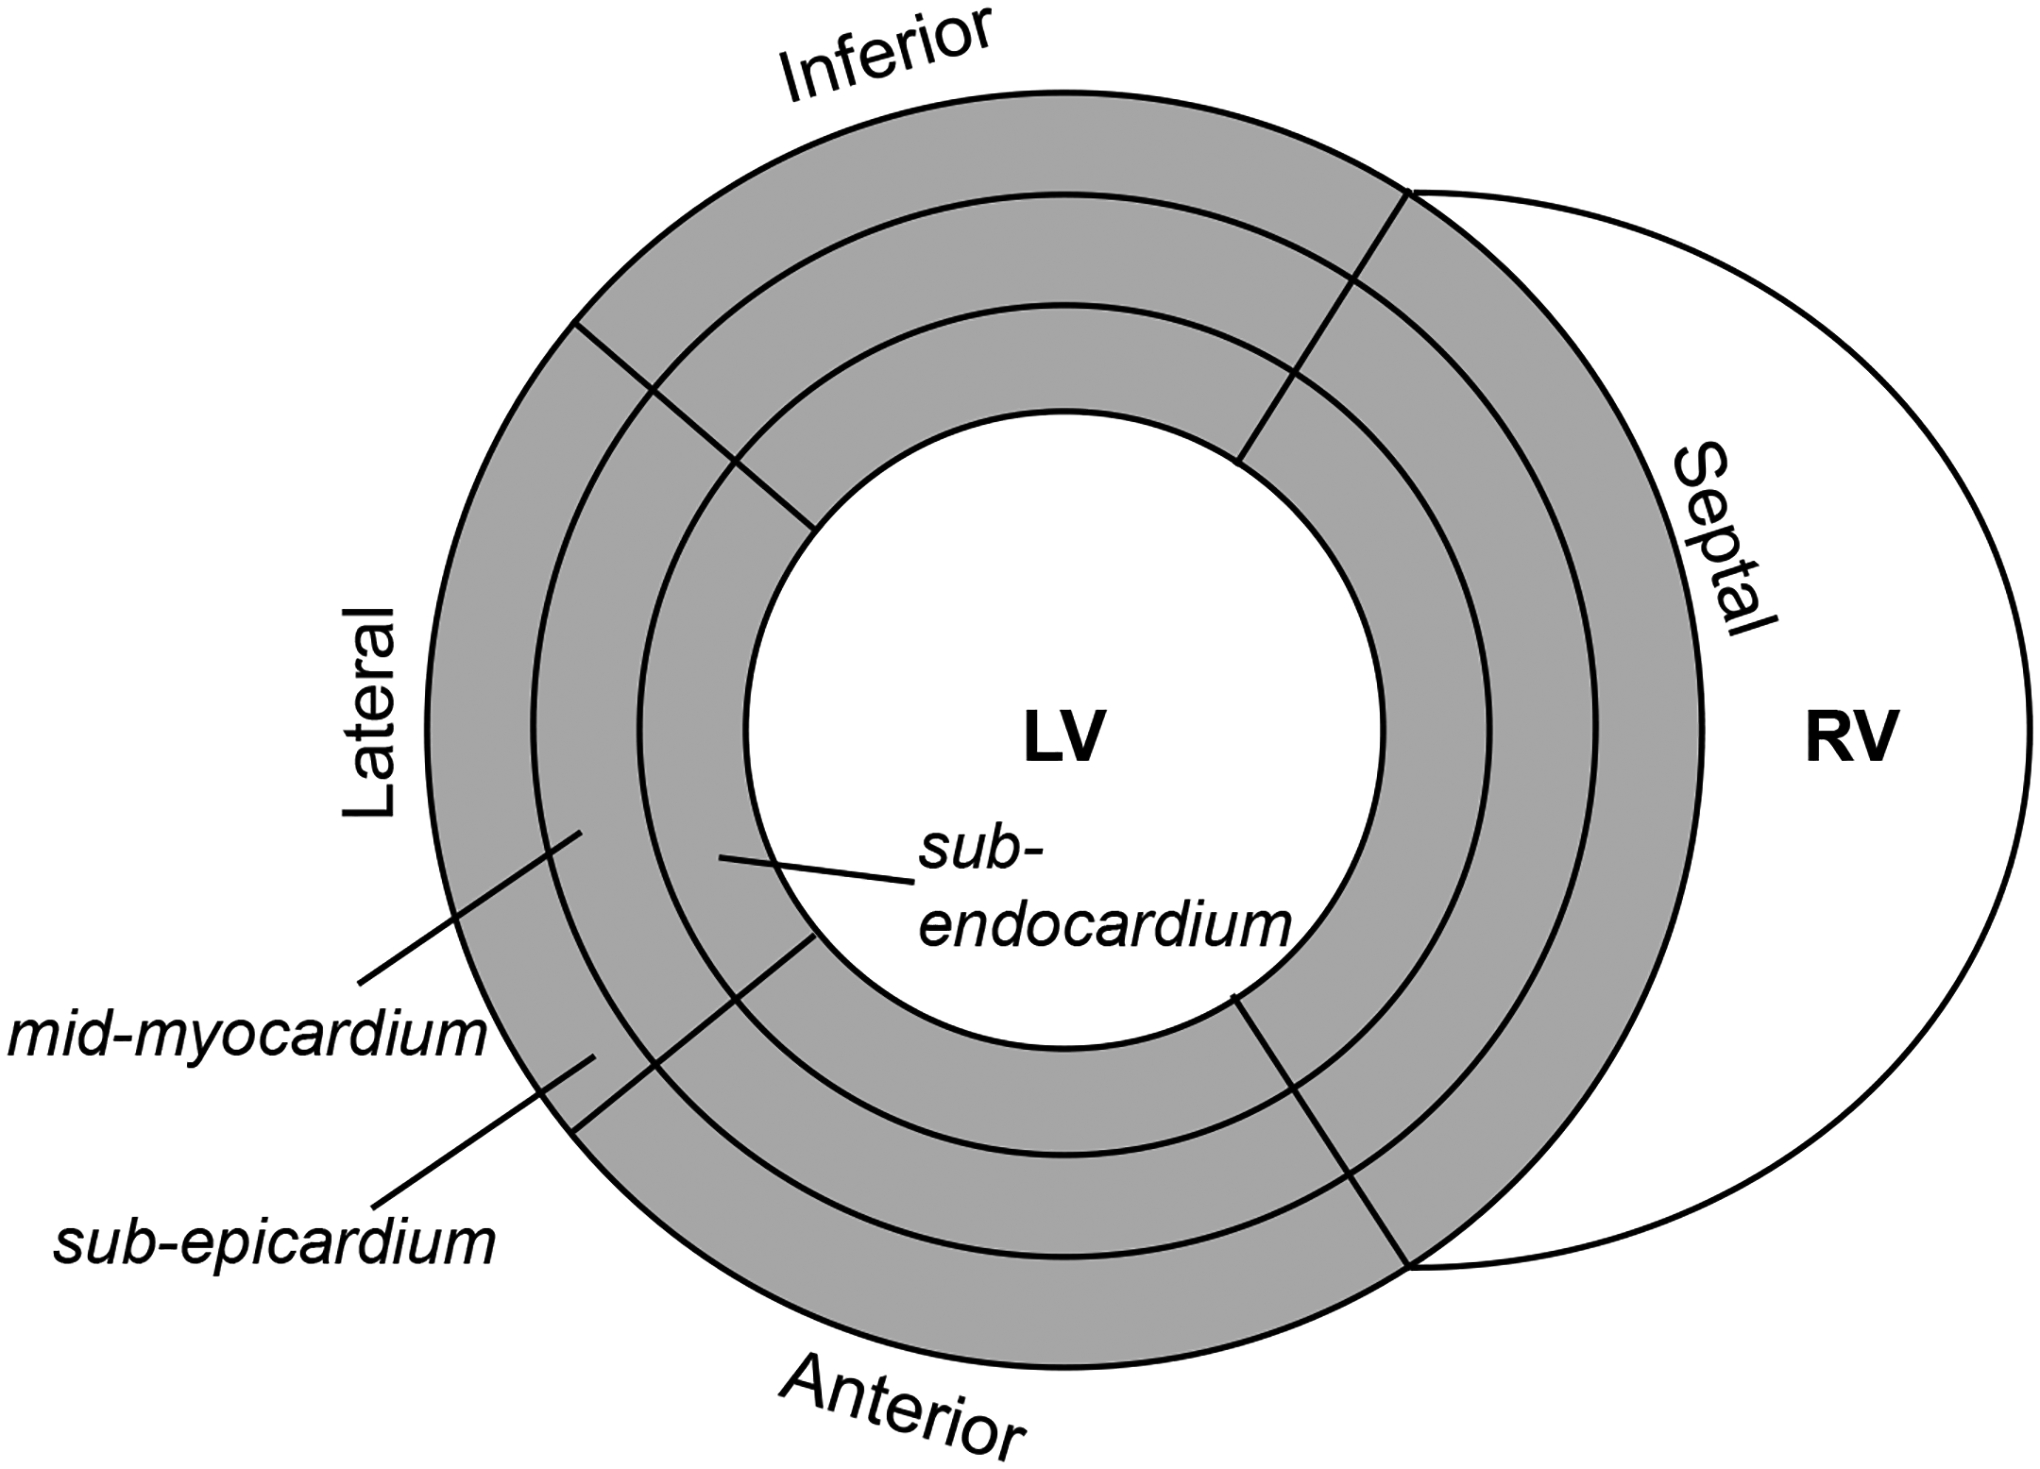
Diagram of mid-ventricular myocardial segmentation.
Reproducibility assessment
Inter-observer reproducibility was performed as previously described [17]. Briefly, a second investigator analyzed the same CMR images for 5 random rats to compute the peak systolic strains and CL shear angles. Reproducibility of a given variable, X, was defined as the mean coefficient of variation (CoV) over the 5 rats as follows [16]:
CoV ≤ 20% was considered reproducible.
Statistics
Strains and CL shear angles were represented as mean ± standard error of the mean (SEM). Multiple comparisons among the three regions (basal, mid-ventricle, and apical), among the three transmural layers in each wall segment, and among the four segments in each transmural layer were conducted using One-Way ANOVA with post-hoc Bonferroni t-tests. A value of p < 0.05 was considered significant.
RESULTS
Distribution of peak systolic strains at base, mid-ventricle, and apex
The strain component Ecc exhibited similar peak systolic values at the base, mid-ventricle, and apex of rat LVs (Figure 3A). This trend was also seen in the Ell and Err components. While the peak systolic shear strain components Erl and Erc assumed similar values at the three longitudinal LV levels, the peak systolic Ecl was significantly higher at the mid-ventricle compared to the apex (Figure 3B). It should be noted that maps of mid-ventricular end-systolic strain (Ecc, Ell, and Ecl), from a representative animal, are shown in Figures 1E – 1G.
Figure 3. Distributions of peak systolic strains at base, mid-ventricle, and apex.
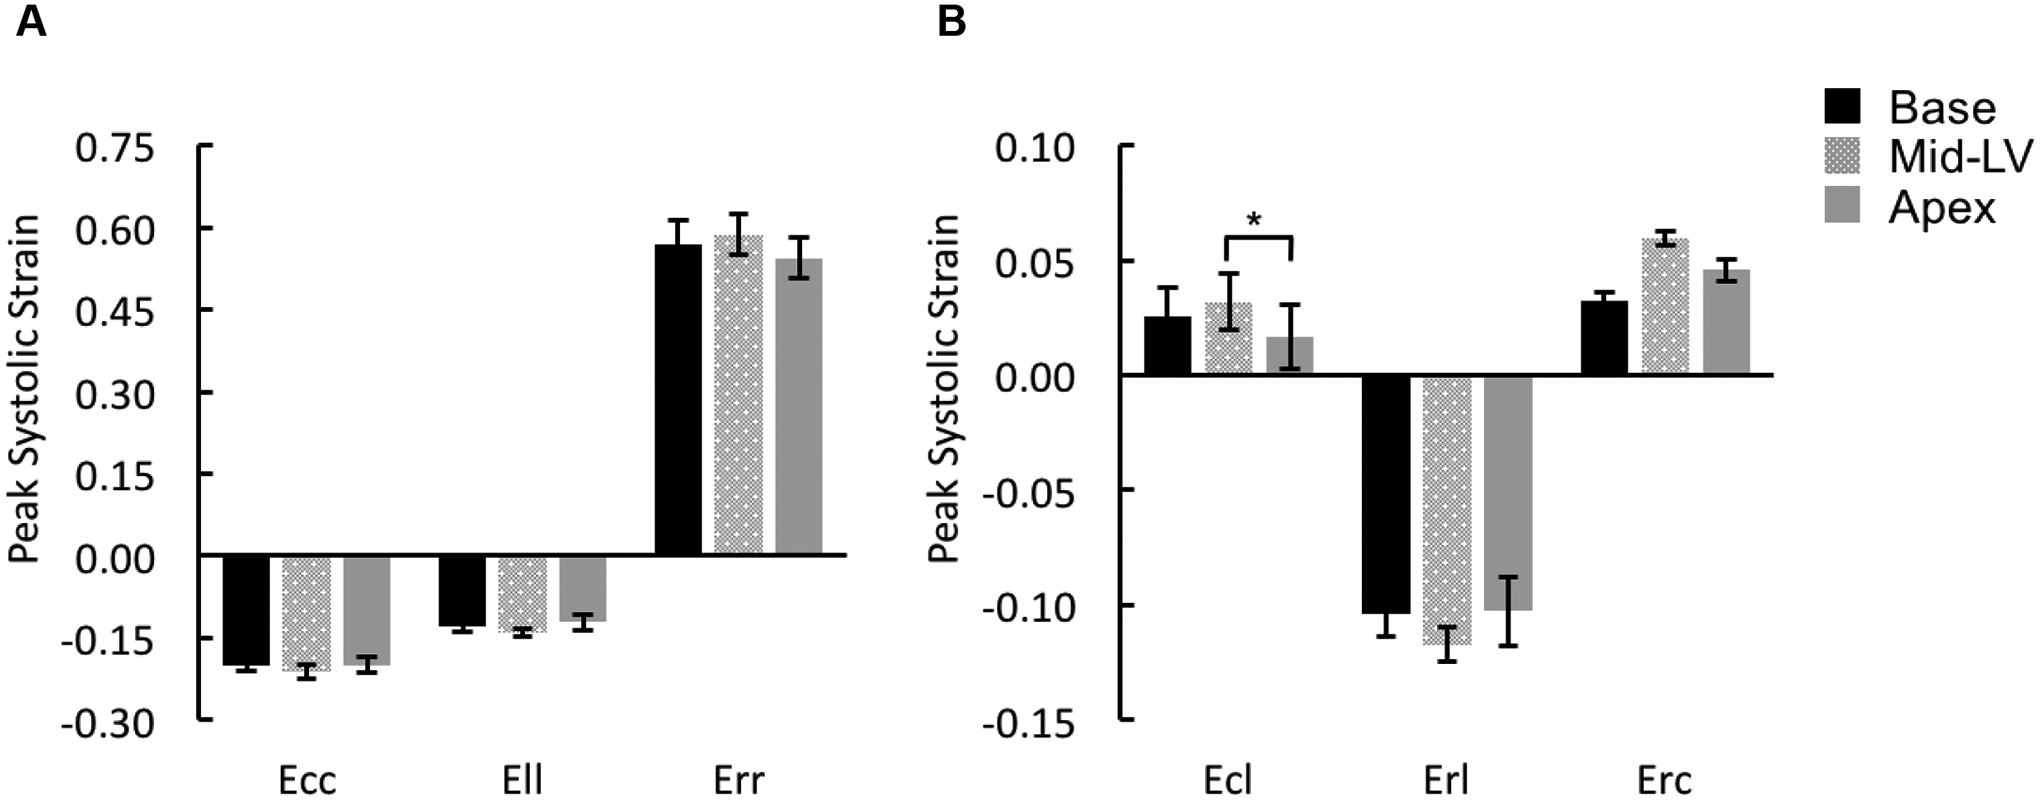
Peak systolic strains for normal components (A: Ecc, Ell, and Err) and shear components (B: Ecl, Erl, and Erc) were averaged over the entire slice at either basal [Base], mid-ventricular [Mid-LV], or apical [Apex] level of rat LVs. *p < 0.05.
Distribution of peak systolic strain Ecc in the mid-ventricle
Within each transmural layer, Ecc assumed similar values in the four different wall segments, i.e., septal, inferior, lateral, and anterior segments, throughout the entire cardiac cycle (data not shown); there were no significant differences in the peak systolic values (Supplemental Figure 1A). However, peak systolic Ecc exhibited significant transmural differences in the entire mid-ventricular wall with the sub-endocardium shortening the most followed by the mid-myocardial and then sub-epicardial layers (Figure 4A). The strain-time curves separated during systole in the three transmural layers (Figure 4B).
Figure 4. Distribution of Ecc in the mid-ventricle.
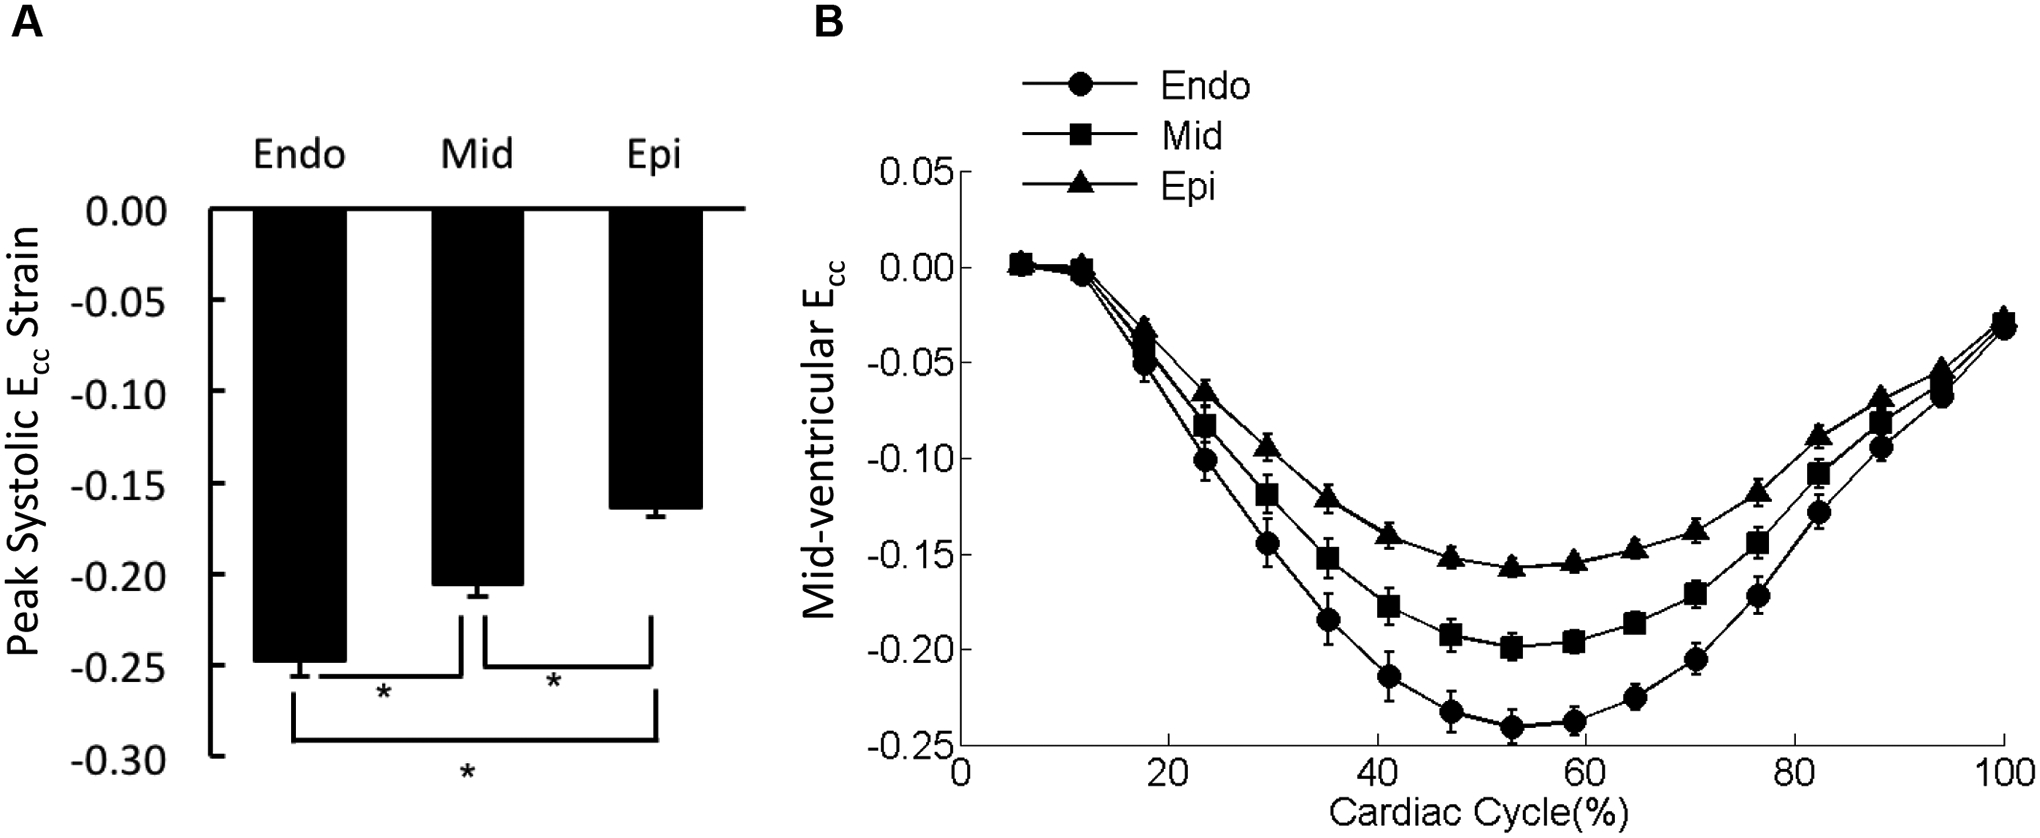
(A) The peak systolic Ecc values were averaged over each of the three transmural layers of the mid-ventricular slice (sub-endocardium [Endo], mid-myocardium [Mid], and sub-epicardium [Epi]). *p < 0.05. (B) The strain-time curves for Ecc in the three transmural layers of mid-ventricular slice were overlaid. Cardiac cycle started with end diastolic state.
Distribution of peak systolic strain Ell in the mid-ventricle
In all four LV wall segments, peak systolic Ell exhibited a uniform distribution across the three transmural layers (Supplemental Figure 1B). However, peak systolic Ell varied significantly among the four LV wall segments with the maximum shortening occurring in the inferior region (Figure 5A). The strain-time curves for the four wall segments diverged during systole (Figure 5B).
Figure 5. Distribution of Ell in the mid-ventricle.
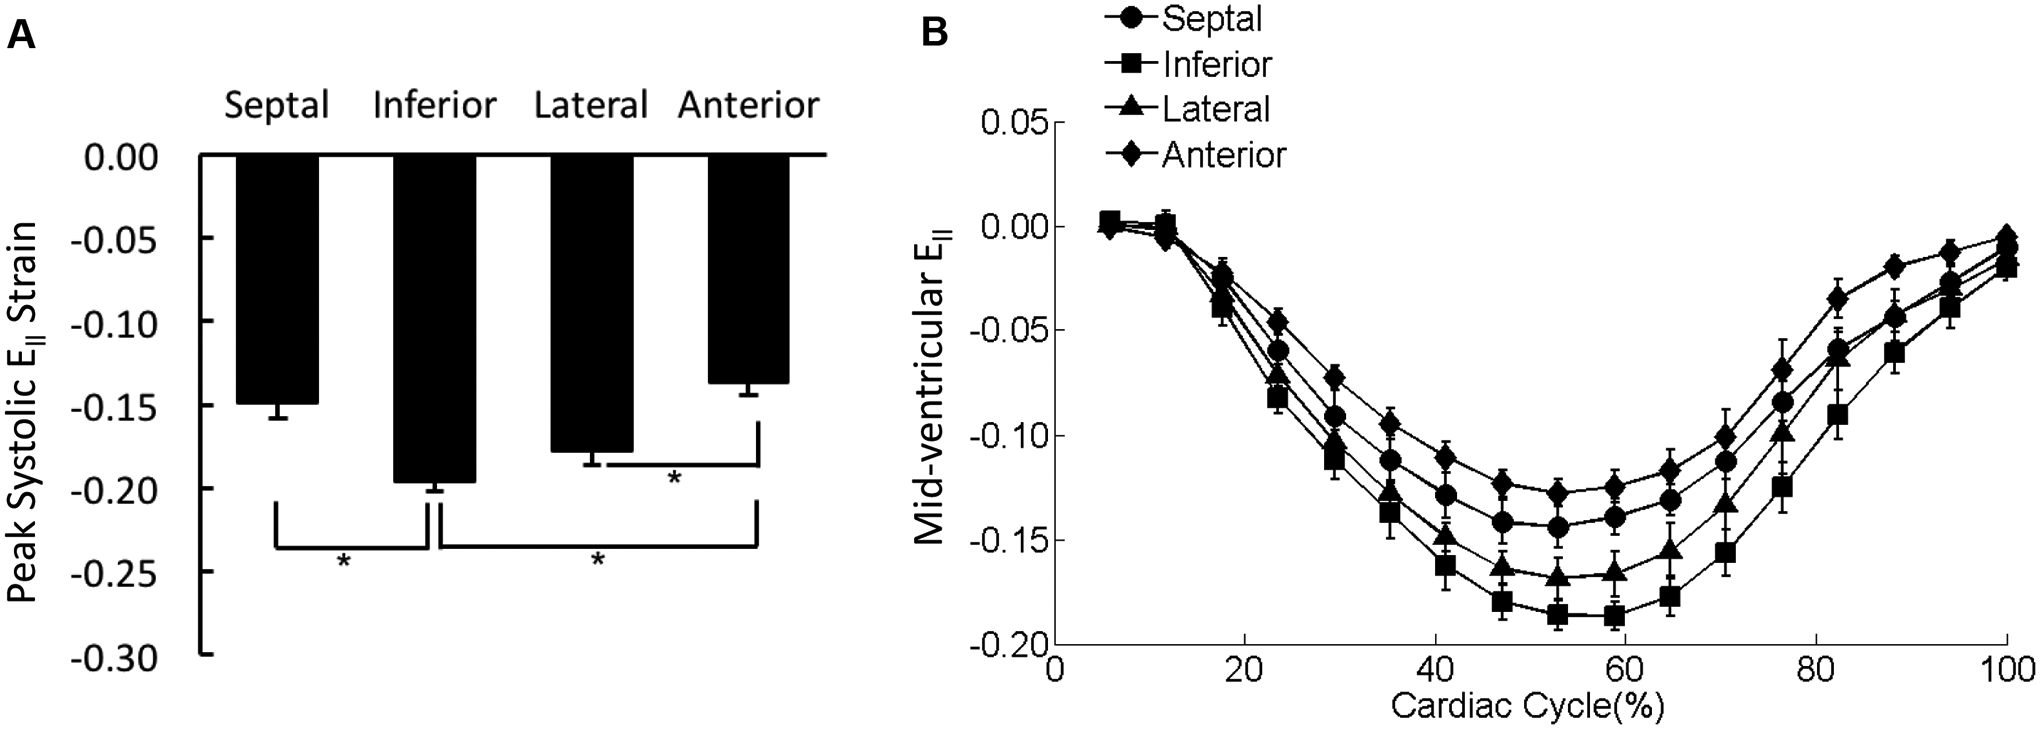
(A) The peak systolic Ell values were averaged over each of the four wall segments of the mid-ventricular slice regardless the transmural location. *p < 0.05. (B) The strain-time curves for Ell in the four wall segments of mid-ventricular slice were overlaid. Cardiac cycle started with end diastolic state.
Distribution of peak systolic strain Ecl in the mid-ventricle
There were significant differences in the peak systolic shear strain, Ecl, between the sub-epicardium and sub-endocardium in the inferior and anterior wall segments (Figure 6A). Moreover, peak systolic Ecl exhibited significant differences among the LV wall segments in both the sub-endocardial and mid-myocardial layers (Figure 6A). The strain-time curve obtained from the lateral wall showed that Ecl was effectively uniform across the three transmural layers throughout the entire cardiac cycle (Figures 6B).
Figure 6. Distribution of Ecl in the mid-ventricle.

(A) The peak systolic Ecl values were averaged over each region of the mid-ventricular slice (sub-endocardium [Endo], mid-myocardium [Mid], and sub-epicardium [Epi]). *p < 0.05. (B) The strain-time curves for Ecl in the three transmural layers of the representative lateral mid-ventricular wall were overlaid. Cardiac cycle started with end diastolic state.
Distributions of radial-related strain components (i.e., Err, Erl, and Erc) in the mid-ventricle
There was no significant difference observed in peak systolic Err among the four wall segments (Figure 7A); Err was uniformly distributed over the entire mid-LV slice throughout the entire cardiac cycle (Figure 7B). Erl in the septal wall was smaller than strains in the lateral and anterior wall with significant differences detected for the peak values during systole (Figure 8). The variations in Erc were not associated with any statistical significance (Figure 9).
Figure 7. Distribution of Err in the mid-ventricle.
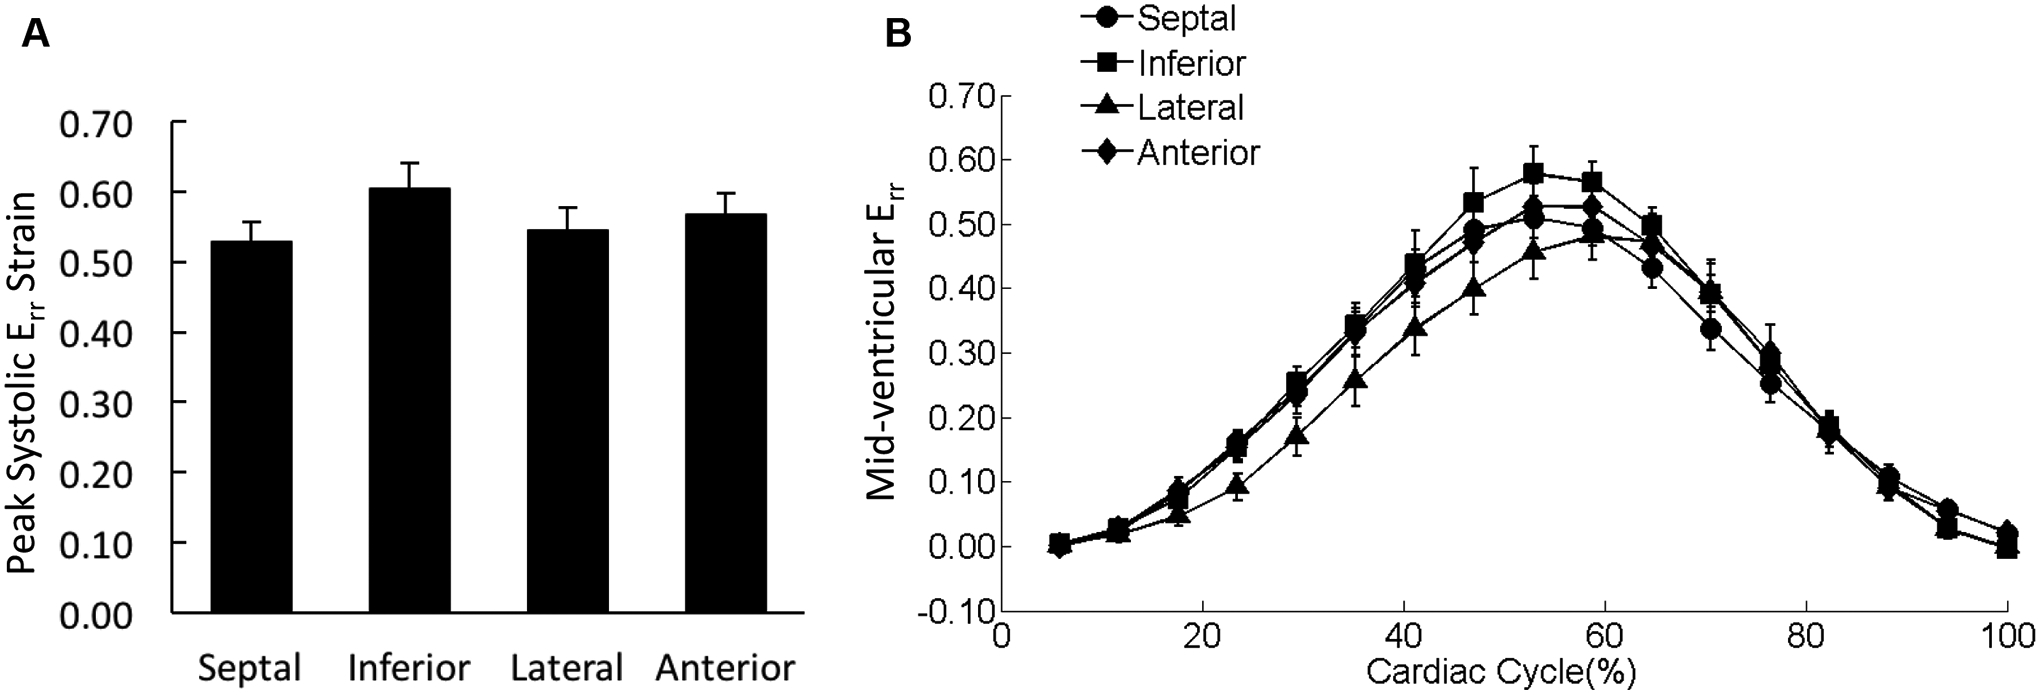
(A) The peak systolic Err values were averaged over each of the four wall segments of the mid-ventricular slice regardless the transmural location. (B) The strain-time curves for Err in the four wall segments of mid-ventricular slice were overlaid. Cardiac cycle started with end diastolic state.
Figure 8. Distribution of Erl in the mid-ventricle.
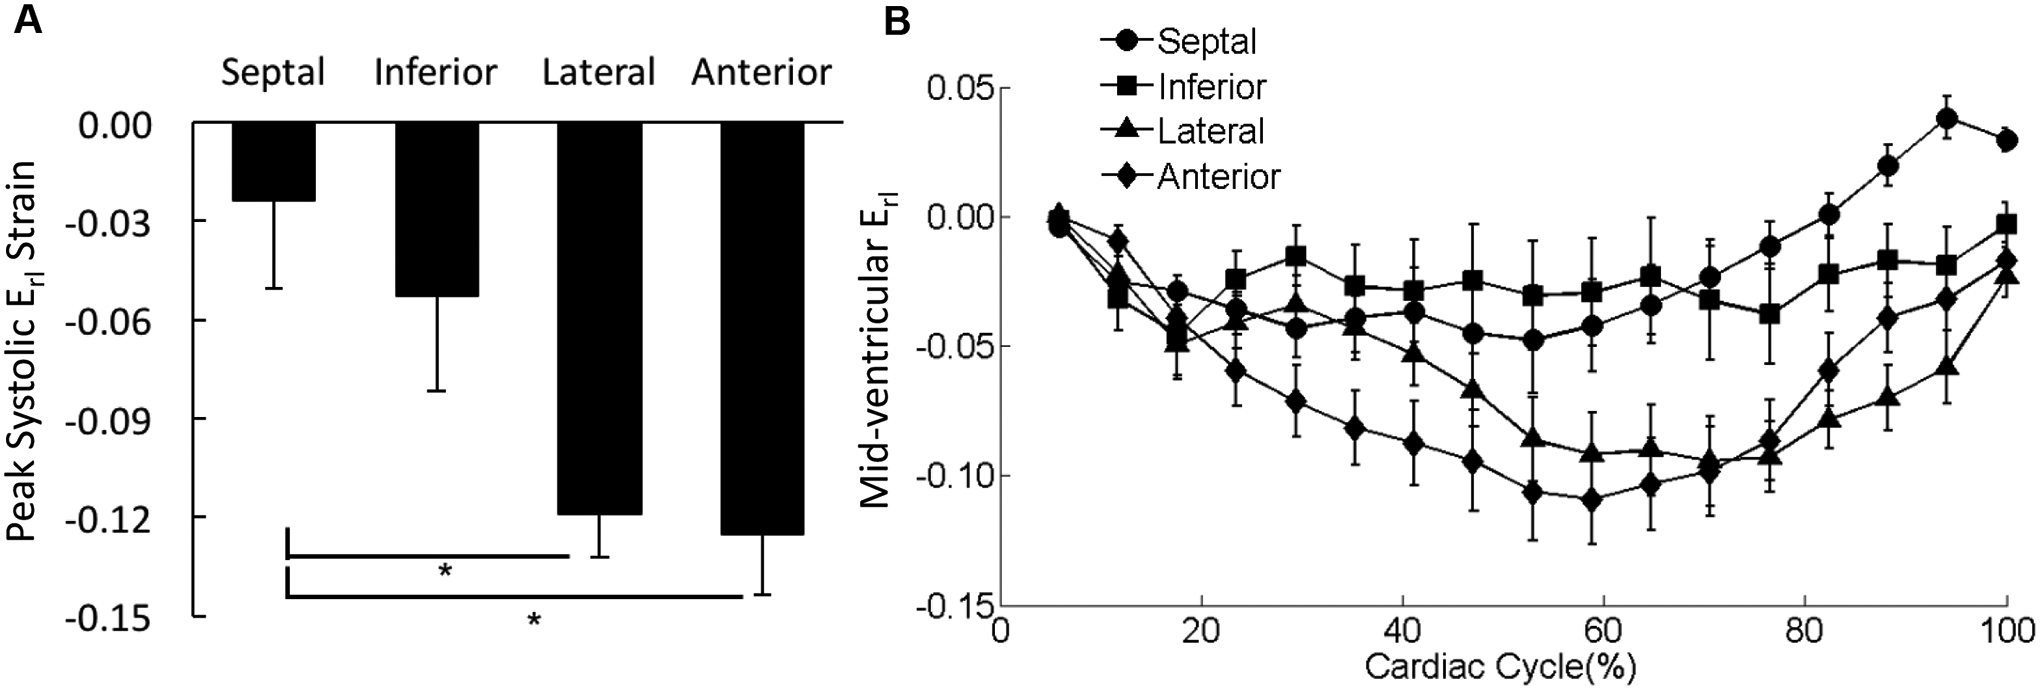
(A) The peak systolic Erl values were averaged over each of the four wall segments of the mid-ventricular slice regardless the transmural location. *p < 0.05. (B) The strain-time curves for Erl in the four wall segments of mid-ventricular slice were overlaid. Cardiac cycle started with end diastolic state.
Figure 9. Distribution of Erc in the mid-ventricle.
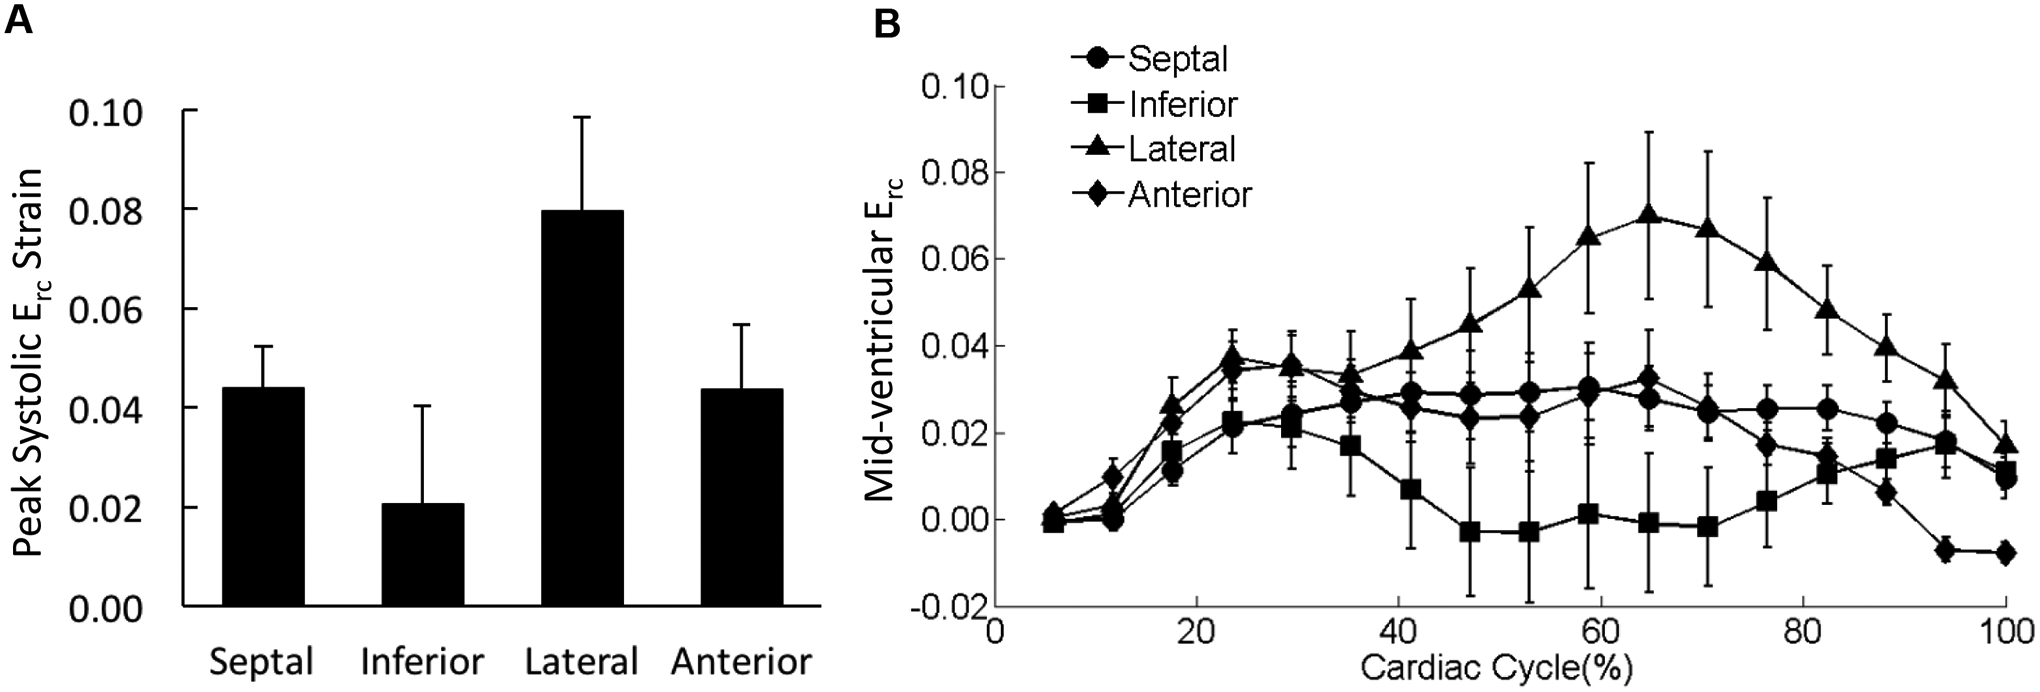
(A) The peak systolic Erc values were averaged over each of the four wall segments of the mid-ventricular slice regardless the transmural location. (B) The strain-time curves for Erc in the four wall segments of mid-ventricular slice were overlaid. Cardiac cycle started with end diastolic state.
Distribution of ventricular torsion
Reflected as CL shear angle, peak ventricular torsion exhibited significant transmural differences between the sub-epicardium and sub-endocardium in the inferior and anterior wall segments (Figure 10A). Moreover, in the sub-endocardial and mid-myocardial layers, peak systolic torsion varied significantly among the four wall segments (Figure 10A). In the lateral wall segment, the ventricular torsion was uniform across the three transmural layers during the cardiac cycle (Figure 10B).
Figure 10. Regional ventricular torsion.
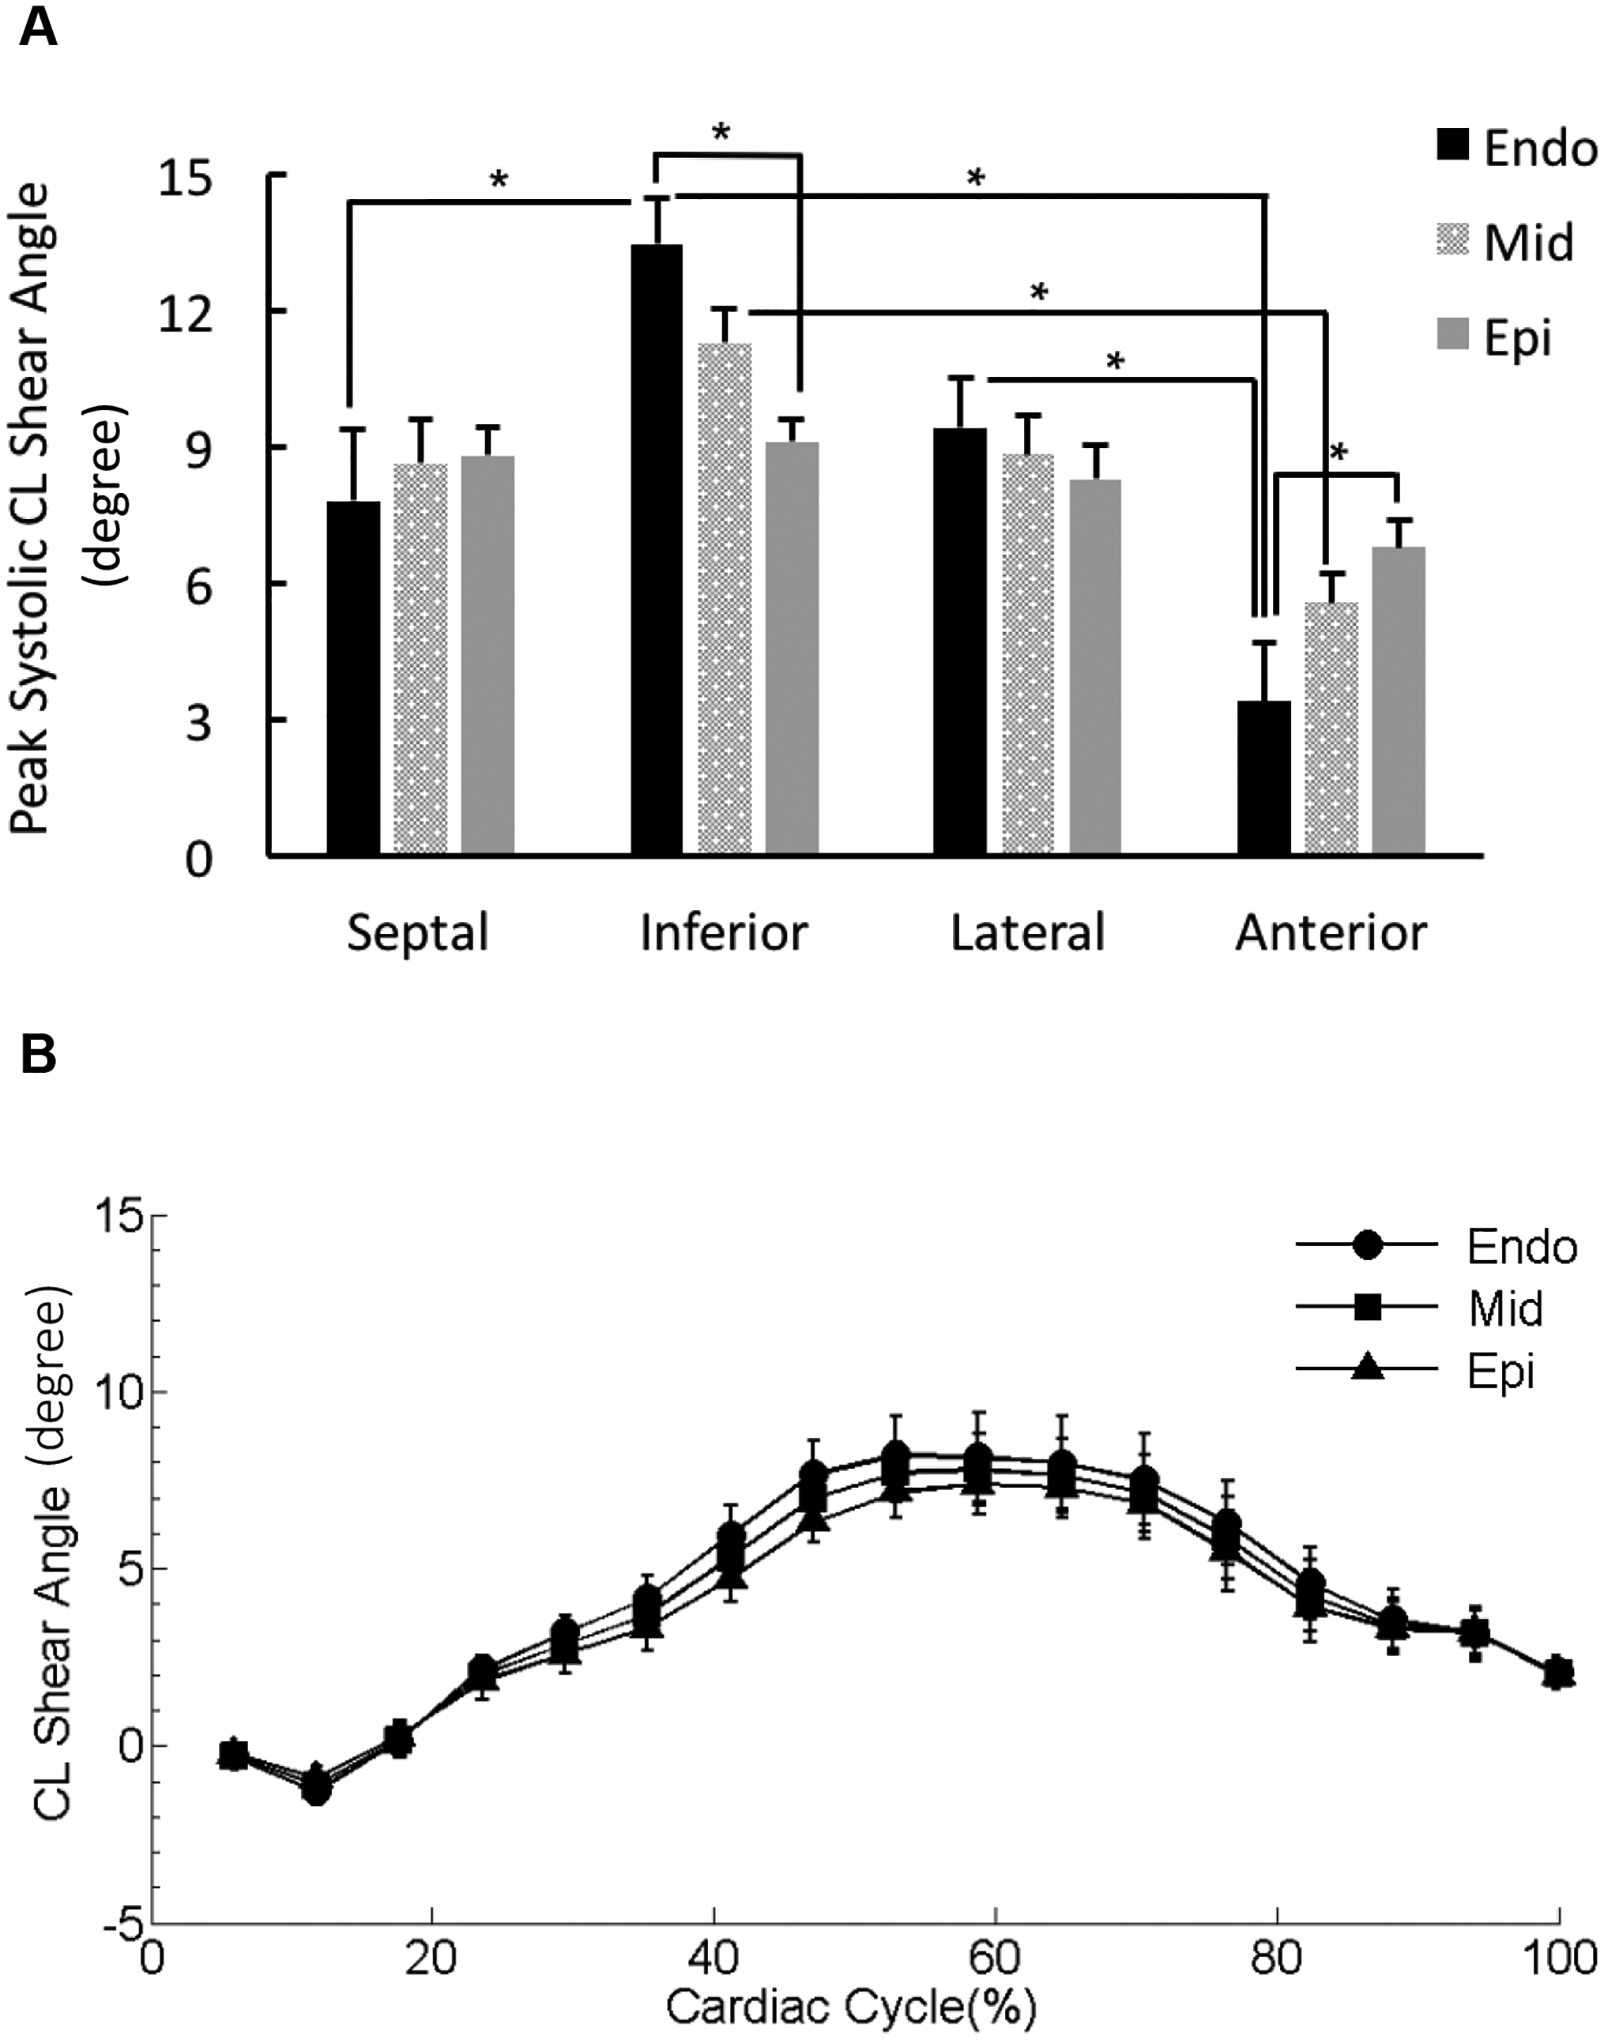
(A) Peak ventricular torsion was presented as peak circumferential-longitudinal (CL) shear angle and calculated for the three transmural layers (sub-endocardium [Endo], mid-myocardium [Mid], and sub-epicardium [Epi]) in the four wall segments. *p < 0.05. (B) The CL shear angle-time curves for the three transmural layers in the representative lateral wall segment were overlaid. Cardiac cycle started with end diastolic state.
Reproducibility of 3D cardiac mechanics in rat LV
The reproducibility of the 6 strain components calculated over the entirety of each myocardial slice at the base, mid-ventricle, and apex was good with the exception of Ecl at the apex (Supplemental Table 1).
With smaller partitions in the mid-LV myocardium, the non-radial-related strains (i.e., Ecc, Ell, and Ecl) were highly reproducible with CoV ≤ 15% in almost the entire myocardium, except that the CoV values of Ell and Ecl in the anterior sub-endocardium ranged from 15% to 22%, which were considered borderline reproducible (Supplemental Figure 2). In terms of the radial-related strain components (i.e., Err, Erl, and Erc), although Erc in the inferior wall segment exhibited poor reproducibility, the other strain components in the majority of the LV were reproducible (Supplemental Figure 3).
CL shear angle was reproducible over the entire myocardium (Supplemental Figure 4). In addition, the CoV values were lower than 15% in the septal, inferior, and lateral wall regardless of the transmural location.
DISCUSSION
The present study quantified the 3D Lagrangian strains in different regions in the LV wall of healthy rats and detected significant regional variations in systolic strains at the mid-ventricle. While the radial strain Err was uniformly distributed over the entire mid-ventricular myocardium, the other two normal components, Ecc and Ell, exhibited significant differences along the transmural direction and among the wall segments, respectively. The observed transmural pattern of Ecc agrees with the reported results in murine models and humans [9, 23]. Moreover, both humans and rats exhibit higher Ell in the inferior wall [24]. Interestingly, the distributions of shear strain, i.e., Ecl, Erc, and Erl, depended on their two respective components. In other words, Ecl varied in both the transmural direction and among wall segments, whereas Erl only varied among the wall segments, and Erc was not associated with any significant regional variations. The observed regional distributions of the 6 strain components may serve to coordinate the global LV deformation including radial thickening, circumferential and longitudinal shortening.
It should be noted that transmural distributions were not reported for the radial-related strain components (i.e., Err, Erl and Erc) in the present study. Notably, the measurement of Erl and Erc was associated with large variabilities, which was also observed in murine models with 3D cine DENSE CMR [9]. Moreover, the radial-related strain components were less reproducible compared to the non-radial-related strains (i.e., Ecc, Ell, and Ecl). Further partition in the thin transmural wall likely introduces more variability which resulted in poor reproducibility.
Torsion, as another important feature of LV deformation, was also assessed in the present study as CL shear angle. The overall trend of CL shear angle throughout the entire cardiac cycle was consistent with previously reported torsion time courses [9, 22]. As a result of heterogeneous contraction/shortening of myofibers in different regions, ventricular torsion also exhibited significant differences across the myocardium transmurally in some wall segments and varied among the wall segments particularly in the sub-endocardial and mid-myocardial layers. Accounting for different torsion definitions, the peak systolic torsion value averaged over the entire myocardium was consistent with those reported for rats [16], mice [9, 17] and humans [22]. With normalization to the radial and longitudinal distances, torsion calculated in the present study was highly reproducible overall.
One limitation of the present study was that we did not compare or relate the baseline observations in healthy rats to any disease conditions or treatments. However, a detailed profile of regional cardiac mechanics for healthy rats is necessary and can facilitate future extensive studies using rat models to study heart disease and treatments, especially because heart disease and/or treatments are associated with changes in specific myocardial regions [13–15]. Moreover, we did not include the strain analysis for the right ventricle (RV) in the present study. Since the RV is thin walled with a complex shape, the 3D strain analysis for RV may require acceleration techniques with higher resolution scans, which are still being developed. The tools for RV 3D DENSE analysis have only recently been developed [25]. Therefore, the 3D strain analysis of RV is beyond the scope of the current study and will be a focus of future work. In addition, only inter-observer reproducibility, not inter-test reproducibility, was assessed in the present study. However, cine DENSE CMR has been shown to have good inter-test reproducibility in mice [17], and we expect these findings to translate into rats. Finally, instead of the standard 6 LV wall segments used at the base and mid-ventricle, only 4 segments were assessed in order to increase the power to detect regional differences. In the current study, the ventricle was partitioned in the transmural direction, whereas the standard segments are composed of the full transmural thickness. Thus, it was necessary to increase the size to the segments, which is why 4 segments were employed.
CONCLUSIONS
During systole, the 3D Lagrangian strains, especially the Ecc and Ell components, and ventricular torsion exhibit regional variation at the mid-ventricle of healthy rats. The results of the current study provide the necessary normative information of regional contractile function for rat hearts, which could facilitate further studies on changes induced by heart disease.
Supplementary Material
Supplemental Figure 1. Peak systolic values for non-radial-related strain components in the mid-ventricle. Peak systolic Ecc (A) and Ell (B) were averaged over each region of the mid-ventricular slice (sub-endocardium [Endo], mid-myocardium [Mid], and sub-epicardium [Epi]). *p < 0.05.
Supplemental Figure 2. Coefficients of variation (CoV) for the inter-observer analyses of peak systolic non-radial-related strain components. CoV values for peak systolic Ecc (A), Ell (B), and Ecl (C) in four wall segments of the mid-ventricle were broken down by the transmural location (sub-endocardium [Endo], mid-myocardium [Mid], and sub-epicardium [Epi]) and averaged over the three layers [Myocardium].
Supplemental Figure 3. Coefficients of variation (CoV) for the inter-observer analyses of peak systolic radial-related strain components.
Supplemental Figure 4. Coefficients of variation (CoV) for the inter-observer analyses of peak systolic circumferential-longitudinal (CL) shear angle. CoV values for peak systolic CL shear angle in four wall segments were broken down by the transmural location (sub-endocardium [Endo], mid-myocardium [Mid], and sub-epicardium [Epi]) and averaged over the three layers [Myocardium].
Supplemental Table 1. Coefficients of variation (CoV; %) for the inter-observer analyses of peak systolic strains at the base, mid-ventricle, and apex.
Supplemental Table 2. Peak systolic strains. (A) Distribution within the basal, mid-ventricular, and apical regions. (B) Mid-ventricular distribution within the transmural layers and wall segments.
ACKNOWLEDGEMENTS
The authors wish to thank Hua Wang and Amir Nikou for their help with CMR scans. This study was supported by an award from the American Heart Association (14BGIA18850020), a grant from the National Science Foundation (CMMI-1538754), and grants from the National Institutes of Health (S10RR029541, P20GM103527, UL1TR000117).
LIST OF NON-STANDARD ABBREVIATIONS
- CL
circumferential-longitudinal
- CoV
coefficient of variation
- ED
end diastole
- Endo
sub-endocardium
- Epi
sub-epicardium
- ES
end systole
- LV
left ventricle
- Mid
mid-myocardium
REFERENCES
- 1.Goldman S and Raya TE, Rat infarct model of myocardial infarction and heart failure. J Card Fail, 1995. 1(2): p. 169–77. [DOI] [PubMed] [Google Scholar]
- 2.Patten RD and Hall-Porter MR, Small animal models of heart failure: development of novel therapies, past and present. Circ Heart Fail, 2009. 2(2): p. 138–44. [DOI] [PubMed] [Google Scholar]
- 3.Fomovsky GM and Holmes JW, Evolution of scar structure, mechanics, and ventricular function after myocardial infarction in the rat. Am J Physiol Heart Circ Physiol, 2010. 298(1): p. H221–8. [DOI] [PMC free article] [PubMed] [Google Scholar]
- 4.Glukhov AV, Fedorov VV, Lou Q, Ravikumar VK, Kalish PW, Schuessler RB, Moazami N, and Efimov IR, Transmural dispersion of repolarization in failing and nonfailing human ventricle. Circ Res, 2010. 106(5): p. 981–91. [DOI] [PMC free article] [PubMed] [Google Scholar]
- 5.Antzelevitch C, Sicouri S, Litovsky SH, Lukas A, Krishnan SC, Di Diego JM, Gintant GA, and Liu DW, Heterogeneity within the ventricular wall. Electrophysiology and pharmacology of epicardial, endocardial, and M cells. Circ Res, 1991. 69(6): p. 1427–49. [DOI] [PubMed] [Google Scholar]
- 6.Campbell SG, Haynes P, Kelsey Snapp W, Nava KE, and Campbell KS, Altered ventricular torsion and transmural patterns of myocyte relaxation precede heart failure in aging F344 rats. Am J Physiol Heart Circ Physiol, 2013. 305(5): p. H676–86. [DOI] [PMC free article] [PubMed] [Google Scholar]
- 7.Kramer SP, Powell DK, Haggerty CM, Binkley CM, Mattingly AC, Cassis LA, Epstein FH, and Fornwalt BK, Obesity reduces left ventricular strains, torsion, and synchrony in mouse models: a cine displacement encoding with stimulated echoes (DENSE) cardiovascular magnetic resonance study. J Cardiovasc Magn Reson, 2013. 15: p. 109. [DOI] [PMC free article] [PubMed] [Google Scholar]
- 8.Grothues F, Smith GC, Moon JC, Bellenger NG, Collins P, Klein HU, and Pennell DJ, Comparison of interstudy reproducibility of cardiovascular magnetic resonance with two-dimensional echocardiography in normal subjects and in patients with heart failure or left ventricular hypertrophy. Am J Cardiol, 2002. 90(1): p. 29–34. [DOI] [PubMed] [Google Scholar]
- 9.Zhong X, Gibberman LB, Spottiswoode BS, Gilliam AD, Meyer CH, French BA, and Epstein FH, Comprehensive cardiovascular magnetic resonance of myocardial mechanics in mice using three-dimensional cine DENSE. J Cardiovasc Magn Reson, 2011. 13: p. 83. [DOI] [PMC free article] [PubMed] [Google Scholar]
- 10.Zerhouni EA, Parish DM, Rogers WJ, Yang A, and Shapiro EP, Human heart: tagging with MR imaging--a method for noninvasive assessment of myocardial motion. Radiology, 1988. 169(1): p. 59–63. [DOI] [PubMed] [Google Scholar]
- 11.Osman NF, Kerwin WS, McVeigh ER, and Prince JL, Cardiac motion tracking using CINE harmonic phase (HARP) magnetic resonance imaging. Magn Reson Med, 1999. 42(6): p. 1048–60. [DOI] [PMC free article] [PubMed] [Google Scholar]
- 12.van Dijk P, Direct cardiac NMR imaging of heart wall and blood flow velocity. J Comput Assist Tomogr, 1984. 8(3): p. 429–36. [DOI] [PubMed] [Google Scholar]
- 13.Kim D, Gilson WD, Kramer CM, and Epstein FH, Myocardial tissue tracking with two-dimensional cine displacement-encoded MR imaging: development and initial evaluation. Radiology, 2004. 230(3): p. 862–71. [DOI] [PubMed] [Google Scholar]
- 14.Aletras AH, Ding S, Balaban RS, and Wen H, DENSE: displacement encoding with stimulated echoes in cardiac functional MRI. J Magn Reson, 1999. 137(1): p. 247–52. [DOI] [PMC free article] [PubMed] [Google Scholar]
- 15.Liu W, Chen J, Ji S, Allen JS, Bayly PV, Wickline SA, and Yu X, Harmonic phase MR tagging for direct quantification of Lagrangian strain in rat hearts after myocardial infarction. Magn Reson Med, 2004. 52(6): p. 1282–90. [DOI] [PubMed] [Google Scholar]
- 16.Chen Y, Somji A, Yu X, and Stelzer JE, Altered in vivo left ventricular torsion and principal strains in hypothyroid rats. Am J Physiol Heart Circ Physiol, 2010. 299(5): p. H1577–87. [DOI] [PMC free article] [PubMed] [Google Scholar]
- 17.Haggerty CM, Kramer SP, Binkley CM, Powell DK, Mattingly AC, Charnigo R, Epstein FH, and Fornwalt BK, Reproducibility of cine displacement encoding with stimulated echoes (DENSE) cardiovascular magnetic resonance for measuring left ventricular strains, torsion, and synchrony in mice. J Cardiovasc Magn Reson, 2013. 15: p. 71. [DOI] [PMC free article] [PubMed] [Google Scholar]
- 18.Zhong X, Helm PA, and Epstein FH, Balanced multipoint displacement encoding for DENSE MRI. Magn Reson Med, 2009. 61(4): p. 981–8. [DOI] [PMC free article] [PubMed] [Google Scholar]
- 19.Gilliam AD and Suever JD, DENSEanalysis. 2016: https://github.com/denseanalysis/denseanalysis.
- 20.Spottiswoode BS, Zhong X, Hess AT, Kramer CM, Meintjes EM, Mayosi BM, and Epstein FH, Tracking myocardial motion from cine DENSE images using spatiotemporal phase unwrapping and temporal fitting. IEEE Trans Med Imaging, 2007. 26(1): p. 15–30. [DOI] [PubMed] [Google Scholar]
- 21.Spottiswoode BS, Zhong X, Lorenz CH, Mayosi BM, Meintjes EM, and Epstein FH, Motion-guided segmentation for cine DENSE MRI. Med Image Anal, 2009. 13(1): p. 105–15. [DOI] [PMC free article] [PubMed] [Google Scholar]
- 22.Russel IK, Tecelao SR, Kuijer JP, Heethaar RM, and Marcus JT, Comparison of 2D and 3D calculation of left ventricular torsion as circumferential-longitudinal shear angle using cardiovascular magnetic resonance tagging. J Cardiovasc Magn Reson, 2009. 11: p. 8. [DOI] [PMC free article] [PubMed] [Google Scholar]
- 23.Zhong X, Spottiswoode BS, Meyer CH, Kramer CM, and Epstein FH, Imaging three-dimensional myocardial mechanics using navigator-gated volumetric spiral cine DENSE MRI. Magn Reson Med, 2010. 64(4): p. 1089–97. [DOI] [PMC free article] [PubMed] [Google Scholar]
- 24.Marwick TH, Leano RL, Brown J, Sun JP, Hoffmann R, Lysyansky P, Becker M, and Thomas JD, Myocardial strain measurement with 2-dimensional speckle-tracking echocardiography: definition of normal range. JACC Cardiovasc Imaging, 2009. 2(1): p. 80–4. [DOI] [PubMed] [Google Scholar]
- 25.Suever J, Wehner G, Jing L, Powell D, Hamlet S, Grabau J, Mojsejenko D, Andres K, Haggerty C, and Fornwalt B, Right Ventricular Strain, Torsion, and Dyssynchrony in Healthy Subjects using 3D Spiral Cine DENSE Magnetic Resonance Imaging. IEEE Trans Med Imaging, 2016. [DOI] [PMC free article] [PubMed] [Google Scholar]
Associated Data
This section collects any data citations, data availability statements, or supplementary materials included in this article.
Supplementary Materials
Supplemental Figure 1. Peak systolic values for non-radial-related strain components in the mid-ventricle. Peak systolic Ecc (A) and Ell (B) were averaged over each region of the mid-ventricular slice (sub-endocardium [Endo], mid-myocardium [Mid], and sub-epicardium [Epi]). *p < 0.05.
Supplemental Figure 2. Coefficients of variation (CoV) for the inter-observer analyses of peak systolic non-radial-related strain components. CoV values for peak systolic Ecc (A), Ell (B), and Ecl (C) in four wall segments of the mid-ventricle were broken down by the transmural location (sub-endocardium [Endo], mid-myocardium [Mid], and sub-epicardium [Epi]) and averaged over the three layers [Myocardium].
Supplemental Figure 3. Coefficients of variation (CoV) for the inter-observer analyses of peak systolic radial-related strain components.
Supplemental Figure 4. Coefficients of variation (CoV) for the inter-observer analyses of peak systolic circumferential-longitudinal (CL) shear angle. CoV values for peak systolic CL shear angle in four wall segments were broken down by the transmural location (sub-endocardium [Endo], mid-myocardium [Mid], and sub-epicardium [Epi]) and averaged over the three layers [Myocardium].
Supplemental Table 1. Coefficients of variation (CoV; %) for the inter-observer analyses of peak systolic strains at the base, mid-ventricle, and apex.
Supplemental Table 2. Peak systolic strains. (A) Distribution within the basal, mid-ventricular, and apical regions. (B) Mid-ventricular distribution within the transmural layers and wall segments.


