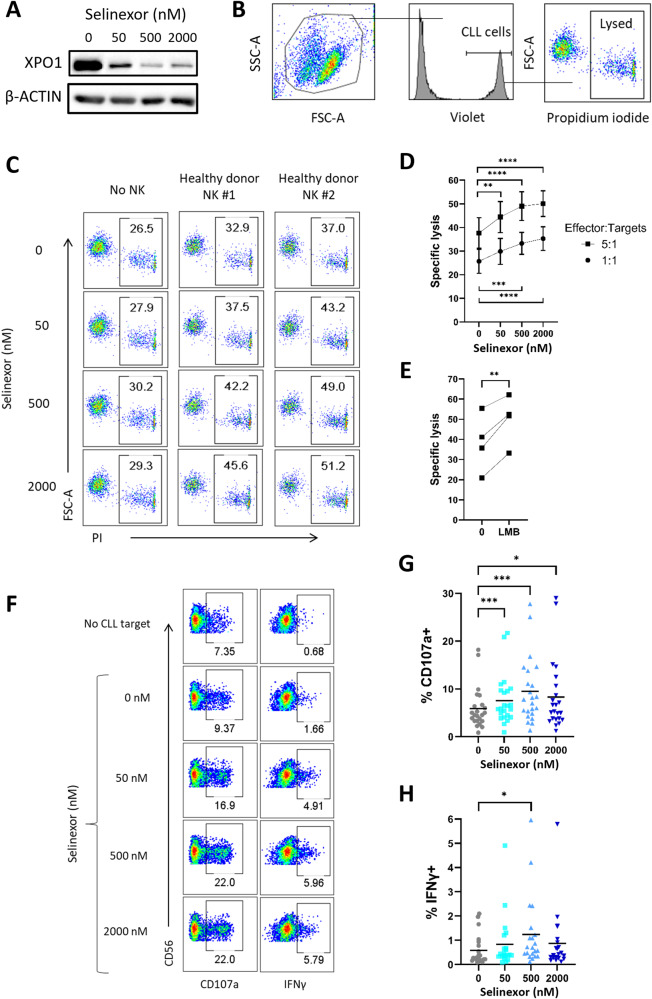
Fig. 1. XPO1 inhibition sensitises primary CLL cells to NK cell mediated cytotoxicity.
A CLL cells were treated with selinexor (50–2000 nM) for 24 h in the presence 30 µM Q-VD and cell lysates analysed by western blot. Shown is a representative example of three CLL donors. B Flow cytometry gating strategy for measuring NK specific lysis of CLL cells. Prior to 24-hour selinexor treatment, CLL cells were stained with CellTrace Violet to allow identification of CLL cells in co-culture. Propidium iodide (PI) was used to measure the proportion of lysed CLL cells. C Representative example of the proportion of lysed CLL cells from one CLL donor when treated with selinexor for 24 h in the presence 30 µM Q-VD (left) and then co-cultured with purified NK cells for 4 h after selinexor treatment at an E:T ratio of 5:1 (centre and right). D, E NK specific lysis of CLL target cells pre-treated for 24 h with selinexor (D, N = 10) or 50 nM leptomycin B (E, LMB, E:T = 5:1, N = 4) in the presence 30 µM Q-VD. Differences in the lysis ability of NK cells was calculated between selinexor concentrations at each E:T using repeated-measure one-way ANOVA followed by Dunnett’s multiple comparisons test (**P < 0.01, ***P < 0.005, ****P < 0.001). Paired t test (**P < 0.01) was used to calculate a significant difference in NK cell lysis with LMB. F CD56 + CD3- NK cell activation after 4 h co-culture of healthy donor PBMC with selinexor-treated CLL cells. Activation was measured as the proportion of NK cells positive for CD107a and IFNγ. Activation gates were drawn based on the no CLL target control condition and background activation subtracted from co-culture samples and used to plot graphs in (G) and (H). Percentage of CD107a+ (G) and IFNγ+ (H) NK cells after co-culture with selinexor-treated CLL cells. Line on graph represents the mean of each group (CD107a: N = 23 and IFNγ: N = 21). Differences in NK cell activation between selinexor treatments were calculated by repeated-measure one-way ANOVA followed by Dunnett’s multiple comparison test (*P < 0.05, ***P < 0.005).

