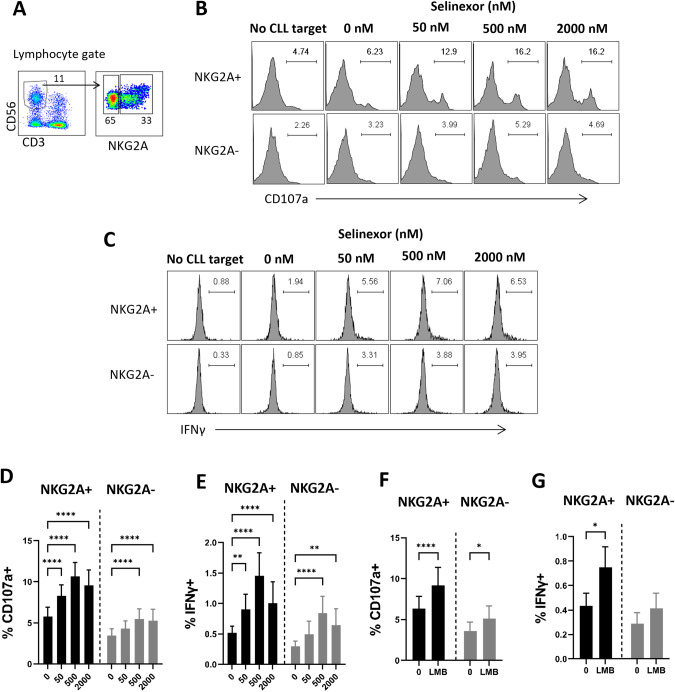
Fig. 3. XPO1 inhibition activates NKG2A+ and NKG2A− NK cells against CLL cells.
A Flow cytometry gating strategy to identify NKG2A+ and NKG2A- NK cells within the CD3-CD56 + NK cell population of healthy donor PBMC. Representative example of NK cell activation as measured by degranulation (CD107a staining, B) and IFNγ production (C) in NKG2A+ and NKG2A- NK cells after healthy donor PBMC were co-cultured for 4 h with CLL cells pre-treated with selinexor (50–2000 nM) for 24 h. NK cell activation measured by CD107a staining (D) and IFNγ production (E) in NKG2A+ and NKG2A- NK cells when healthy donor PBMC were co-cultured for 4 h with selinexor-treated (50–2000 nM) CLL cells. Shown is mean ± SEM (N = 23) and differences in NK activation compared to the untreated control were assessed by repeated-measure two-way ANOVA followed by Dunnett’s multiple comparison test (**P < 0.01, ****P < 0.001). NK cell activation measured by CD107a staining (F) and IFNγ production (G) in NKG2A+ and NKG2A- NK cells when healthy donor PBMC were co-cultured for 4 h with leptomycin-treated (LMB, 50 nM) CLL cells. Shown is mean ± SEM (N = 17) and differences in NK activation compared to the untreated control were assessed by repeated-measure two-way ANOVA followed by Dunnett’s multiple comparison test (*P < 0.05, ****P < 0.001).

