

Abstract
Immunotherapies have emerged as promising strategies for cancer treatment. However, existing immunotherapies have poor activity in high-grade serous ovarian cancer (HGSC) due to the immunosuppressive tumor microenvironment and the associated low tumoral CD8+ T cell (CTL) infiltration. Through multiple lines of evidence, including integrative analyses of human HGSC tumors, we have identified miR-146a as a master regulator of CTL infiltration in HGSC. Tumoral miR-146a expression is positively correlated with anti-cancer immune signatures in human HGSC tumors, and delivery of miR-146a to tumors resulted in significant reduction in tumor growth in both ID8-p53−/− and IG10 murine HGSC models. Increasing miR-146a expression in tumors improved anti-tumor immune responses by decreasing immune suppressive neutrophils and increasing CTL infiltration. Mechanistically, miR-146a targets IL-1 receptor-associated kinase 1 and tumor necrosis factor receptor-associated factor 6 adaptor molecules of the transcription factor nuclear factor κB signaling pathway in ID8-p53−/− cells and decreases production of the downstream neutrophil chemoattractant, C-X-C motif chemokine ligand 1. In addition to HGSC, tumoral miR-146a expression also correlates strongly with CTL infiltration in other cancer types including thyroid, prostate, breast, and adrenocortical cancers. Altogether, our findings highlight the ability of miR-146a to overcome immune suppression and improve CTL infiltration in tumors.
Keywords: ovarian cancer, microRNAs, tumor microenvironment, nanotherapeutics, immunology
Graphical abstract
Wu and colleagues showed miR-146a expression is positively correlated with anti-cancer immune signatures in tumors. miR-146a treatment results in significant increase in cytotoxic T cell infiltration and decrease in infiltration of immunosuppressive neutrophils in HGSC tumors. The study highlights the potential of utilizing miR-146a to overcome immune suppression in cancer.
Introduction
High-grade serous carcinoma (HGSC) is the most common and deadly subtype of ovarian cancer.1,2 First-line treatments for HGSC include debulking surgery and platinum-based chemotherapy.3,4 Despite these treatments, patients frequently relapse with recurrent ovarian cancer, which is resistant to chemotherapy and almost uniformly fatal.4,5,6 Although targeted therapies such as bevacizumab and poly-ADP-ribose polymerase inhibitors have recently been approved for selected patients, effective therapies are still limited for those with recurrent ovarian cancer.7 Tumors can masterfully sculpt their environment and reprogram innate (neutrophils, macrophages, dendritic cells [DCs], monocytes, natural killer [NK] cells) and adaptive (B cells and T cells) immune cells to impact tumor fate.8 Poor overall survival (OS) is often associated with tumor immune evasion, and improved OS is positively correlated with the presence of tumor-infiltrating lymphocytes, such as cytotoxic T cells (CD8+).9,10 Thus, enhancing cytotoxic T cell function and infiltration to improve anti-tumor immune responses holds great promise in improving patient survival.9
Current immunotherapies such as immune checkpoint inhibitors (ICIs) have shown great promise in many cancer types but have limited efficacy in HGSC.6,7,9,11,12 Clinical trials report ICIs, such as anti-programmed cell death receptor ligand 1 (anti-PD-L1) (e.g., avelumab) and anti-programmed cell death protein-1 PD-1 (anti-PD-1) (e.g., pembrolizumab, nivolumab) to have maximal response rates of only 9.7%–15% in HGSC.6,13,14,15,16 Identified factors that contribute to the clinical failure of immunotherapy include tumor heterogeneity, low tumor mutational burden, and the immune suppressive tumor microenvironment (TME) and associated low tumoral cytotoxic T cell infiltration.7,10,11,12,17 Immune cells such as neutrophils, monocytes (suppressive subtypes often referred to collectively as myeloid-derived suppressive cells [MDSCs18]), regulatory T cells, and macrophages present in the TME can contribute to suppression of cytotoxic T cell-mediated anti-tumor effects.19 Here, we sought to overcome immune suppression and improve cytotoxic T cell infiltration in ovarian tumors using microRNA (miRNA). miRNAs are single-stranded RNA molecules that are non-coding and typically 19–25 nucleotides in length.20,21 These endogenous molecules play important roles in immunity, inflammation, and cancer through their ability to incorporate into the RNA-induced silencing complex and inhibit mRNA translation.22,23,24 miRNAs can be tumor suppressive or tumor promoting depending on their target genes,21 and cancer cells constantly change themselves and the TME through aberrant expression of miRNA.25 As miRNA can target several hundreds of genes to modulate multiple signaling pathways simultaneously to prevent pathway redundancy, they are an attractive modality for therapeutic interventions, with several miRNA-based therapeutics already having reached clinical trials.26,27,28
Aberrant miRNA expression within tumor cells can regulate cancer cell biology such as cell proliferation, apoptosis, and migration,21 and also affect cancer immunity.23,25 Several miRNAs have been shown to regulate secretion of cytokines and chemokines, which can remodel the TME leading to activation, suppression, or altered infiltration/expansion of immune cells.21,25,29,30 For example, in colorectal cancer, miR15a/16-1 can inhibit nuclear factor κB (NF-κB) signaling to limit C-X-C motif chemokine ligand 9 (CXCL9) and CXCL10 production, and limit tumor infiltration of immunosuppressive B cells.31 The ability to modulate immune activities make miRNA an appealing target for restoring anti-tumor immune responses.21,25 Knowledge of how miRNA expression in tumor cells regulates cancer hallmarks and the immune response is steadily expanding.20 In ovarian cancer, it has been shown that tumoral miR-20a suppresses NK cell-mediated killing of tumor cells,32 and restoration of miR-424 expression in cancer cells improves chemosensitivity through targeting PD-L1.33 Although these studies are informative, knowledge on how miRNAs can enhance infiltration and activity of cytotoxic T cells in HGSC tumors is currently lacking.
In this study, we aimed to systematically identify miRNA(s) important for regulating tumoral infiltration of CD8+ T cells in HGSC. This was achieved through systematic analysis of genomic profiling of human HGSC tumors and subsequent in vivo validation using murine ovarian cancer models. We examined the impact of the key miRNA identified, miR-146a, on tumor growth and tumoral immune networks, and dissected the cellular and molecular mechanisms by which this miRNA alters anti-tumor immune responses in HGSC. Collectively, our findings highlight the role of miR-146a in overcoming immune suppression and improving CD8+ T cell infiltration in HGSC. MiR-146a use thus represents a promising avenue for enhancing anti-tumor immune responses in this disease.
Results
Identification of miR-146a as potent regulator for CD8+ T cell infiltration in human tumors
CD8+ T cells have been shown to be important in determining response to current immune therapies and be positively linked with anti-cancer immune gene signatures.34 Thus, to identify miRNAs important for regulating CD8+ T cell infiltration in HGSC tumors, we first investigated the correlation between tumoral miRNA and CD8 mRNA levels for 54 miRNAs that have positive correlation with patient OS in HGSC. These 54 miRNAs were identified using the OncomiR platform. Of these 54 miRNAs, 3 and 4 miRNAs showed positive and negative correlations with tumor CD8 mRNA level, respectively (Figure 1A). We subsequently focused on miRNA with positive correlation to CD8 mRNA level for further investigation due to the ease of re-expressing these miRNAs in tumors using miRNA mimics.35 miR-150 and miR-146a showed the strongest positive correlation to CD8 mRNA level (coefficients of 0.52 and 0.33, respectively). As both miR-150 and miR-146a are expressed in immune cells, we next sought to ascertain whether expression of miR-150 and miR-146a in ovarian tumor cells themselves can indeed lead to perturbation in immune regulatory pathways favorable for CD8+ T infiltration. To address this question, negative control miRNA (miR-Ctrl), miR-150, and miR-146a mimics were transfected into murine HGSC cells in triplicate and gene expression changes were evaluated using Illumina whole-genome expression analysis at 48 h post-transfection (Table S1). We used the QIAGEN Ingenuity Pathway Analysis (IPA)36 pathway enrichment bioinformatic tool to identify canonical pathways relevant for CD8+ T cell infiltration (Figure 1B). Pathway analyses were performed for both miRNAs and miR-Ctrl was used as the reference control. How miR-150 and miR-146a affected these pathways are presented in Figure 1B, with a higher –log10(p value) indicating more significant effects. Globally, miR-146a had much more profound effects on these pathways relevant for CD8+ T cell infiltration when compared with miR-150, indicating its potential in regulating CD8+ T cell trafficking in tumors. Indeed, in addition to HGSC, tumoral miR-146a expression also correlates strongly with CD8 mRNA level in multiple cancer types including thyroid, prostate, breast, and adrenocortical cancers (Figure 1C). To ascertain that miR-146a does not simply affect CD8+ T cell infiltration but has an overall favorable effect on anti-tumor immunity in HGSC, we next examined the correlation between tumoral miR-146a expression and the 68 anti-cancer immune signatures previously reported34 using TCGA ovarian cancer dataset. It was shown that miR-146a had an overall positive correlation with these gene signatures important for anti-cancer immunity (Figure 1D). It was thus hypothesized that enhancing miR-146a expression in HGSC tumors can improve anti-tumor immunity and enhance CD8+ T cell response, which in turn can lead to better tumor control.
Figure 1.

Identification of miR-146a as a potent regulator for CD8+ T cell infiltration in HGSC
(A) Correlation between tumoral miRNA expression and CD8 mRNA level in human HGSC tumors. Correlation analysis was performed on a list of 54 miRNAs that are positively correlated with overall survival (OS) for patients with HGSC. miRNAs that had either positive or negative correlations with CD8 mRNA level are shown. (B) Impact of miR-150 and miR-146a treatments on canonical pathways important for CD8+ T cell infiltration. miR-Ctrl, miR-150, and miR-146a were transfected into ID8-ip1 cells and whole-genome expression analysis was performed at 48 h post-transfection. Pathway enrichment analyses were performed using QIAGEN IPA software. (C) Correlation between tumoral miR-146a expression and CD8 mRNA level across different solid tumor types in TCGA. Tumor types shown include adrenocortical carcinoma (ACC), bladder urothelial carcinoma (BLCA), breast invasive carcinoma (BRCA), cervical squamous cell carcinoma and endocervical adenocarcinoma (CESC), cholangiocarcinoma (CHOL), head and neck squamous cell carcinoma (HNSC), kidney chromophobe (KICH), kidney renal clear cell carcinoma (KIRC), brain lower grade glioma (LGG), liver hepatocellular carcinoma (LIHC), lung adenocarcinoma (LUAD), lung squamous cell carcinoma (LUSC), ovarian serous cystadenocarcinoma (OV), pancreatic adenocarcinoma (PAAD), pheochromocytoma and paraganglioma (PCPG), prostate adenocarcinoma (PRAD), sarcoma (SARC), stomach adenocarcinoma (STAD), testicular germ cell tumors (TGCT), thyroid carcinoma (THCA), thymoma (THYM), uterine corpus endometrial carcinoma (UCEC), uterine carcinosarcoma (UCS), and uveal melanoma (UVM). No correlation was found in colon adenocarcinoma (COAD), esophageal carcinoma (ESCA), kidney renal papillary cell carcinoma (KIRP), rectum adenocarcinoma (READ), and skin cutaneous melanoma (SKCM). (D) Correlation between tumoral miR-146a expression and anti-cancer immune signatures in TCGA ovarian cancer dataset.
Increased tumoral miR-146a expression in vivo reduces tumor burden
To investigate whether increasing miR-146a expression in tumors can reduce ovarian tumor progression in vivo and improve cancer immunity, nanoparticles (NPs) containing negative miR-Ctrl or miR-146a were intravenously injected into C57BL/6J mice bearing luciferase (Luc)-labeled ID8-p53−/− tumors (Figure 2A). These HGSC murine tumor cells lack p53 expression, which resembles the p53 mutation status commonly seen in human HGSC tumors.37 The NPs utilized can passively target tumors, taking advantage of the enhanced permeability and retention effects in solid tumors.38 Indeed, qPCR analysis showed that, in omental tumors, a major site of ovarian cancer metastasis, there was a 3-fold higher miR-146a level in mice that received miR-146a NP therapy compared with mice that received miR-Ctrl treatment (p < 0.01, Figure 2B), indicating that NP delivery of miRNA to tumors was successful. A similar trend was seen in tumors located at other organ sites (other tumors), where a 2-fold increase was observed (p < 0.01, Figure 2B). Importantly, this level of difference between control and treatment group resembles the difference in miR-146a levels seen in human HGSC tumors in TCGA ovarian cancer dataset.
Figure 2.

Impact of miR-146a-nanoparticle treatment on tumor growth in immune competent C57BL/6J mice bearing ID8-p53−/−-Luc tumors
(A) C57BL/6J mice were inoculated with 2.5 × 10⁶ luciferase-labeled ID8-p53−/− cells in the peritoneal cavity and mice received miR-control (Ctrl) or miR-146a-containing nanoparticles (NPs) (20 μg/dose) intravenously twice per week for 4.5 weeks, starting from day 7 (n = 5/group). All mice were sacrificed at 48 h after receiving last dose of NPs on day 39 post-tumor inoculation. Ascites were drained and tumors located in omentum (primary site of tumor growth) and other sites in the peritoneal cavity (other tumors) along with mesenteric and inguinal lymph nodes were dissected. (B) Relative expression of miR-146a in omental and other tumors at 48 h after last dose of i.v. treatment of miR-Ctrl and miR-146a-containing NPs (∗p < 0.05, n = 5/group). (C) Difference in tumor growth in miR-Ctrl and miR-146a treatment groups as indicated by luciferase signal over time throughout the study. Total radiance signal (photons/s) was quantified using the IVIS imaging system (∗∗p < 0.01, n = 5/group). (D) Aggregate tumor weight for mice treated with miR-Ctrl and miR-146a-containing NPs on day 39 post-tumor cell inoculation (∗p < 0.05, n = 5/group). All bars and error bars represent mean ± SEM. Mann-Whitney tests performed for statistical analyses.
Tumor growth was monitored via luminescence imaging of luciferase-tagged ID8-p53−/− tumors (Figure S1) and showed a striking decrease in tumor levels with miR-146a NP therapy (Figure 2C). Correspondingly, at endpoint, a significant decrease in total tumor weight was also observed in mice that received miR-146a NP treatment compared with the mice that received miR-Ctrl NPs (45% reduction, Figure 2D, p < 0.05), indicating that miR-146a had a strong anti-tumor effect. As expression of miR-146a within various immune cells is known to exert immunoregulatory functions,39,40 we sought to investigate whether this anti-tumor effect was driven by tumoral expression of miR-146a. To also assess whether the anti-tumor effect observed can be extended to another HGSC model, we inoculated C57BL/6J mice with transduced murine IG10-Luc cells, which have constant enforced miR-146a or miR-Ctrl expression. Unlike the NP delivery approach, increased miR-146a expression is confined to tumor cells in this model. Consistent with what was observed in mice that received miR-146a NP treatment, mice bearing IG10-Luc-miR-146a tumors had a significant reduction in total tumor weight by 81% compared with mice bearing IG10-Luc-miR-Ctrl tumors (p < 0.01, Figure S2). This suggests increased miR-146a expression within tumor cells can significantly reduce tumor progression.
Given miR-146a’s correlation to anti-cancer immune signatures in human HGSC tumors (Figure 1), we hypothesized that miR-146a expression in tumor cells modulates the TME to increase anti-tumor immune responses, thereby leading to reduced tumor burden. To eliminate the possibility that miR-146a reduced tumor burden by intrinsically regulating cell growth mechanisms within tumor cells, we assessed the effects miR-146a has on ovarian cancer cell growth in vitro, where miR-146a was transfected into murine and human HGSC cells. For transfection, lipid-based NPs were used, which are structurally similar to those used for in vivo miRNA delivery; however, they are not PEGylated and have a 1,2-dioleoyl-sn-glycero-3-phosphoethanolamine (DOPE) fusogenic lipid to aid in vitro uptake efficiency. Cell growth was monitored by counting cell numbers for 7 consecutive days post-transfection and transfection efficiency was verified with miRNA-specific qPCR. The expression of miR-146a was increased by >15,000-fold in ID8-p53−/− cells at 24 h post-transfection. Despite this level of increase being much higher than the level achieved in tumors in vivo, these ID8-p53−/− cells showed no significant change in cell growth up to 7 days post-miR-146a transfection (Figure S3A). Similarly, the IG10-Luc-miR-Ctrl and IG10-Luc-miR-146a transduced cells that have constant expression of miR-Ctrl or miR-146a, respectively (>250-fold increase in miR-146a expression, p < 0.0001), also did not show significant differences in cell growth patterns (Figure S3B). To test if this phenomenon extends to HGSC cells of human origin, miR-146a transfection into OVSAHO cells was performed. Similar to what was observed in murine HGSC lines, miR-146a treatment did not significantly affect cell growth (>1,500-fold increase in miR-146a expression in OVSAHO cells at 24 h, Figure S3C). These observations suggest that miR-146a does not directly impact intrinsic cell growth mechanisms of HGSC cells. We, thus, hypothesize that the reduction in tumor weight seen in vivo is due to the impact miR-146a has on the TME, in particular anti-cancer immune networks, given the strong positive correlation this miRNA has with CD8 mRNA levels in ovarian tumors (Figure 1).
miR-146a NP delivery improves CD8+ T cell infiltration in ID8-p53−/− tumors
To investigate the impact of miR-146a on tumoral immune networks, omental tumors from the ID8-p53−/− tumor-bearing C57BL/6J mice that received miR-Ctrl or miR-146a NP delivery were assessed via flow cytometry. For myeloid immune cells, there was a significant increase in the percentage of DCs (p < 0.05) and monocytes (p < 0.01) within CD45+ leukocytes in miR-146a NP-treated tumors compared with control (Figure 3A). These changes, however, are less apparent when absolute cell counts within tumors were considered (Figure S4A). In addition, a trend of decrease in Ly6G+ neutrophils in omental tumors was observed after miR-146a delivery, both when data were expressed as a percentage of CD45+ cells (Figure 3A) and as cells/g of tumor (p < 0.05, Figure S4A). In ascites, myeloid cell populations also highlighted a trend of decrease in neutrophils (Figure S4B).
Figure 3.

Effect of miR-146a nanoparticle treatment on myeloid and lymphoid populations in ID8-p53−/−-Luc tumors
Flow cytometry was used to examine the presence of (A) myeloid and (B) lymphoid immune cell types in miR-control (Ctrl) or miR-146a-containg nanoparticle-treated tumors (20 μg/dose) at the end of the therapeutic experiment. Cell populations were expressed as a percentage of total CD45+ cells (∗p < 0.05, ∗∗p < 0.01, n = 5/group). (C) The intra-tumoral location of CD8+ T cells were examined by staining omental tumor sections obtained from each mouse using mouse CD8 antibodies. Representative images of the CD8 staining is shown (left panel). Quantification of the number of infiltrated CD8+ T cells based on an average from five randomly selected high-power field (HPF) (200×) regions from each tumor section (right panel; ∗∗p < 0.01, n = 5 tumors/group). Scale bar, 100 μm. All bars and error bars represent mean ± SEM. Mann-Whitney tests performed for statistical analyses.
Regarding lymphoid immune cells, there was minimal change in the number of B, NK, and NKT cells in ID8-p53−/− tumors following miRNA treatments (Figures 3B andS5). Although the total number of CD8+ T cells remained similar between the miR-146a and miR-Ctrl NP treatment groups, we questioned whether miR-146a increased CD8+ cell infiltration into tumor islets. Given that flow cytometry analysis cannot indicate spatial distribution or distinguish between cells within the tumor islet vs. cells located at the tumor periphery, we performed immunohistochemical staining to quantify the number of CD8+ T cells infiltrating into tumor islets (Figure 3C, left panel). Quantification of five randomly selected regions of each tumor, taken at 200× magnification, revealed that tumors from miR-146a NP-treated mice had significantly more CD8+ T cells intratumorally compared with miR-Ctrl-treated tumors (p < 0.01, Figure 3C, right panel). This result indicates the positive impact of miR-146a expression on CD8+ T cell infiltration in these tumors. While additional assessment on T cell distribution would be beneficial in miR-Ctrl and miR-146a-expressing IG10 tumors, the dramatic decrease in tumor weight caused by miR-146a expression in this model precluded this analysis.
In addition to the impact of miR-146a on myeloid and lymphoid populations in tumors, we also assessed the effects of miR-146a NP delivery on activity of antigen-presenting cells (APCs) in tumors, ascites, and lymph nodes. For this investigation, flow cytometry was used to measure the expression of the co-stimulatory marker CD86 on APCs (B cells, DCs, and macrophages). Mice that received miR-146a NP treatment had significantly higher CD86 expression in B cells, DCs, and macrophages in omental tumors (Figure 4A). Significant increases in CD86 mean fluorescence intensity on the surface of these cells were also observed in ascites (Figure 4B) and lymph nodes (Figure 4C). CD86 is an established hallmark of DC maturation,41 is upregulated following B cell activation, and is needed by macrophages, DCs, and B cells to promote co-stimulation of T cells via CD28.42,43 Therefore, increased CD86 expression could indicate improved antigen-presenting processes within these APCs, which can indirectly improve T cell responses in tumors.
Figure 4.

Effect of miR-146a-nanoparticle treatment on CD86 expression in antigen-presenting cells and intratumoral neutrophil infiltration
Flow cytometry was used to measure CD86 mean fluorescence intensity (MFI), a serogate marker for activity, in antigen-presenting cells in (A) omental tumors, (B) ascites, and (C) lymph nodes (∗p < 0.05, ∗∗p < 0.01, n = 5/group). (D) Omental tumor sections were stained using anti-mouse Ly6G-AF647 (red) and Hoechst 33342 (blue) to quantify number of infiltrating neutrophils (left panel). Scale bar, 100 μm. Quantification of the number of infiltrated Ly6G+ neutrophils is shown (right panel) for miR-Ctrl or miR-146a-treated tumor sections, based on an average from five randomly selected regions taken at 200× magnification for each tumor (HPF; n = 5/group, ∗∗p < 0.01). All bars and error bars represent mean ± SEM. Mann-Whitney tests performed for statistical analyses.
Tumor cell antigen presentation capability is not improved by miR-146a treatment
We hypothesized that miR-146a improved the cancer immunity cycle44 and thus CD8+ T cell responses by enhancing presentation of cancer neoantigens on the tumor cell surface. Commonly, tumor cells downregulate antigen processing machinery to evade recognition and destruction by immune cells.45 To allow evaluation of how antigen presentation machinery is influenced by miR-146a, we analyzed whole-genome expression data whereby ID8-ip1 cells were treated with miR-146a mimics (Table S1). QIAGEN IPA36 and metascape46 gene enrichment bioinformatic tools combined with literature search were utilized to identify genes important for antigen presentation. Changes in expression of these genes are presented in Figure S6. Some of these genes showed changes in expression after miR-146a transfection in a direction which could be beneficial for antigen presentation, for example the increase in heat shock protein family A (Hsp70) member 8 (HSPA8) mRNA, a molecular chaperone that can capture peptide intermediates for presentation on MHC molecules.47 However, there were also changes seen which would be unfavorable for antigen presentation. In particular, MHC-I murine components β2M, H2-D1, and H2-K1,48 which are vital for the MHC-I pathway were downregulated (50%, 29%, and 13% decrease, respectively). Based on these findings, we concluded that it is unlikely that miR-146a enhances the T cell response in tumors through the improvement of cancer antigen presentation by tumor cells.
Tumor-infiltrating immunosuppressive neutrophils are reduced with increased miR-146a expression in ID8-p53−/− tumor model
Next, we investigated whether miR-146a could have effects on ovarian cancer cells that could alter expression of genes involved in T cell migration, and thereby explain the observed increase in CD8+ T cell infiltration in tumors. Using the ID8-ip1 whole-genome expression analysis aforementioned, we focused on genes with a ≥2-fold change in expression post-miR-146a transfection, which are classified to be relevant for T cell migration/movement in QIAGEN IPA36 and metascape46 software (Figure S7). A survey of current research on these genes revealed that, for the most part, changes observed upon miR-146a treatment were unlikely to lead to altered T cell infiltration, with the exception of chemokines CCL2, CCL5, CXCL10, and CXCL12, which can recruit T cells.49 CCL2, CCL5, and CXCL10 mRNA, however, were downregulated and would not explain the observed increase in CD8+ T cell infiltration in tumors. CXCL12 mRNA was upregulated by approximately 2-fold. However, existing research indicates that this chemokine can repel T cells at high concentrations due to leukocyte fugetaxis,49 and impedes differentiation of naive T cells into effector CD8+ T cells.50 Thus, these data suggest that miR-146a is unlikely to alter expression of genes in cancer cells which are direct mediators of T cell migration.
We next directed our investigations to other immune cell types that miR-146a affected in vivo, which could interact with T cells and lead to the increased CD8+ T cell infiltration. A trend of decrease in neutrophils within omental tumors was seen via flow cytometry after miR-146a treatment (Figures 3A and S4A). Neutrophil infiltration in tumors is associated with poor prognosis,51,52,53,54 and furthermore neutrophils can exert many pro-tumor actions.53 One of the ways neutrophils can affect cancer progression is through indirect55 and direct suppression of CD8+ T cell anti-tumor responses,53,56,57 which has been reported to reduce CD8+ T cell infiltration.58,59 Using immunohistochemistry, we further stained omental tumor sections from the ID8-p53−/− in vivo model with Ly6G, a marker commonly used to identify neutrophils in immunohistochemical staining,60,61 to assess spatial distribution of neutrophils within tumor islets. Ly6G+ neutrophils were present intratumorally within ID8-p53−/− tumors that received miR-Ctrl or miR-146a NP treatment. Quantification of five randomly selected regions of each tumor taken at 200× magnification revealed there were significantly fewer Ly6G+ neutrophils in tumors from mice treated with miR-146a compared with mice treated with miR-Ctrl (p < 0.05, Figure 4D).
Neutrophils typically play key immunosuppressive roles in the TME18 and are considered part of the MDSC population.18 The suppressive effects neutrophils exert on CD8+ T cells has been reportedly linked to the N2 tumor-associated neutrophil phenotype.57 In the ID8-p53−/− tumor model in vivo, we found on average 95% of neutrophils in omental tumors express CD182, an N2 marker62 (Figure S8). This suggests that neutrophils in the late stage ID8-p53−/− tumor model are characteristic of the immunosuppressive, pro-tumor N2 phenotype, and therefore have the capability to exert pro-tumor functions and inhibit CD8+ T cells. The significant decrease of immunosuppressive neutrophils following miR-146a treatment is, thus, a likely cause for the improved CD8+ T cell infiltration observed.
MiR-146a targets TRAF6 and IRAK1 to decrease production of neutrophil chemoattractant CXCL1
We next investigated how miR-146a in cancer cells could lead to gene expression changes that have a direct impact on neutrophil tumor infiltration. QIAGEN IPA36 and metascape46 analyses identified 20 genes involved in neutrophil migration/movement that had a ≥2-fold change in expression in our whole-genome expression analysis. From this analysis, we identified that the chemokine CXCL1 was downregulated significantly by 88% (p < 0.01, Figure 5A), and chose to focus on this chemokine due to its known role as a potent neutrophil chemoattractant.63,64 As TargetScan, miRWALK, and mirDIP miRNA target prediction software indicated that miR-146a was not highly predicted to bind CXCL1 mRNA (mirDIP prediction score class: low), molecules upstream of CXCL1 transcription that miR-146a might target were investigated (Figure 5B). QIAGEN IPA36 software revealed that NFKB1 (p50) and RELA (p65) are upstream of CXCL1 production and have experimentally observed links to miR-146a. p50 and p65 proteins dimerize to form the DNA-binding transcription factor, NF-κB, which is known to induce expression of CXCL1.65
Figure 5.

Impact of miR-146a treatment on expression of genes important for neutrophil migration and movement in tumors
ID8-ip1 ovarian cancer cells were transfected with miR-Ctrl or miR-146a at 40 nM and changes in gene expression was analyzed at 48 h post-transfection. QIAGEN IPA36 and metascape46 software were used to analyze gene expression data. (A) Genes that were either upregulated or downregulated by ≥2-fold, which are also involved in neutrophil migration, movement, chemotaxis, immune process, and activation functions, are presented. (B) QIAGEN IPA36 analysis of genes upstream of CXCL1 that are experimentally linked to miR-146a. (C) Concept figure of the molecular mechanism by which miR-146a modulates CXCL1 expression. All bars and error bars represent mean value ± SEM (n = 3/group, ∗p < 0.05, ∗∗p < 0.01, ∗∗∗p < 0.001, ∗∗∗∗p < 0.0001). Unpaired Student’s t test performed for statistical analyses.
While p50 and p65 have experimentally observed links with miR-146a, p50 and p65 mRNA are not predicted miR-146a direct targets (mirDIP prediction score class: low). However, tumor necrosis factor receptor-associated factor 6 (TRAF6) and IL-1 receptor-associated kinase 1 (IRAK1) are critical adaptor molecules in NF-κB signaling, and have been shown to be targets of miR-146a66 in other cancer types.67 Upon ligand engagement of specific receptors, including TLRs, TNFR and IL-1R, IRAK1 binds to TRAF6 to mediate IkB kinase complex activation, resulting in dimerization of p50 and p65 to form NF-κB.68 We therefore hypothesize that miR-146a directly targets TRAF6 and IRAK1 mRNA in ovarian cancer cells to inhibit NF-κB signaling and the production of NF-κB target gene, CXCL1 (Figure 5C).
In the whole-genome expression data, TRAF6 mRNA was downregulated significantly by 54% after miR-146a transfection (Figure 6A, p < 0.05), with TargetScan showing in silico prediction of three miR-146a binding sites within conserved regions of the 3′ UTR of the murine TRAF6 mRNA transcript (Figure S9). Similarly, genome expression data show IRAK1 to be significantly downregulated by 61% after miR-146a transfection (Figure 6B, p < 0.05), and TargetScan also indicates two miR-146a binding sites within conserved regions of the 3′ UTR of the murine IRAK1 mRNA transcript (Figure S9). We next assessed the effects of miR-146a on TRAF6, IRAK1, and CXCL1 expression in vitro using qPCR to further validate our proposed molecular mechanism. We transfected miR-146a into ID8-p53−/− cells to observe how a transient increase in miR-146a would impact TRAF6, IRAK1, and CXCL1 expression. At 72 h post-transfection, there were significant decreases in TRAF6 (32% decrease, p < 0.001), IRAK1 (41% decrease, p < 0.001), and CXCL1 (70% decrease, p < 0.0001) mRNA levels (Figure 6C). These data indicate that, in ID8-p53−/− cells, miR-146a can downregulate both TRAF6 and IRAK1, which leads to subsequent CXCL1 downregulation.
Figure 6.

Direct and indirect targeting of TRAF6, IRAK1, and CXCL1 by miR-146a
Impact of miR-146a treatment on (A) TRAF6 and (B) IRAK1 mRNA expression in ID8-ip1 ovarian cancer cells at 48 h post-transfection (40 nM treatment). (C) Relative mRNA expression of TRAF6, IRAK1, and CXCL1 at 72 h post-transfection in ID8-p53−/− cells transfected with miR-Ctrl or miR-146a at 40 nM using DOTAP:DOPE nanoparticles. Representative data from three independent experiments are shown (n = 3). All bars and error bars represent mean ± SEM (∗p < 0.05, ∗∗∗p < 0.001, ∗∗∗∗p < 0.0001). Unpaired Student’s t test performed for statistical analyses.
Collectively, our findings suggest a mechanism through which miR-146a targets IRAK1 and TRAF6 in HGSC cells to decrease NF-κB signaling and CXCL1 production, leading to decreased infiltration of neutrophils into tumors. As neutrophils are known to suppress CD8+ T cells, mechanistically the neutrophil decrease would allow improved infiltration in CD8+ T cells into tumors, as we observed in vivo (Figure 7). Altogether, the decrease in neutrophils and increase in CD8+ T cells intratumorally represents improved anti-tumor immune responses in tumors, and provides a cellular mechanism by which miR-146a reduces tumor burden in vivo.
Figure 7.

A schematic showing the cellular and molecular mechanisms by which miR-146a mediates its anti-tumor effect
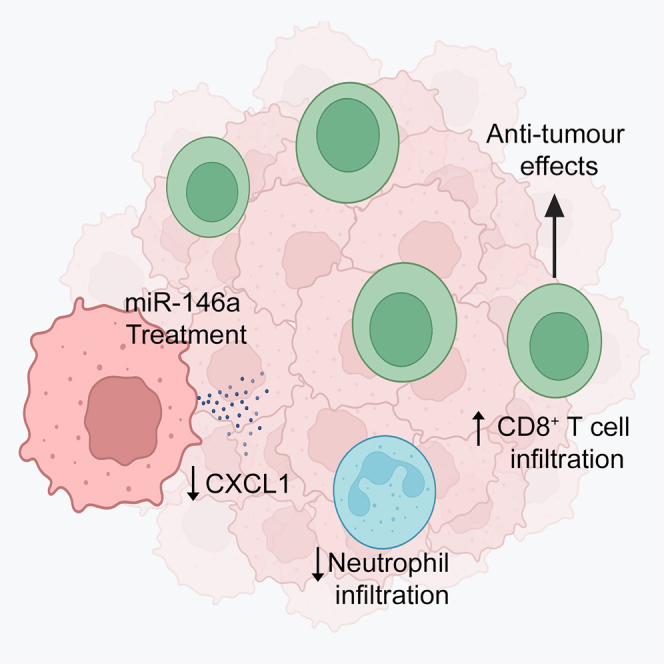
miR-146a directly targets and inhibits the adaptor molecules IRAK1 and TRAF6 in cancer cells to decrease NF-κB signaling and activation. Transcription of NF-κB signaling target CXCL1 is consequently reduced. The reduction of CXCL1 chemokine in the tumor microenvironment subsequently decreases neutrophil infiltration in tumors. This decrease in neutrophils can enhance CD8+ T cell infiltration in tumors. Collectively, the decrease in neutrophils and increased CD8+ T cells favors improved cancer immunity and leads to decreased tumor progression. Image generated using BioRender.
Discussion
Immune therapies such as anti-PD-L1 and anti-PD-1 ICIs have thus far shown promising results in many cancer types.69 However, only a 9.7%–15% objective response rate has been observed in patients with ovarian cancer.6,13,14,15,16 One of the reasons for this low response rate is the immunosuppressive TME, which prevents effective penetration of CD8+ T cells into tumors. Understanding how miRNA can overcome this immune suppression to favor anti-tumor immune responses will assist the development of future immune therapy combinations for treatment of ovarian cancer. In this study, we identified that miR-146a expression is positively correlated with CD8 mRNA level in many cancer types including HGSC, and provide evidence that increased miR-146a expression in ID8-p53−/− and IG10 murine ovarian cancer models can significantly reduce tumor burden. We find that miR-146a NP therapy results in a significant decrease in immunosuppressive neutrophil and an increase in CD8+ T cell tumor infiltration that corresponds with reduced tumor burden. Further investigation into the mechanisms showed that miR-146a targets IRAK1 and TRAF6 adaptor proteins of NF-κB signaling in ID8-p53−/− cells, leading to a significant decrease in the potent neutrophil chemoattractant, CXCL1.63
Aberrant expression of miR-146a within cancer cells has been implicated in cancer progression in several cancer types70; however, the exact functions of miR-146a in carcinogenesis remains unclear.71 This is due to conflicting reports on miR-146a’s role because, within some cancers miR-146a has tumor suppressor functions; however, in other types it has oncogenic effects.67 In ovarian cancer, miR-146a has been reported to be tumor suppressive within in vitro studies.72,73,74 In studies utilizing human advanced ovarian serous cancer primary tumors, it has been found that miR-146a expression is positively correlated with OS.75 To the best of our knowledge, no studies have utilized in vivo murine models to assess miR-146a effects in ovarian cancer. Here, we have shown that increased levels of miR-146a in murine ID8-p53−/− and IG10 tumors significantly reduce tumor burden, which is in accordance with existing research that miR-146a is tumor suppressive in ovarian cancer.72,73,74 Surprisingly, we found exogenous miR-146a expression in the murine ID8-p53−/− and IG10 and human OVSAHO HGSC models have no significant influence on growth in vitro, pointing toward miR-146a’s impact on the TME being important for the anti-tumor effects observed. Previous studies have found miR-146a overexpression can inhibit cancer growth in vitro in human HGSC,72 non-small cell lung cancer,70 hepatocellular carcinoma,76 and breast cancer,77 often through inducing apoptosis. Other studies contrast this, showing that miR-146a overexpression can cause increased cancer growth in vitro in breast cancer,78 and increased proliferation in gastric cancer79 and cervical cancer.80 Taken altogether, previous research and our current findings emphasize the established phenomenon that miRNA exert multifunction, and that miR-146a can have varying effects across different cancers and also within different models of the same cancer type.67
To date, there is strong evidence that miR-146a has an impact on innate immune responses and inflammatory signaling,39,40 often through negative regulation of signaling pathways that lead to NF-κB activation.39,67,81 However, in the context of cancer immunity, miR-146a′s impacts remain largely unreported. Studies have found that miR-146a expression within T lymphocytes acts as an anti-apoptotic factor by targeting FAS-associated death domain protein to inhibit FAS-mediated apoptosis.82 In addition, miR-146a within macrophages contributes to differentiation and activation of these immune cells.83 However, to our knowledge it remains unexplored how altered miR-146a expression within tumor cells has cascading effects on anti-tumor immune responses. We have shown that miR-146a does not have a significant effect on antigen presentation capability of tumor cells. We do find, however, that miR-146a expression is positively correlated with CD8 mRNA level in HGSC human tumors, and that miR-146a delivery in vivo can significantly increase CD8+ T cell infiltration into tumor islets. As CD8+ cytotoxic T cells are the most potent effectors in generating anti-tumor immune responses,84 our findings provide an explanation for the reduction in tumor growth observed in the ID8-p53−/− in vivo model, and implicate miR-146a as a strong inducer of anti-tumor immunity. As stated above, miR-146a is known to intrinsically affect T cell biology, with it previously being shown that miR-146a expression is upregulated during T cell differentiation and activation, and can protect T cells from apoptosis.85,86 However, to our knowledge, no studies have reported the impact of tumoral miR-146a expression on CD8+ T cell infiltration. Notably, it was recently reported that miR-146a−/− mice exhibit increased immune-related adverse events when treated with anti-PD-1 therapy.87 Whether miR-146a therapy will improve the efficacy and safety of anti-PD-1 or other forms of immune therapies, where lack of CD8+ T cell infiltration is a major barrier for effectiveness,10 remains to be investigated in the future.
As we did not find evidence of a mechanism by which miR-146a influences gene expression in cancer cells to directly attract CD8+ T cells into tumors, this indicates that miR-146a′s impact on CD8+ T cell infiltration is likely an indirect effect. Our data suggest that this effect could be mediated by neutrophils. One of the ways in which neutrophils promote tumorigenesis is through indirect55 and direct suppression of CD8+ T cell anti-tumor responses. Neutrophil secretion of arginase 1 and modulation of PD-1 signaling in T cells inhibits T cell proliferation.56 Neutrophils also produce nitric oxide and tumor necrosis factor resulting in T cell apoptosis,53,57 and have also been reported to reduce CD8+ T cell infiltration.58,59 Consequently, the neutrophil decrease in tumors would allow improved CD8+ T cell responses. Indeed, we show that neutrophils in untreated ID8-p53−/− tumors are predominantly positive for the N2 phenotype marker, CD182, with neutrophils of this phenotype being known to be immunosuppressive and to have pro-tumor effects.51 This result is in accordance with existing reports that neutrophils exist as mainly the N2 phenotype in late-stage tumor settings.88,89 Based on this knowledge and the known correlation between neutrophils and poor-prognosis,51 the neutrophil decrease we observe in response to miR-146a signifies highly beneficial alterations of immune responses. This finding highlights how miR-146a can concurrently impact neutrophils in addition to CD8+ T cells to benefit ovarian cancer immunity, and together these observations provide cellular explanations for the decreased tumor burden seen in vivo after miR-146a NP administration. miRNAs have previously been proposed to be involved in neutrophil regulation, with miR-451 being shown to reduce neutrophil chemotaxis by downregulation of p38MAPK signaling within neutrophils in rheumatoid arthritis.90 miR-146a has also been implicated to inhibit the intrinsic ability of neutrophils to form neutrophil extracellular traps through an unknown mechanism.91 This study directly connects miR-146a to neutrophil tumor infiltration. Future experiments examining alteration of the anti-tumor immune response in the absence of neutrophils will further strengthen our knowledge on the cellular mechanisms mediated by miR-146a in the TME.
We showed that miR-146a targeting of TRAF6 and IRAK1 to inhibit NF-κB activation and consequent production of neutrophil chemoattractant, CXCL1, is likely the mechanism by which miR-146a decreases neutrophil infiltration into tumors. miR-146a′s negative regulation of NF-κB signaling through targeting of TRAF6 and IRAK1 has previously been shown in autoimmune disease,39,66 bacterial infection,92 and in cervical, prostate, breast, oral, gastric, lung, and pancreatic cancers,67 but the impact of miR-146a on these two adaptor molecules in ovarian cancer has not been previously established. The downstream effect on CXCL1 from miR-146a treatment has been shown in acute kidney injury models93 and rhinovirus infection.94 In the cancer landscape, Garo et al.22 have shown that miR-146a-deficient mice have increased CXCL1 expression in colorectal cancer models. In these colorectal cancer models, it was found that miR-146a within DCs and macrophages targets receptor-interacting protein kinase 2 to inhibit NF-κB signaling and decreases IL-1β, IL-6, and IL-23, which ultimately decreases downstream IL-17-mediated tumorigenesis. Contrary to their findings, we see minimal changes in these cytokines in our whole-genome analysis, and our data point toward a mechanism independent of IL-17. Together, this suggests that miR-146a′s ability to regulate anti-tumor immune responses is not restricted to targeting of IRAK1 and TRAF6 to decrease CXCL1. However, the anti-tumor response mediated by miR-146a does seem to converge on NF-κB signaling in both colorectal and ovarian cancers. Future examination on how mutations on the 3′ UTR region of these two adaptor proteins could affect miR-146a′s impact on tumor immune networks, or whether overexpression of CXCL1 by tumor cells can rescue tumor growth, will be beneficial. This improved understanding will facilitate the identification of patient populations that will most likely benefit from miR-146a therapy. Altogether, miR-146a′s ability to impact CD8+ T cell infiltration in an indirect manner, likely through preventing chemotaxis of immunosuppressive neutrophils, implies that this miRNA’s effects on cancer immunity are intricate and interconnected. Our data suggests that miR-146a′s known ability to regulate inflammatory signaling through NF-κB is beneficial for anti-tumor immune responses in ovarian cancer and highlight how miR-146a could be harnessed in future immunotherapeutic ovarian cancer interventions. Importantly, the use of miR-146a as an immune modulating agent can also be extended to other cancer types where there are significant positive correlations between tumoral miR-146a and CD8 levels.
Materials and methods
The Cancer Genome Atlas analysis
Correlation between tumoral miRNA expression and overall patient survival was analyzed using the OncomiR platform,95 while correlation of tumoral miRNA expression to tumoral CD8 mRNA expression was obtained using the miRCancerdb platform.96 Both platforms utilize clinical and genomic data from patients included in The Cancer Genome Atlas (TCGA) datasets. For correlation with anti-cancer immune signature analysis, enrichment score of 68 immune signatures previously reported34 was calculated in single-sample gene set enrichment analysis. Clinically annotated data from TCGA obtained from the Open-Access and Controlled-Access tiers of the TCGA Data Portal (http://tcga-data.nci.nih.gov/tcga/findArchives.htm) were used with NIH approval. A total of 347 HGSC patients were included in the analysis. miRNA expression data were obtained from Agilent miRNA microarrays and Illumina miRNA-seq datasets in TCGA. For the miRNA-seq data. We derived the “reads_per_million_miRNA_mapped” values for mature forms for the miRNA examined from the “isoform_quantification” files in TCGA. The correlation analyses were carried out by Python (version 3.8.0) (http://www.python.org/).
Cell culture
ID8, ID8-p53−/−, and IG10 cell lines were kindly provided by Prof. Roby from University of Kansas and Prof. McNeish from Imperial College London. ID8-ip1 cells were generated from isolation of tumor cells after ID8 tumor engraftment in a female C57BL/6 mouse. ID8, ID8-ip1, ID8-p53−/−, and IG10 were cultured in high-glucose Dulbecco’s modified Eagle’s medium (DMEM) (Sigma-Aldrich) supplemented with 6.5% fetal bovine serum (FBS) (Sigma-Aldrich), Insulin Transferrin Selenium (1× ITS, Lonza), 100 U/mL penicillin, and 100 μg/mL streptomycin (Sigma-Aldrich). OVSAHO cells (kindly provided by Profs. Konecny and Anghel from University of California, Los Angeles) were cultured with Roswell Park Memorial Institute 1640 medium (Sigma-Aldrich) supplemented with 10% FBS, 100 U/mL penicillin, and 100 μg/mL streptomycin. All cells tested negative for Mycoplasma contamination.
Generation of miRNA-expressing cell lines
IG10-Luc-miR-Ctrl and IG10-Luc-miR-146a stable-expressing cell lines were generated using lentiviral hCMV-TurboGFP miRNA vectors purchased from Horizon. The IG10 cells were transduced with respective lentiviral vector and selected using growth medium containing puromycin according to the manufacturer’s protocol. miR-146a expression was examined using TaqMan miRNA qPCR.
NP preparation
For liposomal formulation used in in vivo studies, dioleoyl trimethylammonium propane (DOTAP, 18:1), cholesterol, and polyethylene glycol (PEG)2000-C16Ceramide were purchased from Sigma. miRNA-containing liposomal formulations were prepared using the hydration of freeze-dried matrix method described previously.38 A nitrogen/phosphate (N/P) ratio of 4:1 was used for all formulations. Formulations were prepared such that 20 μg of miRNA was contained in 200 μL volume upon hydration. Required amounts of DOTAP, cholesterol, and PEG2000-C16Ceramide were dissolved in tert-butanol and an equal volume of miRNA-containing sucrose solution was then added and mixed well. The amount of sucrose added was 0.925 mg per μg of miRNA used. The resultant formulation was then snap-frozen and freeze-dried overnight (BenchTop Pro, Omnitronics) at a condensing temperature of −80°C and pressure of less than 0.1 mbar. Nuclease-free water was then added to the lyophilized product with gentle shaking and sonication. When hydrated at 20 μg miRNA/200 μL concentration, the amount of sucrose contained in the formulation makes it isotonic, ready for in vivo use. For in vitro studies, liposomal formulations were used using DOTAP and DOPE (Sigma) at 1:1 M ratio. Formulation was made using standard lipid film method followed by hydration using sterile 5% dextrose solution. DOTAP:DOPE formulation was subsequently extruded through 400, 200, and 100 μm membranes (Avanti Polar Lipids). The formulation was then complexed with the miRNA at an N/P ratio of 4:1 before transfection.
Mice
Female C57BL/6J mice (6–8 weeks) were purchased from ARC and housed in University of Queensland (UQ) Center of Advanced Imaging animal facility. Ethics approval for all animal experiments was provided from UQ Animal Ethics Committee. Luciferase-labeled ID8-p53−/− and IG10 cells were grown in culture, and 2.5 × 10⁶ cells were suspended in 200 μL of Hank’s balanced salt solution and intraperitoneally (i.p.) injected into mice unless otherwise specified. The mice received i.p. injection with luciferin every week before the endpoint of the experiment to monitor tumor establishment and progression. After 7–9 min, luciferin bioluminescence images were acquired using an IVIS Lumina X5 imaging system and analyzed by in vivo imaging software. Mice that received miRNA treatment were intravenously injected with negative control miRNA (miR-Ctrl) or miR-146a-containing PEGylated DOTAP-containing NPs twice weekly (20 μg/dose),38 for 4.5 weeks, starting from day 7 post-tumor inoculation. All mice were sacrificed when any mouse in the experiment reached a health score of 3 (Morton Scale). At endpoint, ascites fluid was collected, and tumors in omentum and other organ sites as well as inguinal and mesenteric lymph nodes were dissected from mice in a double-blinded manner. Parts of tissues to be used for immediate flow cytometry analysis were placed in FACS buffer (2% FBS and 5 nM EDTA in PBS), and remaining tissue was embedded in optimal cutting temperature (OCT) compound or snap frozen in liquid nitrogen.
Flow cytometry
Single-cell suspension was obtained from tissues by mashing samples through a 70 μm cell strainer. Cells were centrifuged at 500 rcf for 5 min at 4°C, washed with FACS buffer twice, then resuspended in 85 μL FACS buffer and incubated with anti-mouse CD16/CD32 monoclonal antibody (BD Biosciences, cat. no. 553142) for 15 min on ice. Cells were surface stained with antibodies or respective isotype controls diluted in FACS buffer for 20 min on ice, as listed in Table S2. Markers that were used to define distinct immune cell populations are shown in Table S3. Precision Count Beads (BioLegend) were added according to the manufacturer’s instructions to enable quantification of the absolute number of immune cells in each sample. Samples were analyzed using a BD Fortessa X-20 flow cytometer and FlowJo software.
Transfection of miRNA mimics and cell growth assays
ID8-p53−/− and OVSAHO cells were seeded in 6-well plates and incubated overnight. At 50% confluency, cells were transfected with miR-146a mimic (Life Technologies, cat. no. 4464070) or miR-Ctrl (Life Technologies, cat. no. 4464061) at 40 nM using DOTAP:DOPE NPs for 4 h in serum free medium. For cell growth assessment, transfected or transduced cells were seeded onto 12-well plates at densities dependent on the cell line (ID8-p53−/−, 6,000 cells/well; IG10, 2,000 cells/well; OVSAHO, 25,000 cells/well). Three wells were used for each time point assessed. At 72 h post-transfection, cells were also collected for qPCR analysis.
RNA extraction, cDNA synthesis, and real-time qPCR
At 72 h post-transfection, RNA was isolated from cells using the TRIzol reagent (Life Technologies) according to manufacturer’s protocol. RNA concentration and quality was assessed using NanoDrop-One (Thermo Fisher Scientific). For detection of CXCL1, TRAF6, and IRAK1 mRNA, 1 μg of RNA was reverse-transcribed using an iScript cDNA synthesis kit (Bio-Rad, cat. no. 1708891) according to manufacturer’s protocol. The relative mRNA expression was quantified with qPCR using SYBR green (Thermo Fisher Scientific, cat. no. 4367659) according to manufacturer’s protocol. The average relative expression was calculated using the 2−ΔΔCt method, with β-actin expression used to normalize the data. For detection of miR-146a, 5 ng of RNA was reverse-transcribed using a TaqMan MicroRNA Reverse Transcription Kit (Thermo Fisher Scientific, cat. no. 4366596) and quantified using a TaqMan MicroRNA Assay Kit (Thermo Fisher Scientific, cat. no. 4427975) according to the manufacturer’s protocol. The average relative expression was calculated using the 2−ΔΔCt method, with the expression of SNO135 used to normalize data. All primer sequences are listed in Table S4.
Gene expression studies
ID8-ip1 ovarian cancer cells were transfected at 50% confluency with miR-146a or miR-150 mimic (Life Technologies, cat. nos. 4464070 and 4464066) or miR-Ctrl (Life Technologies, cat. no. 4464061) at 40 nM using Lipofectamine-RNAiMAX (Thermo Fisher Scientific, cat. no. 13778075) transfection reagent according to the manufacturer’s instructions. RNA was isolated from cells at 48 h post-transfection, as described above. Total RNA (500 ng) were used for hybridization and labeled using a MouseWG-6 v.2.0 Expression BeadChip Kit (Illumina). The gene expression data were normalized using the quantile normalization method in the LIMMA package in the R language environment. Expression levels of each gene was transformed into a log2 base before analysis.
Immunohistochemical staining of tumor sections
Immunohistochemistry was performed on 5 μm sections cut from tumors embedded in OCT. Tumor sections were fixed in cold acetone (5 min), followed by cold acetone/chloroform (1:1, 5 min) and cold acetone (5 min). Sections were washed with PBS and incubated for 15 min with 3% H2O2. Slides were then incubated for 1 h at RT with blocking buffer (5% goat serum, 0.1% Triton X-100 in PBS), followed by rat anti-mouse CD8 (Bio-Rad, cat. no. MCA609G, 1:100) antibodies in a humidity chamber overnight at 4°C. Sections were subsequently stained with VECTASTAIN ABC-HRP Kit Peroxidase (rabbit anti-rat IgG, 1:1,000) (Vector-Laboratories, cat. no. PK-4004) and were visualized using DAB (Life-Technologies, cat. no. 750118) and counterstained with Gill no. 3 hematoxylin solution (Sigma-Aldrich, cat. no. GHS316-500ML). A Slide Scanner Zeiss AxioScan Z1 Fluorescent Imager was used to perform whole tissue scans at 20× objective using ZEN software. Five randomly selected 200× magnification high-power field (HPF) images were taken for each tissue section, or maximal number feasible for small tumors. The number of CD8+ cells located within tumor islets were counted in each image and averaged for each tumor.
Immunofluorescence
Immunofluorescent staining was performed on 5 μm sections cut from tumor tissues embedded in OCT. Tumor sections were fixed in 2% paraformaldehyde for 10 min, washed twice with PBS then blocked with 5% goat serum (Sigma-Aldrich), 0.1% Tween 20 (Thermo Fisher Scientific) diluted in PBS for 1 h at RT. Cells were stained with anti-mouse Ly6G AF647 (1:100, BioLegend, cat. no. 127610) for 1 h at 4°C. Sections were subsequently stained with Hoechst 33342 diluted in PBS (1:500) for 10 min. The whole tissue scan was performed using a Slide Scanners Zeiss AxioScan Z1 Fluorescent Imager at 20× objective using ZEN software. Five randomly selected 200× magnification HPF images were taken for each tissue section, or maximal number feasible for small tumors. The number of Ly6G+ neutrophils located within the tumor islets were counted in each image and averaged for each tumor.
Bioinformatic analysis
IPA (QIAGEN, https://digitalinsights.qiagen.com/IPA)36 was used to identify canonical pathways regulated by miR-146a and miR-150. Both Metascape46 and IPA bioinformatic tools were subsequently used to identify genes involved in biological processes such as neutrophil movement, antigen presentation, and T cell movement. IPA software36 was additionally used to identify genes upstream of CXCL1 targeted by miR-146a. miRWALK,97 TargetScan 8.0,98 and mirDIP99 software were used for in silico prediction of miR-146a mRNA target interactions.
Statistical analysis
Data analysis was performed using GraphPad Prism version 8 software or within QIAGEN IPA software. Statistical significance was determined by unpaired two-tailed Student’s t test for normally distributed data or by Mann-Whitney tests for data that are not normally distributed. For IPA pathway analysis, Fisher’s exact test was used. Spearman’s correlation was used to assess miRNA/gene signature correlation using TCGA dataset. Data were presented as mean ± SEM. A p value < 0.05 indicated statistical significance.
Data and code availability
The data that support the findings of this study are available from the corresponding author upon reasonable request.
Acknowledgments
The work was supported by Ovarian Cancer Research Fund Alliance (Liz Tilberis Early Career Award, 373307) and University of Queensland internal funds. Cell lines used in the study were generated and kindly provided by Prof. Roby from University of Kansas, Prof. McNeish from Imperial College London, and Profs. Konecny and Anghel from University of California, Los Angeles. Ly6G and CD182 antibodies were kindly provided by A/Prof Ruitenberg at the University of Queensland. The authors also gratefully acknowledge the helpful advice obtained from Prof. Sood and Dr. Ivan and technical assistance from staff in analytical, imaging, and histological facilities at School of Biomedical Sciences, University of Queensland.
Author contributions
R.C., E.C., S.Y.W., G.I., S. Atluri, S. Adityan, and K.W. performed the in vitro assays. R.C., S.Y.W., C.B., K.W., and L.A. performed the in vivo studies. Y.W., D.Y., M.A.T., E.C., and S.Y.W. performed the bioinformatic analyses. J.-J.S. and J.-S.L. performed the whole-genome expression analysis. W.W.O., A.N.W., and R.S. provided immunological expertise for this study. E.C. and S.Y.W. wrote the manuscript. All authors reviewed and approved the manuscript.
Declaration of interests
The authors declare no competing interests.
Footnotes
Supplemental information can be found online at https://doi.org/10.1016/j.omto.2023.09.001.
Supplemental information
References
- 1.Lisio M.-A., Fu L., Goyeneche A., Gao Z.-H., Telleria C. High-grade serous ovarian cancer: Basic sciences, clinical and therapeutic standpoints. Int. J. Mol. Sci. 2019;20:952. doi: 10.3390/ijms20040952. [DOI] [PMC free article] [PubMed] [Google Scholar]
- 2.Ledermann J.A., Raja F.A., Fotopoulou C., Gonzalez-Martin A., Colombo N., Sessa C., ESMO Guidelines Working Group Newly diagnosed and relapsed epithelial ovarian carcinoma: ESMO Clinical Practice Guidelines for diagnosis, treatment and follow-up. Ann. Oncol. 2013;24:vi24–vi32. doi: 10.1093/annonc/mdt333. [DOI] [PubMed] [Google Scholar]
- 3.Jayson G.C., Kohn E.C., Kitchener H.C., Ledermann J.A. Ovarian cancer. Lancet. 2014;384:1376–1388. doi: 10.1016/S0140-6736(13)62146-7. [DOI] [PubMed] [Google Scholar]
- 4.McCloskey C.W., Rodriguez G.M., Galpin K.J.C., Vanderhyden B.C. Ovarian cancer immunotherapy: Preclinical models and emerging therapeutics. Cancers. 2018;10:244. doi: 10.3390/cancers10080244. [DOI] [PMC free article] [PubMed] [Google Scholar]
- 5.Cortez A.J., Tudrej P., Kujawa K.A., Lisowska K.M. Advances in ovarian cancer therapy. Cancer Chemother. Pharmacol. 2018;81:17–38. doi: 10.1007/s00280-017-3501-8. [DOI] [PMC free article] [PubMed] [Google Scholar]
- 6.Kurnit K.C., Fleming G.F., Lengyel E. Updates and new options in advanced epithelial ovarian cancer treatment. Obstet. Gynecol. 2021;137:108–121. doi: 10.1097/AOG.0000000000004173. [DOI] [PMC free article] [PubMed] [Google Scholar]
- 7.Ning F., Cole C.B., Annunziata C.M. Driving immune responses in the ovarian tumor microenvironment. Front. Oncol. 2020;10:604084. doi: 10.3389/fonc.2020.604084. [DOI] [PMC free article] [PubMed] [Google Scholar]
- 8.Hinshaw D.C., Shevde L.A. The tumor microenvironment innately modulates cancer progression. Cancer Res. 2019;79:4557–4566. doi: 10.1158/0008-5472.CAN-18-3962. [DOI] [PMC free article] [PubMed] [Google Scholar]
- 9.Ghisoni E., Imbimbo M., Zimmermann S., Valabrega G. Ovarian cancer immunotherapy: Turning up the heat. Int. J. Mol. Sci. 2019;20:2927. doi: 10.3390/ijms20122927. [DOI] [PMC free article] [PubMed] [Google Scholar]
- 10.Le Saux O., Ray-Coquard I., Labidi-Galy S.I. Challenges for immunotherapy for the treatment of platinum resistant ovarian cancer. Semin. Cancer Biol. 2021;77:127–143. doi: 10.1016/j.semcancer.2020.08.017. [DOI] [PubMed] [Google Scholar]
- 11.Johnson R.L., Cummings M., Thangavelu A., Theophilou G., de Jong D., Orsi N.M. Barriers to immunotherapy in ovarian cancer: Metabolic, genomic, and immune perturbations in the tumour microenvironment. Cancers. 2021;13:6231. doi: 10.3390/cancers13246231. [DOI] [PMC free article] [PubMed] [Google Scholar]
- 12.Yang C., Xia B.-R., Zhang Z.-C., Zhang Y.-J., Lou G., Jin W.-L. Immunotherapy for ovarian cancer: Adjuvant, combination, and neoadjuvant. Front. Immunol. 2020;11 doi: 10.3389/fimmu.2020.577869. [DOI] [PMC free article] [PubMed] [Google Scholar]
- 13.Matulonis U.A., Shapira-Frommer R., Santin A.D., Lisyanskaya A.S., Pignata S., Vergote I., Raspagliesi F., Sonke G.S., Birrer M., Provencher D.M., et al. Antitumor activity and safety of pembrolizumab in patients with advanced recurrent ovarian cancer: results from the phase II KEYNOTE-100 study. Ann. Oncol. 2019;30:1080–1087. doi: 10.1093/annonc/mdz135. [DOI] [PubMed] [Google Scholar]
- 14.Hamanishi J., Mandai M., Ikeda T., Minami M., Kawaguchi A., Murayama T., Kanai M., Mori Y., Matsumoto S., Chikuma S., et al. Safety and antitumor activity of anti–PD-1 antibody, nivolumab, in patients with platinum-resistant ovarian cancer. J. Clin. Oncol. 2015;33:4015–4022. doi: 10.1200/JCO.2015.62.3397. [DOI] [PubMed] [Google Scholar]
- 15.Hinchcliff E., Hong D., Le H., Chisholm G., Iyer R., Naing A., Hwu P., Jazaeri A. Characteristics and outcomes of patients with recurrent ovarian cancer undergoing early phase immune checkpoint inhibitor clinical trials. Gynecol. Oncol. 2018;151:407–413. doi: 10.1016/j.ygyno.2018.10.008. [DOI] [PMC free article] [PubMed] [Google Scholar]
- 16.Disis M.L., Taylor M.H., Kelly K., Beck J.T., Gordon M., Moore K.M., Patel M.R., Chaves J., Park H., Mita A.C., et al. Efficacy and safety of avelumab for patients with recurrent or refractory ovarian cancer: Phase 1b results from the JAVELIN Solid Tumor Trial. JAMA Oncol. 2019;5:393–401. doi: 10.1001/jamaoncol.2018.6258. [DOI] [PMC free article] [PubMed] [Google Scholar]
- 17.Borella F., Ghisoni E., Giannone G., Cosma S., Benedetto C., Valabrega G., Katsaros D. Immune checkpoint inhibitors in epithelial ovarian cancer: An overview on efficacy and future perspectives. Diagnostics. 2020;10:146. doi: 10.3390/diagnostics10030146. [DOI] [PMC free article] [PubMed] [Google Scholar]
- 18.Veglia F., Sanseviero E., Gabrilovich D.I. Myeloid-derived suppressor cells in the era of increasing myeloid cell diversity. Nat. Rev. Immunol. 2021;21:485–498. doi: 10.1038/s41577-020-00490-y. [DOI] [PMC free article] [PubMed] [Google Scholar]
- 19.Labani-Motlagh A., Ashja-Mahdavi M., Loskog A. The tumor microenvironment: A milieu hindering and obstructing antitumor immune responses. Front. Immunol. 2020;11:940. doi: 10.3389/fimmu.2020.00940. [DOI] [PMC free article] [PubMed] [Google Scholar]
- 20.Alshamrani A.A. Roles of microRNAs in ovarian cancer tumorigenesis: Two decades later, what have we learned? Front. Oncol. 2020;10:1084. doi: 10.3389/fonc.2020.01084. [DOI] [PMC free article] [PubMed] [Google Scholar]
- 21.Xing Y., Wang Z., Lu Z., Xia J., Xie Z., Jiao M., Liu R., Chu Y. MicroRNAs: Immune modulators in cancer immunotherapy. Immunother. Adv. 2021;1:ltab006. doi: 10.1093/immadv/ltab006. [DOI] [PMC free article] [PubMed] [Google Scholar]
- 22.Garo L.P., Ajay A.K., Fujiwara M., Gabriely G., Raheja R., Kuhn C., Kenyon B., Skillin N., Kadowaki-Saga R., Saxena S., Murugaiyan G. MicroRNA-146a limits tumorigenic inflammation in colorectal cancer. Nat. Commun. 2021;12:2419. doi: 10.1038/s41467-021-22641-y. [DOI] [PMC free article] [PubMed] [Google Scholar]
- 23.Paladini L., Fabris L., Bottai G., Raschioni C., Calin G.A., Santarpia L. Targeting microRNAs as key modulators of tumor immune response. J. Exp. Clin. Cancer Res. 2016;35:103–119. doi: 10.1186/s13046-016-0375-2. [DOI] [PMC free article] [PubMed] [Google Scholar]
- 24.Garcia A.I., Buisson M., Damiola F., Tessereau C., Barjhoux L., Verny-Pierre C., Sornin V., Dondon M.-G., Eon-Marchais S., GENESIS investigators, et al. Mutation screening of MIR146A/B and BRCA1/2 3′-UTRs in the GENESIS study. Eur. J. Hum. Genet. 2016;24:1324–1329. doi: 10.1038/ejhg.2015.284. [DOI] [PMC free article] [PubMed] [Google Scholar]
- 25.Zhang Z., Huang Q., Yu L., Zhu D., Li Y., Xue Z., Hua Z., Luo X., Song Z., Lu C., et al. The role of miRNA in tumor immune escape and miRNA-based therapeutic strategies. Front. Immunol. 2021;12 doi: 10.3389/fimmu.2021.807895. [DOI] [PMC free article] [PubMed] [Google Scholar]
- 26.Rupaimoole R., Slack F.J. MicroRNA therapeutics: Towards a new era for the management of cancer and other diseases. Nat. Rev. Drug Discov. 2017;16:203–222. doi: 10.1038/nrd.2016.246. [DOI] [PubMed] [Google Scholar]
- 27.Dasgupta I., Chatterjee A. Recent advances in miRNA delivery systems. Methods Protoc. 2021;4:10. doi: 10.3390/mps4010010. [DOI] [PMC free article] [PubMed] [Google Scholar]
- 28.Hong D.S., Kang Y.-K., Borad M., Sachdev J., Ejadi S., Lim H.Y., Brenner A.J., Park K., Lee J.-L., Kim T.-Y., et al. Phase 1 study of MRX34, a liposomal miR-34a mimic, in patients with advanced solid tumours. Br. J. Cancer. 2020;122:1630–1637. doi: 10.1038/s41416-020-0802-1. [DOI] [PMC free article] [PubMed] [Google Scholar]
- 29.Chakraborty C., Sharma A.R., Sharma G., Lee S.S. The interplay among miRNAs, major cytokines, and cancer-related inflammation. Mol. Ther. Nucleic Acids. 2020;20:606–620. doi: 10.1016/j.omtn.2020.04.002. [DOI] [PMC free article] [PubMed] [Google Scholar]
- 30.Yi M., Xu L., Jiao Y., Luo S., Li A., Wu K. The role of cancer-derived microRNAs in cancer immune escape. J. Hematol. Oncol. 2020;13:25. doi: 10.1186/s13045-020-00848-8. [DOI] [PMC free article] [PubMed] [Google Scholar]
- 31.Liu R., Lu Z., Gu J., Liu J., Huang E., Liu X., Wang L., Yang J., Deng Y., Qian J., et al. MicroRNAs 15A and 16–1 activate signaling pathways that mediate chemotaxis of immune regulatory B cells to colorectal tumors. Gastroenterology. 2018;154:637–651.e7. doi: 10.1053/j.gastro.2017.09.045. [DOI] [PubMed] [Google Scholar]
- 32.Xie J., Liu M., Li Y., Nie Y., Mi Q., Zhao S. Ovarian tumor-associated microRNA-20a decreases natural killer cell cytotoxicity by downregulating MICA/B expression. Cell. Mol. Immunol. 2014;11:495–502. doi: 10.1038/cmi.2014.30. [DOI] [PMC free article] [PubMed] [Google Scholar]
- 33.Xu S., Tao Z., Hai B., Liang H., Shi Y., Wang T., Song W., Chen Y., OuYang J., Chen J., et al. miR-424 (322) reverses chemoresistance via T-cell immune response activation by blocking the PD-L1 immune checkpoint. Nat. Commun. 2016;7:11406–11413. doi: 10.1038/ncomms11406. [DOI] [PMC free article] [PubMed] [Google Scholar]
- 34.Thorsson V., Gibbs D.L., Brown S.D., Wolf D., Bortone D.S., Ou Yang T.H., Porta-Pardo E., Gao G.F., Plaisier C.L., Eddy J.A., et al. The immune landscape of cancer. Immunity. 2018;48:812–830.e14. doi: 10.1016/j.immuni.2018.03.023. [DOI] [PMC free article] [PubMed] [Google Scholar]
- 35.Wu S.Y., Rupaimoole R., Shen F., Pradeep S., Pecot C.V., Ivan C., Nagaraja A.S., Gharpure K.M., Pham E., Hatakeyama H., et al. A miR-192-EGR1-HOXB9 regulatory network controls the angiogenic switch in cancer. Nat. Commun. 2016;7 doi: 10.1038/ncomms11169. [DOI] [PMC free article] [PubMed] [Google Scholar]
- 36.Krämer A., Green J., Pollard J., Jr., Tugendreich S. Causal analysis approaches in ingenuity pathway analysis. Bioinformatics. 2013;30:523–530. doi: 10.1093/bioinformatics/btt703. [DOI] [PMC free article] [PubMed] [Google Scholar]
- 37.Walton J., Blagih J., Ennis D., Leung E., Dowson S., Farquharson M., Tookman L.A., Orange C., Athineos D., Mason S., et al. CRISPR/Cas9-mediated Trp53 and Brca2 knockout to generate improved murine models of ovarian high-grade serous carcinoma. Cancer Res. 2016;76:6118–6129. doi: 10.1158/0008-5472.CAN-16-1272. [DOI] [PMC free article] [PubMed] [Google Scholar]
- 38.Wu S.Y., Putral L.N., Liang M., Chang H.I., Davies N.M., McMillan N.A.J. Development of a novel method for formulating stable siRNA-loaded lipid particles for in vivo use. Pharm. Res. 2009;26:512–522. doi: 10.1007/s11095-008-9766-1. [DOI] [PubMed] [Google Scholar]
- 39.Saba R., Sorensen D.L., Booth S.A. MicroRNA-146a: A dominant, negative regulator of the innate immune response. Front. Immunol. 2014;5:578. doi: 10.3389/fimmu.2014.00578. [DOI] [PMC free article] [PubMed] [Google Scholar]
- 40.Labbaye C., Testa U. The emerging role of MIR-146A in the control of hematopoiesis, immune function and cancer. J. Hematol. Oncol. 2012;5:13. doi: 10.1186/1756-8722-5-13. [DOI] [PMC free article] [PubMed] [Google Scholar]
- 41.Schmidt S.V., Nino-Castro A.C., Schultze J.L. Regulatory dendritic cells: There is more than just immune activation. Front. Immunol. 2012;3:274. doi: 10.3389/fimmu.2012.00274. [DOI] [PMC free article] [PubMed] [Google Scholar]
- 42.Axelsson S., Magnuson A., Lange A., Alshamari A., Hörnquist E.H., Hultgren O. A combination of the activation marker CD86 and the immune checkpoint marker B and T lymphocyte attenuator (BTLA) indicates a putative permissive activation state of B cell subtypes in healthy blood donors independent of age and sex. BMC Immunol. 2020;21:14–19. doi: 10.1186/s12865-020-00343-2. [DOI] [PMC free article] [PubMed] [Google Scholar]
- 43.Wang L.x., Zhang S.x., Wu H.j., Rong X.l., Guo J. M2b macrophage polarization and its roles in diseases. J. Leukoc. Biol. 2019;106:345–358. doi: 10.1002/JLB.3RU1018-378RR. [DOI] [PMC free article] [PubMed] [Google Scholar]
- 44.Chen D.S., Mellman I. Oncology meets immunology: The cancer-immunity cycle. Immunity. 2013;39:1–10. doi: 10.1016/j.immuni.2013.07.012. [DOI] [PubMed] [Google Scholar]
- 45.de Charette M., Marabelle A., Houot R. Turning tumour cells into antigen presenting cells: The next step to improve cancer immunotherapy? Eur. J. Cancer. 2016;68:134–147. doi: 10.1016/j.ejca.2016.09.010. [DOI] [PubMed] [Google Scholar]
- 46.Zhou Y., Zhou B., Pache L., Chang M., Khodabakhshi A.H., Tanaseichuk O., Benner C., Chanda S.K. Metascape provides a biologist-oriented resource for the analysis of systems-level datasets. Nat. Commun. 2019;10:1523. doi: 10.1038/s41467-019-09234-6. [DOI] [PMC free article] [PubMed] [Google Scholar]
- 47.Stocki P., Morris N.J., Preisinger C., Wang X.N., Kolch W., Multhoff G., Dickinson A.M. Identification of potential HLA class I and class II epitope precursors associated with heat shock protein 70 (HSPA) Cell Stress Chaperones. 2010;15:729–741. doi: 10.1007/s12192-010-0184-z. [DOI] [PMC free article] [PubMed] [Google Scholar]
- 48.Vugmeyster Y., Glas R., Pérarnau B., Lemonnier F.A., Eisen H., Ploegh H. Major histocompatibility complex (MHC) class I KbDb -/- deficient mice possess functional CD8+ T cells and natural killer cells. Proc. Natl. Acad. Sci. USA. 1998;95:12492–12497. doi: 10.1073/pnas.95.21.12492. [DOI] [PMC free article] [PubMed] [Google Scholar]
- 49.Oelkrug C., Ramage J.M. Enhancement of T cell recruitment and infiltration into tumours. Clin. Exp. Immunol. 2014;178:1–8. doi: 10.1111/cei.12382. [DOI] [PMC free article] [PubMed] [Google Scholar]
- 50.Mezzapelle R., Leo M., Caprioglio F., Colley L.S., Lamarca A., Sabatino L., Colantuoni V., Crippa M.P., Bianchi M.E. CXCR4/CXCL12 activities in the tumor microenvironment and implications for tumor immunotherapy. Cancers (Basel) 2022;14:2314. doi: 10.3390/cancers14092314. [DOI] [PMC free article] [PubMed] [Google Scholar]
- 51.Wang X., Qiu L., Li Z., Wang X.-Y., Yi H. Understanding the multifaceted role of neutrophils in cancer and autoimmune diseases. Front. Immunol. 2018;9:2456. doi: 10.3389/fimmu.2018.02456. [DOI] [PMC free article] [PubMed] [Google Scholar]
- 52.Wu M., Ma M., Tan Z., Zheng H., Liu X. Neutrophil: A new player in metastatic cancers. Front. Immunol. 2020;11 doi: 10.3389/fimmu.2020.565165. [DOI] [PMC free article] [PubMed] [Google Scholar]
- 53.Coffelt S.B., Wellenstein M.D., de Visser K.E. Neutrophils in cancer: Neutral no more. Nat. Rev. Cancer. 2016;16:431–446. doi: 10.1038/nrc.2016.52. [DOI] [PubMed] [Google Scholar]
- 54.Yang M., Zhang G., Wang Y., He M., Xu Q., Lu J., Liu H., Xu C. Tumour-associated neutrophils orchestrate intratumoural IL-8-driven immune evasion through Jagged2 activation in ovarian cancer. Br. J. Cancer. 2020;123:1404–1416. doi: 10.1038/s41416-020-1026-0. [DOI] [PMC free article] [PubMed] [Google Scholar]
- 55.Schimek V., Strasser K., Beer A., Göber S., Walterskirchen N., Brostjan C., Müller C., Bachleitner-Hofmann T., Bergmann M., Dolznig H., Oehler R. Tumour cell apoptosis modulates the colorectal cancer immune microenvironment via interleukin-8-dependent neutrophil recruitment. Cell Death Dis. 2022;13:113. doi: 10.1038/s41419-022-04585-3. [DOI] [PMC free article] [PubMed] [Google Scholar]
- 56.Masucci M.T., Minopoli M., Carriero M.V. Tumor associated neutrophils. Their role in tumorigenesis, metastasis, prognosis and therapy. Front. Oncol. 2019;9:1146. doi: 10.3389/fonc.2019.01146. [DOI] [PMC free article] [PubMed] [Google Scholar]
- 57.Kalafati L., Mitroulis I., Verginis P., Chavakis T., Kourtzelis I. Neutrophils as orchestrators in tumor development and metastasis formation. Front. Oncol. 2020;10 doi: 10.3389/fonc.2020.581457. [DOI] [PMC free article] [PubMed] [Google Scholar]
- 58.Germann M., Zangger N., Sauvain M.O., Sempoux C., Bowler A.D., Wirapati P., Kandalaft L.E., Delorenzi M., Tejpar S., Coukos G., Radtke F. Neutrophils suppress tumor-infiltrating T cells in colon cancer via matrix metalloproteinase-mediated activation of TGFβ. EMBO Mol. Med. 2020;12 doi: 10.15252/emmm.201910681. [DOI] [PMC free article] [PubMed] [Google Scholar]
- 59.Fridlender Z.G., Sun J., Kim S., Kapoor V., Cheng G., Ling L., Worthen G.S., Albelda S.M. Polarization of tumor-associated neutrophil phenotype by TGF-β:“N1” versus “N2” TAN. Cancer Cell. 2009;16:183–194. doi: 10.1016/j.ccr.2009.06.017. [DOI] [PMC free article] [PubMed] [Google Scholar]
- 60.Nielsen S.R., Strøbech J.E., Horton E.R., Jackstadt R., Laitala A., Bravo M.C., Maltese G., Jensen A.R.D., Reuten R., Rafaeva M., et al. Suppression of tumor-associated neutrophils by lorlatinib attenuates pancreatic cancer growth and improves treatment with immune checkpoint blockade. Nat. Commun. 2021;12:3414. doi: 10.1038/s41467-021-23731-7. [DOI] [PMC free article] [PubMed] [Google Scholar]
- 61.Chung J.Y.F., Tang P.C.T., Chan M.K.K., Xue V.W., Huang X.R., Ng C.S.H., Zhang D., Leung K.T., Wong C.K., Lee T.L., et al. Smad3 is essential for polarization of tumor-associated neutrophils in non-small cell lung carcinoma. Nat. Commun. 2023;14:1794. doi: 10.1038/s41467-023-37515-8. [DOI] [PMC free article] [PubMed] [Google Scholar]
- 62.Ohms M., Möller S., Laskay T. An attempt to polarize human neutrophils toward N1 and N2 phenotypes in vitro. Front. Immunol. 2020;11:532. doi: 10.3389/fimmu.2020.00532. [DOI] [PMC free article] [PubMed] [Google Scholar]
- 63.Capucetti A., Albano F., Bonecchi R. Multiple roles for chemokines in neutrophil biology. Front. Immunol. 2020;11:1259. doi: 10.3389/fimmu.2020.01259. [DOI] [PMC free article] [PubMed] [Google Scholar]
- 64.Sawant K.V., Poluri K.M., Dutta A.K., Sepuru K.M., Troshkina A., Garofalo R.P., Rajarathnam K. Chemokine CXCL1 mediated neutrophil recruitment: Role of glycosaminoglycan interactions. Sci. Rep. 2016;6 doi: 10.1038/srep33123. [DOI] [PMC free article] [PubMed] [Google Scholar]
- 65.Taniguchi K., Karin M. NF-κB, inflammation, immunity and cancer: coming of age. Nat. Rev. Immunol. 2018;18:309–324. doi: 10.1038/nri.2017.142. [DOI] [PubMed] [Google Scholar]
- 66.Boldin M.P., Taganov K.D., Rao D.S., Yang L., Zhao J.L., Kalwani M., Garcia-Flores Y., Luong M., Devrekanli A., Xu J., et al. miR-146a is a significant brake on autoimmunity, myeloproliferation, and cancer in mice. J. Exp. Med. 2011;208:1189–1201. doi: 10.1084/jem.20101823. [DOI] [PMC free article] [PubMed] [Google Scholar]
- 67.Iacona J.R., Lutz C.S. miR-146a-5p: Expression, regulation, and functions in cancer. Wiley Interdiscip. Rev. RNA. 2019;10:e1533. doi: 10.1002/wrna.1533. [DOI] [PubMed] [Google Scholar]
- 68.Rhyasen G.W., Starczynowski D.T. IRAK signalling in cancer. Br. J. Cancer. 2015;112:232–237. doi: 10.1038/bjc.2014.513. [DOI] [PMC free article] [PubMed] [Google Scholar]
- 69.Darvin P., Toor S.M., Sasidharan Nair V., Elkord E. Immune checkpoint inhibitors: recent progress and potential biomarkers. Exp. Mol. Med. 2018;50:1–11. doi: 10.1038/s12276-018-0191-1. [DOI] [PMC free article] [PubMed] [Google Scholar]
- 70.Chen G., Umelo I.A., Lv S., Teugels E., Fostier K., Kronenberger P., Dewaele A., Sadones J., Geers C., De Grève J. miR-146a inhibits cell growth, cell migration and induces apoptosis in non-small cell lung cancer cells. PLoS One. 2013;8 doi: 10.1371/journal.pone.0060317. [DOI] [PMC free article] [PubMed] [Google Scholar]
- 71.Su Y.-L., Wang X., Mann M., Adamus T.P., Wang D., Moreira D.F., Zhang Z., Ouyang C., He X., Zhang B., et al. Myeloid cell–targeted miR-146a mimic inhibits NF-κB–driven inflammation and leukemia progression in vivo. Blood. 2020;135:167–180. doi: 10.1182/blood.2019002045. [DOI] [PMC free article] [PubMed] [Google Scholar]
- 72.Cui Y., Kai’e She D.T., Tian D., Zhang P., Xin X. miR-146a inhibits proliferation and enhances chemosensitivity in epithelial ovarian cancer via reduction of SOD2. Oncol. Res. 2016;23:275–282. doi: 10.3727/096504016X14562725373798. [DOI] [PMC free article] [PubMed] [Google Scholar]
- 73.Qiu L., Wang J., Chen M., Chen F., Tu W. Exosomal microRNA-146a derived from mesenchymal stem cells increases the sensitivity of ovarian cancer cells to docetaxel and taxane via a LAMC2-mediated PI3K/Akt axis. Int. J. Mol. Med. 2020;46:609–620. doi: 10.3892/ijmm.2020.4634. [DOI] [PMC free article] [PubMed] [Google Scholar]
- 74.Li X., Jin Y., Mu Z., Chen W., Jiang S. MicroRNA-146a-5p enhances cisplatin-induced apoptosis in ovarian cancer cells by targeting multiple anti-apoptotic genes. Int. J. Oncol. 2017;51:327–335. doi: 10.3892/ijo.2017.4023. [DOI] [PubMed] [Google Scholar]
- 75.Wilczyński M., Żytko E., Szymańska B., Dzieniecka M., Nowak M., Danielska J., Stachowiak G., Wilczyński J.R. Expression of miR-146a in patients with ovarian cancer and its clinical significance. Oncol. Lett. 2017;14:3207–3214. doi: 10.3892/ol.2017.6477. [DOI] [PMC free article] [PubMed] [Google Scholar]
- 76.Huang S., He R., Rong M., Dang Y., Chen G. Synergistic effect of MiR-146a mimic and cetuximab on hepatocellular carcinoma cells. Biomed. Res. Int. 2014;2014 doi: 10.1155/2014/384121. [DOI] [PMC free article] [PubMed] [Google Scholar]
- 77.Liu R., Liu C., Chen D., Yang W.H., Liu X., Liu C.G., Dugas C.M., Tang F., Zheng P., Liu Y., Wang L. FOXP3 controls an miR-146/NF-κB negative feedback loop that inhibits apoptosis in breast cancer cells. Cancer Res. 2015;75:1703–1713. doi: 10.1158/0008-5472.CAN-14-2108. [DOI] [PMC free article] [PubMed] [Google Scholar]
- 78.Gao W., Hua J., Jia Z., Ding J., Han Z., Dong Y., Lin Q., Yao Y. Expression of miR-146a-5p in breast cancer and its role in proliferation of breast cancer cells. Oncol. Lett. 2018;15:9884–9888. doi: 10.3892/ol.2018.8589. [DOI] [PMC free article] [PubMed] [Google Scholar]
- 79.Xiao B., Zhu E.-D., Li N., Lu D.-S., Li W., Li B.-S., Zhao Y.-L., Mao X.-H., Guo G., Yu P.-W., Zou Q.M. Increased miR-146a in gastric cancer directly targets SMAD4 and is involved in modulating cell proliferation and apoptosis. Oncol. Rep. 2012;27:559–566. doi: 10.3892/or.2011.1514. [DOI] [PubMed] [Google Scholar]
- 80.Wang X., Tang S., Le S.-Y., Lu R., Rader J.S., Meyers C., Zheng Z.-M. Aberrant expression of oncogenic and tumor-suppressive microRNAs in cervical cancer is required for cancer cell growth. PLoS One. 2008;3 doi: 10.1371/journal.pone.0002557. [DOI] [PMC free article] [PubMed] [Google Scholar]
- 81.Rom S., Rom I., Passiatore G., Pacifici M., Radhakrishnan S., Del Valle L., Piña-Oviedo S., Khalili K., Eletto D., Peruzzi F. CCL8/MCP-2 is a target for mir-146a in HIV-1-infected human microglial cells. FASEB J. 2010;24:2292–2300. doi: 10.1096/fj.09-143503. [DOI] [PMC free article] [PubMed] [Google Scholar]
- 82.Curtale G., Citarella F., Carissimi C., Goldoni M., Carucci N., Fulci V., Franceschini D., Meloni F., Barnaba V., Macino G. An emerging player in the adaptive immune response: microRNA-146a is a modulator of IL-2 expression and activation-induced cell death in T lymphocytes. Blood. 2010;115:265–273. doi: 10.1182/blood-2009-06-225987. [DOI] [PubMed] [Google Scholar]
- 83.Squadrito M.L., Etzrodt M., De Palma M., Pittet M.J. MicroRNA-mediated control of macrophages and its implications for cancer. Trends Immunol. 2013;34:350–359. doi: 10.1016/j.it.2013.02.003. [DOI] [PMC free article] [PubMed] [Google Scholar]
- 84.Raskov H., Orhan A., Christensen J.P., Gögenur I. Cytotoxic CD8+ T cells in cancer and cancer immunotherapy. Br. J. Cancer. 2021;124:359–367. doi: 10.1038/s41416-020-01048-4. [DOI] [PMC free article] [PubMed] [Google Scholar]
- 85.Wang H., Li X., Li T., Wang L., Wu X., Liu J., Xu Y., Wei W. Multiple roles of microRNA-146a in immune responses and hepatocellular carcinoma. Oncol. Lett. 2019;18:5033–5042. doi: 10.3892/ol.2019.10862. [DOI] [PMC free article] [PubMed] [Google Scholar]
- 86.Yang L., Boldin M.P., Yu Y., Liu C.S., Ea C.-K., Ramakrishnan P., Taganov K.D., Zhao J.L., Baltimore D. miR-146a controls the resolution of T cell responses in mice. J. Exp. Med. 2012;209:1655–1670. doi: 10.1084/jem.20112218. [DOI] [PMC free article] [PubMed] [Google Scholar]
- 87.Marschner D., Falk M., Javorniczky N.R., Hanke-Müller K., Rawluk J., Schmitt-Graeff A., Simonetta F., Haring E., Dicks S., Ku M., et al. MicroRNA-146a regulates immune-related adverse events caused by immune checkpoint inhibitors. JCI Insight. 2020;5 doi: 10.1172/jci.insight.132334. [DOI] [PMC free article] [PubMed] [Google Scholar]
- 88.Ustyanovska Avtenyuk N., Visser N., Bremer E., Wiersma V.R. The neutrophil: The underdog that packs a punch in the fight against cancer. Int. J. Mol. Sci. 2020;21:7820. doi: 10.3390/ijms21217820. [DOI] [PMC free article] [PubMed] [Google Scholar]
- 89.Jeong J., Suh Y., Jung K. Context drives diversification of monocytes and neutrophils in orchestrating the tumor microenvironment. Front. Immunol. 2019;10:1817. doi: 10.3389/fimmu.2019.01817. [DOI] [PMC free article] [PubMed] [Google Scholar]
- 90.Murata K., Yoshitomi H., Furu M., Ishikawa M., Shibuya H., Ito H., Matsuda S. MicroRNA-451 down-regulates neutrophil chemotaxis via p38 MAPK. Arthritis Rheumatol. 2014;66:549–559. doi: 10.1002/art.38269. [DOI] [PubMed] [Google Scholar]
- 91.Águila S., de Los Reyes-García A.M., Fernández-Pérez M.P., Reguilón-Gallego L., Zapata-Martínez L., Ruiz-Lorente I., Vicente V., González-Conejero R., Martínez C. MicroRNAs as new regulators of neutrophil extracellular trap formation. Int. J. Mol. Sci. 2021;22:2116. doi: 10.3390/ijms22042116. [DOI] [PMC free article] [PubMed] [Google Scholar]
- 92.Zhou X., Li X., Wu M. miRNAs reshape immunity and inflammatory responses in bacterial infection. Signal Transduct. Target. Ther. 2018;3:14. doi: 10.1038/s41392-018-0006-9. [DOI] [PMC free article] [PubMed] [Google Scholar]
- 93.Amrouche L., Desbuissons G., Rabant M., Sauvaget V., Nguyen C., Benon A., Barre P., Rabaté C., Lebreton X., Gallazzini M., et al. MicroRNA-146a in human and experimental ischemic AKI: CXCL8-dependent mechanism of action. J. Am. Soc. Nephrol. 2017;28:479–493. doi: 10.1681/ASN.2016010045. [DOI] [PMC free article] [PubMed] [Google Scholar]
- 94.Laanesoo A., Urgard E., Periyasamy K., Laan M., Bochkov Y.A., Aab A., Magilnick N., Pooga M., Gern J.E., Johnston S.L., et al. Dual role of the miR-146 family in rhinovirus-induced airway inflammation and allergic asthma exacerbation. Clin. Transl. Med. 2021;11:e427. doi: 10.1002/ctm2.427. [DOI] [PMC free article] [PubMed] [Google Scholar]
- 95.Wong N.W., Chen Y., Chen S., Wang X. OncomiR: An online resource for exploring pan-cancer microRNA dysregulation. Bioinformatics. 2018;34:713–715. doi: 10.1093/bioinformatics/btx627. [DOI] [PMC free article] [PubMed] [Google Scholar]
- 96.Ahmed M., Nguyen H., Lai T., Kim D.R. miRCancerdb: A database for correlation analysis between microRNA and gene expression in cancer. BMC Res. Notes. 2018;11:103. doi: 10.1186/s13104-018-3160-9. [DOI] [PMC free article] [PubMed] [Google Scholar]
- 97.Sticht C., De La Torre C., Parveen A., Gretz N. miRWalk: An online resource for prediction of microRNA binding sites. PloS one. 2018;13 doi: 10.1371/journal.pone.0206239. [DOI] [PMC free article] [PubMed] [Google Scholar]
- 98.Lewis B.P., Burge C.B., Bartel D.P. Conserved seed pairing, often flanked by adenosines, indicates that thousands of human genes are MicroRNA targets. Cell. 2005;120:15–20. doi: 10.1016/j.cell.2004.12.035. [DOI] [PubMed] [Google Scholar]
- 99.Tokar T., Pastrello C., Rossos A.E.M., Abovsky M., Hauschild A.C., Tsay M., Lu R., Jurisica I. mirDIP 4.1-integrative database of human microRNA target predictions. Nucleic Acids Res. 2018;46:360–370. doi: 10.1093/nar/gkx1144. [DOI] [PMC free article] [PubMed] [Google Scholar]
Associated Data
This section collects any data citations, data availability statements, or supplementary materials included in this article.
Supplementary Materials
Data Availability Statement
The data that support the findings of this study are available from the corresponding author upon reasonable request.