

SUMMARY
CD8+ T cell exhaustion (TEX) impairs the ability of T cells to clear chronic infection or cancer. While TEX are hypofunctional, some TEX retain effector gene signatures, a feature associated with killer lectin-like receptor (KLR) expression. Although KLR+ TEX (TKLR) may improve control of chronic antigen, the signaling molecules regulating this population are poorly understood. Using single-cell RNA sequencing (scRNA-seq), flow cytometry, RNA velocity, and single-cell T cell receptor sequencing (scTCR-seq), we demonstrate that deleting the pseudokinase Trib1 shifts TEX toward CX3CR1+ intermediates with robust enrichment of TKLR via clonal T cell expansion. Adoptive transfer studies demonstrate this shift toward CD8+ TKLR in Trib1-deficient cells is CD8 intrinsic, while CD4-depletion studies demonstrate CD4+ T cells are required for improved viral control in Trib1 conditional knockout mice. Further, Trib1 loss augments anti-programmed death-ligand 1 (PD-L1) blockade to improve viral clearance. These data identify Trib1 as an important regulator of CD8+ TEX whose targeting enhances the TKLR effector state and improves checkpoint inhibitor therapy.
In brief
McClory et al. demonstrate that deletion of Trib1 in T cells promotes clonal expansion of exhausted CD8+ TINT and TKLR cells with an effector-like transcriptional program during chronic LCMV infection. Trib1 deletion improves viral control during PD-L1 blockade, suggesting that targeting Trib1 may improve outcomes during chronic infection and cancer.
Graphical Abstract:
INTRODUCTION
T cell exhaustion limits the immune system’s ability to eradicate chronic viral infections and cancer. When T cells are exposed to chronic antigen, they become exhausted (TEX), a state marked by increased expression of inhibitory receptors, decreased cytokine production, and poor expansion.1–3 However, TEX retain some effector function, and, in the best-case scenario, T cell exhaustion serves to limit immune pathology. However, exhaustion can be problematic in the setting of cancer or chronic infection because antigen is never cleared and disease progresses.1–3 Thus, there is strong interest in developing therapies that target TEX to overcome the dampened immune response in chronic disease.
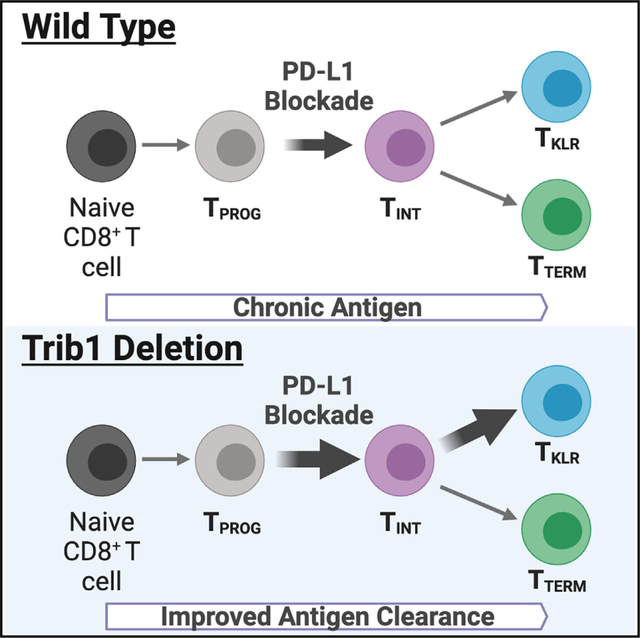
In CD8+ T cells, exhaustion occurs through a stepwise process whereby a naive T cell encounters chronic antigen and differentiates into an exhausted precursor4 and then progenitor (TPROG), which ultimately produces terminally exhausted T cells (TTERM). Progenitor cells express high levels of Ly108 and TCF1,2,4–6 can self-renew, and proliferate in response to programmed cell death protein 1 (PD-1) blockade.7–11 TPROG give rise to transitional or intermediate cells (TINT) that express CX3CR1 and accumulate following PD-1 inhibition. TINT retain some function and are important for viral and tumor control.4,6,10,12,13 TINT further differentiate into TTERM, expressing high levels of inhibitory receptors including PD-1, Tim3, TIGIT, and LAG3, as well as CD69, CD39, and CD101. TTERM do not expand, have decreased function, and are relatively short lived.2,3,6,10,13 In addition to TTERM, recent evidence supports that TINT can also differentiate into a TKLR population.4,14,15 TKLR are effector-like cells that express high levels of KLRG1 in addition to other killer lectin-like receptors (KLRs), such as NKG2D (encoded by Klrk1), NKG2A (encoded by Klrc1), CD94 (encoded by Klrd1), NK1.1 (encoded by Klrb1c), and other proteins expressed by both effector T cells and natural killer (NK) cells, including granzymes; the transcription factors (TF) ZEB2, T-BET (encoded by Tbx21), and ID2; and low CXCR6 expression.4,14–16 TKLR also express CX3CR1, indicating that there is a more narrow definition for the TINT population that is CX3CR1+ but lacks the full complement of KLR gene expression.4,14 Previous studies demonstrating the importance of CX3CR1+ cells in controlling viral load included both TINT and TKLR subsets.10,13 Although both TINT and TKLR populations express PD-1 and TOX (a TF important for establishing the TEX state17–22), TKLR express lower levels of these classic exhaustion features and have a transcriptional profile more similar to effector T cells from acute viral infections than do TINT.4,14,15 Findings that TINT can differentiate into either TKLR or TTERM cells suggest TKLR may be an alternative to terminally exhausted cells, and expanding this population may improve outcomes during chronic antigen exposure. Indeed, effector-like CD8+ T cells expressing KLRs have been described in chronic infection, cancer, and autoimmunity in both mice and humans.23–26 These studies suggest that they have cytotoxic potential and may function in self-recognition of stressed, infected, transformed, or hyperactive immune cells. This raises the question of whether the fate of CD8+ T cells during chronic antigen exposure can be shifted away from a TTERM fate and toward a more effector-like TKLR to improve anti-viral or anti-tumor immunity.
We previously identified the pseudokinase Tribbles 1 (Trib1) as a regulator of T cell effector function and activation during chronic infection.16,27 Tribs have a central pseudokinase domain important for protein interactions and a C-terminal domain that interacts with the E3 ligase COP1, which is critical for regulating Trib-mediated protein degradation. Important targets of Trib1-mediated protein degradation in mammalian cells are C/EBP family members.28,29 We identified a MALT1 binding site in the N terminus of Trib1 that appears to be specific to Trib1 among Trib proteins.16,30 The TRIB1:MALT1 interaction prevents MALT1 from forming the CARMA1/BCL10/MALT1 (CBM) complex, which is important for transducing T cell receptor (TCR) signals.16 Using CD4-Cre+Trib1F/F mice (Trib1 knockout [KO]) and CD4-Cre+Trib1+/+ mice (wild type [WT]), we demonstrated that Trib1 KO mice infected with a chronic strain of LCMV (clone 13) had more KLRG1+CD8+ effector-like cells, their CD8+ and CD4+ T cells were more robust cytokine producers, and Trib1 KO mice had lower viral titers compared to WT mice.16 Recently, TRIB1 was found to be highly expressed in TEX of healthy human peripheral blood and the locus has multiple accessible chromatin regions in exhausted human tumor infiltrating lymphocytes (TILs),31 suggesting that Trib1 not only regulates T cell exhaustion in mouse infection but is a relevant gene in human T cell exhaustion as well. Thus, we sought to better understand how the pathway of T cell exhaustion can be shifted toward a more functional CD8+ T cell fate by Trib1 and to better understand if targeting Trib1 could improve immunotherapy for cancer or infectious disease. Here, we demonstrate that Trib1 deletion from T cells during chronic infection increases expression of KLR and KLR-associated genes and promotes clonal expansion of TINT and TKLR subsets in CD8+ TEX. Additionally, we found that although anti-programmed death-ligand 1 (PD-L1) checkpoint blockade expanded the TINT population, it did not redirect cells to the TKLR fate in either WT or Trib1 KO mice. However, the combination of anti-PD-L1 immunotherapy and Trib1 deletion provided the greatest viral control compared to either PD-L1 blockade or Trib1 deletion alone and was associated with sustained Trib1 KO-driven accumulation of more effector-like CD8+ T cells.
RESULTS
Trib1 restrains KLR gene expression throughout the T cell exhaustion pathway
Previous single-cell RNA sequencing (scRNA-seq) of CD44+ TCRβ+ splenocytes from WT and Trib1 KO mice infected with LCMV clone 13 for 15 days revealed that a CD8+ KLRG1+ population was preferentially enriched in Trib1 KO cells compared to WT CD8+ T cells and that this population had a transcriptional profile similar to effector CD8+ T cells from acute LCMV infection.16 To gain more granularity within the CD8+ T cell population, we reanalyzed this dataset excluding cells expressing Cd4 mRNA. The remaining Cd4-low cells expressed high Cd8 mRNA with no Cd4 mRNA, whereas the excluded cells expressed high Cd4 and low Cd8 mRNA, demonstrating effective isolation of CD8+ T cells from these data (Figure S1A). We used TooManyCells32 to generate a CD8+-specific dendrogram with nine clusters (Figure 1A) with uniform Cd3e, Cd8a, and Cd8b mRNA (Figure S1B). We used differential gene expression to annotate the tree (Figures 1A–1C, S1B, and S1C). Cluster 1 expressed the highest levels of Klrg1 and Cx3cr1 relative to other branches (Figures 1B and S1C) and had the highest expression of multiple additional KLRs, such as Klrb1c, Klrc1, Klrd1, Klre1, and Klrk1. The high expression of multiple KLRs suggested that this population represented a recently described effector-like subset during chronic infection we refer to as the TKLR subset.4,14,15 Cluster 1 also expressed transcripts characteristic of effector cells such as granzymes and S1pr5, which regulates effector cell migration, and the TFs Id2 and Zeb2, the latter of which is critical for the persistence of this effector-like population15 (Figure 1B). Gzmb transcripts were widely expressed in clusters 1–4; however, Gzma was most highly expressed within cluster 1 (Figure 1B) and was among the highest differentially expressed genes in this cluster (Figure S1C), suggesting cluster 1 may contain additional cytotoxic functional attributes relative to the other populations. Clusters 2 and 3 expressed Cx3cr1, known to be expressed on both TINT and TKLR,4,14,15 and Cxcr6, which is expressed on TINT but not TKLR,15 indicating this cluster represents the TINT population (Figures 1B and S1C). Clusters 2 and 3 also expressed higher levels of inhibitory receptor genes, including Havcr2 (encoding Tim3) and Pdcd1 (encoding PD-1), compared to cluster 1 and lower levels of KLRs. The primary difference between clusters 2 and 3 was higher expression of proliferation genes in cluster 3 (Figure S1D). When proliferation genes were regressed and cell identities projected onto the other clusters, cluster 3 cells most closely resembled cluster 2, confirming they were proliferating CX3CR1+ TINT (Figure S1E). Cluster 4 expressed high levels of terminal exhaustion genes (Tox, Pdcd1, Lag3, Tigit) and low levels of KLRs, consistent with a TTERM phenotype (Figures 1B and S1C). Clusters 6 and 7 expressed Tcf7 and Slamf6 but low levels of Tox, Pdcd1, Lag3, and Tigit, consistent with early TPROG. Cluster 8 expressed Tcf7 and Slamf6 but also higher levels of Tox, Pdcd1, Lag3, and Tigit, also consistent with TPROG cells (Figures 1B and S1C). Cluster 5 comprised only 138 cells (out of 5,113 total) and had features that overlapped with progenitors (expression of Slamf6 and Tcf7) but also had features shared with multiple populations (Figures 1B and S1C). Cluster 9 had a high proliferative gene signature, and, when proliferation genes were removed from the analysis, the cluster 9 signature most closely resembled clusters 7, 8, and 3, suggesting these proliferative cells largely were composed of cells transitioning from a TPROG to a TINT identity (Figure S1F). Of note, gene set enrichment analysis (GSEA) comparing our data to the LCMV-specific populations identified by Giles et al.4 at day 15 of clone 13 infection revealed strikingly similar patterns (Figure S1G). Together, these data reinforce the identify of known TEX subsets TPROG, TINT, and TTERM and highlight the presence of an effector-like TKLR subset characterized by high expression of effector-associated and KLR genes, including Klrg1, Klre1, the transcription factor Zeb2, and the effector molecule Gzma (Figure 1C).
Figure 1. Trib1 deletion during chronic LCMV infection is characterized by enrichment of KLR-associated genes within the T cell exhaustion pathway.

(A) Visualization of single-cell clustering of CD8+ cells using TooManyCells.32 Cells begin at the central node and are recursively divided based on transcriptional differences. Branch width corresponds to cell number. Red and blue represent the proportion of WT or Trib1 KO, respectively, in each branch. Each terminal branch ends with a node whose size represents the number of cells present.
(B) Normalized gene expression on the CD8+ tree. Red, higher expression; white, lower expression. Scale bars indicate upper-quartile normalized counts.
(C) Cluster annotation as determined by gene expression profiles in (B) and Figure S1C.
(D) Top DEGs in CD8+ cells of WT and Trib1 KO cells. Genes associated with an effector-like phenotype are blue and genes associated with exhaustion are red.
(E) Top 40 DEGs between WT and Trib1 KO CD8+ cells in clusters 1–4 and as progenitor cells (clusters 5–9). Genes up in Trib1 KO (blue bars) and genes up in WT (red bar). Effector-like genes highlighted in blue. Exhaustion genes highlighted in red.
(F) Enumeration of DEGs by subset. The shade of each bar indicates the log2(fold change [FC]) cutoff for each DEG group.
(G) Proportion of WT and Trib1 KO cells in TEX populations, as defined by the scRNA-seq. TPROG cell frequency was calculated by combining cell numbers from clusters 5–8.
(H) Fisher’s exact test demonstrating differential representation of WT and Trib1 KO cells in TPROG, TKLR, TING, TING Prolif, and TTERM subsets.
Using this CD8+ tree, we identified differentially expressed genes (DEGs) between WT and Trib1 KO cells (Figure 1D; Table S1). Genes upregulated in WT CD8+ T cells compared to Trib1 KO included hallmark genes associated with CD8+ TEX such as Cd7 and the inhibitory receptors Pdcd1 and Lag3 as well as TFs Id3, Eomes, and Tox. In contrast, genes most upregulated in Trib1 KO were associated with effector responses as seen in acute infections, including multiple KLRs such as Klrg1, Klrk1 (encoding NKG2D), Klrc1 (encoding NKG2A), Klrd1 (encoding CD94), Klrb1c (encoding NK1.1), Klre1 (encoding NKG2I), and KLR-associated genes such as Hcst (encoding DAP10, a signaling adaptor for NKG2D). They also expressed higher levels of Gzma and Cx3xr1 than WT cells (Figure 1D), suggesting that absence of Trib1 biased CD8+ T cells toward an effector phenotype. Enrichment of TFs Id2 and Klf2 was also consistent with a more effector-like population.4,10,33,34 Furthermore, when Trib1 KO cells were compared to WT cells within each cluster, a similar pattern of differential gene expression was evident throughout TEX differentiation. Trib1 KO cells had fewer TEX-associated genes and higher effector and KLR gene expression in all subsets (Figure 1E), although the pattern of which KLR was expressed at each stage was heterogeneous (Figure 1B). These data suggest Trib1 regulates effector gene expression throughout TEX differentiation during chronic infection; however, when total DEGs between WT and Trib1 KO were compared within individual subsets, the highest number of DEGs was found within the TKLR subset (Figure 1F). Together, these data demonstrate that Trib1 KO is associated with broad transcriptional changes across TEX subsets. This shift toward a more effector-like gene expression program begins as early as the TPROG but culminates with the most substantial changes in both DEG number and effector-like profile within the TKLR subset. Additionally, these data identify cluster 1 as a distinct CX3CR1+ population that expresses low levels of TEX-associated genes, high levels of KLRs, as well as a strong effector-like gene signature. This gene expression profile is highly affected by the loss of Trib1.
We next looked at the distribution of WT and Trib1 KO cells in each CD8+ TEX subset. The overall contribution of WT and Trib1 KO cells to the analysis was similar (52% and 48%, respectively) (Figure 1G). TPROG (clusters 5–8) were enriched for WT cells (67%) compared to Trib1 KO cells (33%), whereas TINT (clusters 2 and 3) were relatively evenly distributed between the two genotypes. In contrast, TTERM (cluster 4) was strongly enriched for WT cells (78%) compared to Trib1 KO cells (22%), and, conversely, the TKLR subset (cluster 1) was enriched for Trib1 KO cells, which accounted for 78% of this cluster compared to 22% contributed by WT cells (Figures 1G and 1H). These data indicate that deleting Trib1 pushes TPROG toward TINT and shifts TEX away from TTERM and toward TKLR. The preponderance of Trib1 KO cells in cluster 1 aligns with the gene expression data showing this cluster is most highly affected by the loss of Trib1.
Trib1-deficient CD8+ T cells are enriched for CX3CR1+ cells due to expanded CX3CR1+KLRG1+ TKLR cells
To determine if the effects of Trib1 deletion on TEX were observed at the cellular level, WT and Trib1 KO mice were infected with LCMV clone 13 for 27–30 days (Figure 2A), and splenocytes were analyzed for LCMV-specific CD8+ cells using a Gp33 tetramer. Using CX3CR1 and Ly108 expression to identify CD8+ TINT and TPROG cells, respectively,4,10,13–15 we found that Gp33+CD8+CX3CR1+ cells were expanded in Trib1 KO compared to WT mice, accompanied by a relative decrease in Gp33+CD8+Ly108+ TPROG cell frequency (Figures 2B, S2A, and S2B). We next examined the cell surface protein expression of KLRG1, as it is one of the most strongly enriched KLRs within cluster 1 in the scRNA-seq data and also a KLR used to define the TKLR subset in prior reports.14 Indeed, total CX3CR1+ cells can be divided based on KLRG1 protein expression similarly to the scRNA-seq data shown in Figure 1: CX3CR1+KLRG1− cells were consistent with clusters 2 and 3 TINT cells that expressed high levels of Cx3cr1 but low levels of Klrg1; CX3CR1+KLRG1+ cells corresponded to the cluster 1 TKLR subset (Figures 2C, S2C, and S2D).Loss of Trib1 resulted in both a relative and absolute increase in LCMV-specific CX3CR1+KLRG1+ TKLR cells, compared to WT mice (Figures 2C and S2D), consistent with the findings in the scRNA-seq (Figure 1G). At this time point, Trib1 KO mice had more Gp33+ TINT cells, defined by CX3CR1+KLRG1− expression (although the magnitude of increase did not always reach statistical significance) (Figures 2C and S2C). This shift toward expansion of both CX3CR1+ populations was accompanied by a proportional decrease in CD101+ TTERM in Trib1 KO mice compared to WT (Figures 2D and S2E). These data confirmed the scRNA-seq data at the protein level, suggesting that Trib1 regulates the terminal state of CD8+ T cell exhaustion by restraining differentiation into TKLR. The cellular impact of deleting Trib1 emerged in the TINT subset and culminated with robust skewing toward a more effector-like TKLR phenotype, revealing that loss of Trib1 enhanced both the TINT and TKLR pools, consistent with prior reports demonstrating that the presence of viral-specific total CX3CR1+ CD8+ T cells is associated with improved viral control.10,13
Figure 2. Trib1 deletion drives CD8+ T cells toward a KLR+ effector-like fate during chronic infection.

(A) Schematic for LCMV clone 13 infection.
(B) Ly108+ TPROG and total CX3CR1+ cells in WT or Trib1 KO mice.
(C) CX3CR1+KLRG1− TINT or CX3CR1+KLRG1+ TKLR in WT or Trib1 KO mice. Spleen, day 27 p.i.
(D) CD101+ TTERM at day 27 in the spleen. Events in (B)–(D) are gated on CD8+CD44+Gp33-Tetramer+ cells.
(E) KLRG1, CD94, and NKG2A expression on CD8+CD44+Gp33-Tetramer+CX3CR1+ cells. Spleen, day 30 p.i.
(F) P14 co-transfer schematic.
(G) WT P14 cells (CD45.1/2+) or Trib1 KO P14 cells (CD45.1+) that are either CX3CR1+KLRG1− TINT or CX3CR1+KLRG1+ TKLR at day 29 in the spleen.
(H) Experimental design for CD4 depletion with GK1.5.
(I) Day 30 serum viral titers from WT or Trib1 KO mice treated with either GK1.5 or PBS.
(J and K) Representative flow plots (J) and compiled data (K) showing frequency of CD8+CD44+Gp33-Tetramer+ cells that are CX3CR1+KLRG1− TINT or CX3CR1+KLRG1+ TKLR with or without GK1.5 treatment in WT and Trib1 KO mice.
(L) Cell number per million splenocytes of CD8+CD44+Gp33-Tetramer+ cells that are CX3CR1+KLRG1− TINT or CX3CR1+KLRG1+ TKLR with or without GK1.5 treatment in WT and Trib1 KO mice. Data in (B)–(D) are representative of seven or eight experiments each with five to eight mice per genotype. Data in (E) are representative of two experiments each with five to seven mice per genotype. Data in (G) are representative of two experiments with 8–10 recipient mice per experiment. Data in (I), (K), and (L) are combined data from two independent experiments. Purple dots represent mice from the first experiment and black represent mice from the second. Error bars are mean ± SEM.
To determine how expression of other KLR proteins intersects with KLRG1 expression during LCMV clone 13 infection, day 30 post infection (p.i.) Gp33+CD8+ T cells were stained for CD94 and NKG2A (encoded by Klrd1 and Klrc1, respectively). Within the total CX3CR1+ subset in both WT and Trib1 KO mice, the majority of KLRG1-expressing cells also co-expressed CD94 and NKG2A (Figure 2E). Consistent with the scRNA-seq data in Figure 1A, a higher proportion of Trib1 KO cells co-expressed KLRG1 and CD94/NKG2A than WT cells. The CX3CR1+ population also contained a KLRG1−CD94+/NKG2A+ subset, further indicating that KLR expression was heterogeneous among the expression of individual receptors (Figure 2E), as seen in the scRNA-seq data (Figure 1). Using Ly108+CX3CR1− to define TPROG cells, CX3CR1−CD101+ to define TTERM, and KLRG1 to more narrowly define and distinguish TINT (CX3CR1+KLRG1−) and TKLR (CX3CR1+KLRG1+), we tracked CD94 and NKG2A across subsets (Figure S2F). In both WT and Trib1 KO cells, only a small proportion of Ly108+CX3CR1− TPROG expressed CD94 and NKG2A. Their co-expression significantly increased at the CX3CR1+KLRG1− TINT stage, and even further at the CX3CR1+KLRG1+ TKLR stage. These data were consistent with the pattern of Klrd1 (CD94) and Klrc1 (NKG2A) mRNA expression in Figure 1B, but, unlike the scRNA-seq data, there was no difference in protein expression of CD94 and NKG2A in WT versus Trib1 KO within the individual subsets (Figure S2F). As expected, these receptors were minimally expressed in the TTERM population (Figure S2F). Taken together, these data suggest that KLRG1 could be used to distinguish TINT and TKLR.
To determine if the skewing of CD8+ T cell fate toward the TKLR subset in Trib1 KO mice was CD8 intrinsic, we co-transferred WT and Trib1 KO LCMV-specific TCR transgenic T cells (P14 cells) into congenically distinct recipient mice that were subsequently infected with LCMV clone 13 (Figures 2F and 2G). This approach was important because loss of Trib1 in CD4+ T cells increases their proliferation and cytokine production,16 which could affect CD8+ T cell exhaustion through CD8+-extrinsic mechanisms. Analysis of donor P14+ cells 29–30 days p.i. revealed a significant skewing of Trib1 KO P14 cells to CX3CR1+KLRG1+ TKLR compared to WT P14 cells, indicating an intrinsic role for Trib1 in regulating the TKLR state (Figure 2G). This skewing was less robust but still significant when comparing absolute numbers (Figure S2G) due to differences in overall recovery of WT versus Trib1 KO P14 cells (Figure S2H).
CD4+ T cells help control LCMV clone 13 infection and support CD8+ T cell survival and function during chronic infection.13,35–37 To determine if loss of CD4+ T cells affects the CD8+ T cell-specific effect of Trib1 deletion during chronic infection, we depleted CD4+ T cells prior to infection (Figures 2H–2L). Consistent with previous findings, the serum viral load was lower in untreated Trib1 KO mice compared to untreated WT mice. However, viral load did not differ between Trib1 KO and WT mice treated with the CD4+ T cell-depleting antibody, GK1.5 (Figure 2I), indicating that CD4+ T cells are required for the effect of Trib1 deletion on viral control. Furthermore, after GK1.5 treatment, the number of both TINT and TKLR cells per million splenocytes was low in both WT and Trib1 KO mice (Figures 2J–2L), suggesting that CD4+ T cells are required to maintain these populations. These data are consistent with previous reports demonstrating that CD4+ T cells are required to maintain viral-specific CX3CR1+CD8+ T cells,13 and that loss of this population was associated with impaired viral control.10,13 Overall, these data suggest that Trib1 deletion from CD8+ T cells intrinsically promotes a TKLR fate and that CD4+ T cells are required to maintain this expanded population in Trib1 KO mice.
Trib1 deletion shifts the pathway of T cell exhaustion toward a TKLR fate
We next used RNA velocity to predict the directional flow of differentiation states within the CD8+ cells shown in Figure 1. RNA velocity predicts the future fates of individual cells based on RNA content and splicing states.38–40 Cluster 9 was omitted from the analysis given its high proliferative gene signature and that its DEG profile overlaps significantly with other cell types when proliferative genes are removed (Figure S1D). RNA velocity was calculated using Velocyto39 and, after visualization of CD8+ cells from either WT or Trib1 KO mice by uniform manifold approximation and projection (UMAP), RNA velocity was embedded onto both UMAPs by Cellrank40 and scVelo39 (Figures 3A–3C). Pruned partition-based graph abstraction (PAGA) was used to show the predicted connectivity and directional flow of clusters 1–8 (Figures 3D and 3E). Using these visualizations, both WT and Trib1 KO CD8+ T cells had cell states that begin with clusters 6 and/or 7 TPROG and progressed toward cluster 8 and to a smaller extent cluster 5, in keeping with clusters 6 and 7 being earlier TPROG. In both WT and Trib1 KO, TPROG (clusters 5–8) progressed toward clusters 2 and 3 (TINT). WT cells then bifurcated toward either cluster 4 (TTERM) or cluster 1 (TKLR). While Trib1 KO CD8+ cells also differentiated into TKLR or TTERM, the propensity to differentiate into TKLR was much stronger, as shown by the directional flow predicted by RNA velocity as well as the visible frequency of TKLR in the Trib1 KO UMAP (Figures 3D and 3E). These data demonstrate that T cell-specific Trib1 deletion does not alter the path of T cell exhaustion; rather, the absence of Trib1 promotes the trajectory of TINT cells toward the TKLR cell state. These data support a model of CD8+ T cell exhaustion that begins with differentiation into TPROG and then into TINT, which can further differentiate into either TKLR or TTERM, and that this branchpoint is regulated by Trib1 (Figures 3F and 3G).
Figure 3. Trib1 KO shifts the pathway of T cell exhaustion toward a KLR+ fate as demonstrated by RNA velocity.

(A) Cell clusters identified in Figure 1.
(B and C) WT (B) and Trib1 KO (C) RNA velocity as projected on UMAP using the scRNA-seq data in Figure 1. Color of circles indicates the cluster identity. Arrows depict the directional flow of cell identities based on RNA velocity as calculated by Velocyto and projected by CellRank and scvelo.
(D and E) WT (D) and Trib1 KO (E) PAGA showing predicted connectivity of clusters 1–8.
(F and G) Proposed model of T cell exhaustion in the WT (F) and Trib1 KO (G) setting.
TKLR accumulation in Trib1 KO mice is accompanied by clonal expansion during chronic infection
Recent reports and our RNA velocity data suggest TTERM and TKLR are terminal differentiation states that develop from a common CX3CR1+ TINT population during chronic infection4,14,15 and that TCR clonal behaviors can trace the differentiation of single exhausted T cells into either of these two states.14,15 To investigate the clonal behavior of Trib1 KO CD8+ T cells during chronic infection, we performed paired scTCR-seq with scRNA-seq of CD8+CD44+ T cells from WT and Trib1 KO mice 15 days after LCMV clone 13 infection. We identified 2,904 TCR sequences (clonotypes) in WT CD8+ T cells and 1,858 clonotypes in Trib1 KO CD8+ T cells. Of these, the majority were unexpanded single-cell clones (91% in WT, 81% in Trib1 KO), reflecting a polyclonal CD8+ T cell pool. However, both WT and Trib1 KO mice had a small proportion of TCR clonotypes with more than two cells per sequence. Expanded WT clonotypes ranged from two to 32 cells and Trib1 KO ranged from two to 138 cells (Figure 4A). The majority of the 20 most-expanded WT clonotypes fell into several subsets, including TPROG, TINT, TTERM, and TKLR (Figure 4B). In contrast, the top 20 Trib1 KO clonotypes were more selectively enriched in the TKLR and TINT subsets. This suggested that Trib1 regulates the clonal expansion of these two populations starting at the TINT state given that the expanded clonotypes are first detected in abundance in the TINT and then shared with the TKLR (Figure 4B). Clonotype behaviors can be described based on the cell subset distribution within a specific clonotype. Thus, we asked if Trib1 deletion shifted the pathway of TEX by impacting the clonal expansion of two alternative fates: TKLR or TTERM. Using a four-cell cutoff for significantly expanded clones, clonotype behaviors can be divided into four general categories: divergent clonotypes contain both terminal subsets (TKLR and TTERM), TKLR-biased clonotypes contain TKLR but not TTERM, TTERM-biased clonotypes contain TTERM but not TKLR, and TINT clonotypes contain neither TKLR nor TTERM (Figure 4C). No significantly expanded clonotypes contained only TPROG cells. Notably, Trib1 KO cells had an over-representation of TKLR-biased clonotype behaviors, whereas WT cells had more TTERM-biased behaviors (Figure 4C). Furthermore, Trib1 KO cells had a robust expansion of TKLR-biased clonotypes that contained only TKLR and TINT cells (Figure 4C). Together, these data indicate that, in the absence of Trib1, there is clonal expansion of T cells shared between the TINT and TKLR subsets, suggesting that Trib1 specifically regulates the accumulation of these two subsets.
Figure 4. Trib1 KO drives clonal expansion of KLR+ T cells.

(A) Total clonotypes from WT and Trib1 KO cells containing one cell, 2–10 cells, 11–30 cells, or >30 cells.
(B) Top 20 TCR clonotypes in WT and Trib1 KO cells. Colors indicate presence of that clonotype in the corresponding cell cluster.
(C) Upset plots depicting clonotype behavior of WT (red) or Trib1 KO (blue) cells. Set size bar plots indicate the total number of cells in each cluster in all significantly expanded clones.
(D) Frequency of clonotypes that are TKLR biased (blue), TTERM biased (green), or divergent (purple).
Analyzing the breakdown of the three alternative fates (TKLR biased, TTERM biased, or divergent) we found that WT mice contained a relatively equal percentage of TKLR-biased (39.47%) and TTERM-biased (42.11%) clonotypes and a slightly smaller percentage of divergent clonotypes (18.42%) (Figure 4D). In contrast, Trib1 KO cells contained a much larger proportion of TKLR-biased clonotypes (86.43%) than either of the other two terminal fate behaviors (TTERM biased, 9.29%; divergent, 4.29%) (Figure 4D). Taken together, these data show that Trib1 deletion from the T cell compartment shifts differentiation toward a TKLR fate and that this skewing is accompanied by the clonal expansion of TINT and TKLR subsets.
Trib1 deletion augments PD-L1 blockade
Efficacy of PD-L1 blockade depends on anti-PD-L1-mediated expansion of TPROG cells that differentiate into re-invigorated CX3CR1+ cells. This population subsequently expands and contributes to improved antigen control in chronic infections or cancer.7–9,13 Loss of Trib1 is sufficient to decrease viral load during chronic viral infection.16 Given the impact of Trib1 deletion on increasing effector-like differentiation and enhancing the TINT pool, we hypothesized that disrupting Trib1 expression could further improve the efficacy of PD-L1 blockade. To test this, WT and Trib1 KO mice infected with clone 13 were treated with anti-PD-L1 antibody or PBS (Figure 5A). As expected, Trib1 KO mice had lower viral titers than WT at day 29 p.i. (Figure 5B). Importantly, the combination of Trib1 KO and PD-L1 blockade resulted in the lowest viral titers. Viral loads in Trib1 KO mice treated with anti-PD-L1 were significantly lower than Trib1 KO mice treated with PBS as well as WT mice treated with PD-L1 blockade (Figure 5B). When compared to WT untreated mice, anti-PD-L1 treatment in WT decreased viral load 7.0-fold, whereas the combination of anti-PD-L1 treatment and Trib1 KO decreased the viral load 17.5-fold (Table S2). These data demonstrate that deleting Trib1 from T cells augments immune checkpoint blockade to improve viral clearance.
Figure 5. Trib1 deletion augments PD-L1 blockade to reduce viral titers in chronic LCMV infection.

(A) Experimental design.
(B) Serum viral titers from WT or Trib1 KO mice treated with PBS or anti-PD-L1.
(C) CD8+CD44+Gp33-Tetramer+ cells that are either CX3CR1+KLRG1− TINT or CX3CR1+KLRG1+ TKLR.
(D and E) Frequency (D) and number per million splenocytes (E) of TINT.
(F and G) Frequency (F) and number per million splenocytes (G) of TKLR.
(H) CD107a expression on CX3CR1+KLRG1+ TKLR cells after a Gp33-peptide stimulation. Data in (B) and (D)–(H) are combined from two experiments. Purple dots are mice from the first experiment, and black are mice from second. Error bars are mean ± SEM.
To investigate how Trib1 deletion affects TEX during PD-1 pathway inhibition, TINT and TKLR subsets were assessed (Figure 5C). Consistent with the known biology of PD-1 pathway blockade, anti-PD-L1 treatment increased the frequency and number of CX3CR1+KLRG1− TINT cells per million splenocytes (~2.5-fold) in WT mice (Figures 5D and 5E). While combining Trib1 deletion with anti-PD-L1 had a modest effect on the frequency of the TINT subset, the combination significantly increased the number of TINT per million splenocytes compared to anti-PD-L1 treatment of WT mice (Figures 5D and 5E). Notably, anti-PD-L1 treatment alone did not increase the frequency or number per million splenocytes of CX3CR1+KLRG1+ TKLR in WT mice (Figures 5F and 5G). In contrast, Trib1 KO mice treated with anti-PD-L1 maintained a high frequency of TKLR cells; moreover, the number of TKLR per million splenocytes was increased compared to WT mice treated with anti-PD-L1 therapy roughly 3.1-fold (Figures 5F and 5G). PD-L1 pathway blockade enhances CD8+ TEX function41; accordingly, WT mice treated with anti-PD-L1 showed an increased frequency of cells expressing CD107a, a cytotoxic degranulation marker, within the TKLR subset compared to WT mice treated with PBS (Figure 5H). Trib1 KO TKLR cells had higher CD107a expression at baseline in PBS-treated mice compared to WT controls and remained amenable to enhanced function following PD-L1 pathway blockade as CD107a expression was further increased following treatment (Figure 5H). CD107a expression in TKLR of Trib1 KO mice treated with anti-PD-L1 was also higher than WT mice treated with anti-PD-L1 (Figure 5H), indicating that the elevated number of TKLR in Trib1 KO mice were indeed highly functional. Thus, combining Trib1 deletion and anti-PD-L1 therapy maximizes the expansion and function of effector-like TINT and TKLR cells compared to either treatment alone and results in the greatest degree of viral control.
DISCUSSION
We demonstrate that, during chronic infection, Trib1 depletion in CD8+ T cells increases the expression of KLR-associated genes and drives their clonal expansion and differentiation of TINT toward a TKLR identity. While accumulating evidence indicates that the CX3CR1+ TINT stage of T cell exhaustion is a bifurcation point in differentiation where TINT can become either TKLR effector-like cells or TTERM,4,14,15 less is known about the signaling partners involved in these terminal differentiation steps.15 We show that deleting a single signaling molecule, Trib1, diverted exhaustion toward a more effector-like state, promoting TKLR differentiation, and this skewing was accompanied by greater viral control. Trib1 deletion improved anti-PD-L1 treatment in chronically infected mice, an outcome associated with expansion of both TINT and TKLR, suggesting that a viable strategy for reinvigorating exhausted CD8+ T cells may be to shift the pathway of exhaustion toward a TKLR fate. This finding is in accordance with recent reports that KLR-expressing CD8+ T cells are clinically important in several settings where exhaustion poses a significant barrier to T cell function,23–26 and that TKLR may serve as an alternative fate to TTERM cells.4,14,15 This is especially relevant given that Trib1 is highly expressed in circulating human CD8+PD1+ exhausted T cells and has multiple accessible chromatin regions in exhausted TILs from human basal cell carcinoma.31 Our data in the setting of a well-established preclinical mouse model for T cell exhaustion in conjunction with the finding that Trib1 is highly expressed in human TEX suggests manipulating Trib1, or its signaling partners, could provide a means to improve CD8+ T cell function in the setting of chronic infection or cancer therapy.
CD8+ T cell expression of KLRs, canonical NK cell inhibitory and activating receptors, is well documented in acute infection, and reports on the role of KLRs during chronic infection and cancer have been increasingly described.4,14,23–26 Recently, LCMV-specific KLR-expressing CD8+ T cells were identified during chronic LCMV infection.4,14,15 These cells were transcriptionally and epigenetically distinct from other CD8+ T cells present in either acute infection or earlier in chronic infection,4,14 indicating that they may share some overlapping biological features with short-lived effector CD8+ T cells but that their presence is distinct to the exhaustion milieu. While KLR expression is a defining feature of the TKLR population, expression of various KLR proteins is heterogeneous. Gating on all CX3CR1+ cells, we found co-expression of some KLRs, such as CD94 and NKG2A, while KLRG1 was more narrowly expressed. This particular KLR was associated with the highest expression of other effector-like genes, such as GzmA, Zeb2, and S1pr5, and the lowest expression of genes associated with exhaustion, including Pdcd1, Tox, CD7, Tigit, and Lag3, and thus helps identify TKLR as a distinct cellular subset.
These recent studies suggest that TKLR differentiation is an alternative fate to terminally exhausted TTERM cells downstream of CX3CR1+ TINT cells.4,14,15 Our scRNA-seq and RNA velocity analyses confirm this bifurcation model and show that Trib1 regulates the balance between TKLR verses TTERM differentiation. The mechanism by which Trib1 mediates this balance is at least 2-fold. First, loss of Trib1 expands both the TINT and TKLR subsets with a proportional decrease in the frequency of TTERM cells, suggesting that Trib1 deletion regulates the bipotential fate choice of TINT by pushing them toward a TKLR fate. Effector-like cell enrichment was also reflected by cell numbers, especially within the TKLR subset, and also strongly shown by the clonal behaviors of individual TCR clones found in Trib1 KO mice. In the absence of Trib1, clonally expanded CD8+ T cells were heavily biased toward the TINT and TKLR subsets, indicating robust expansion and/or increased survival of expanded clones within these subsets. While DEGs between WT and Trib1 KO TEX subsets were detected as early as the TPROG stage and increased cellularity emerged at the TINT stage, the most robust and substantial changes occurred at the TKLR stage, with consistently increased frequencies and numbers of this subset. To what extent gene expression changes in the Trib1 KO TPROG subset may contribute to expansion of the TINT and TKLR subsets is unknown.
In co-adoptive transfer experiments of WT and Trib1 KO P14 cells, the loss of Trib1 in CD8+ P14 cells resulted in a specific increase in TKLR differentiation, indicating skewing to this subset was CD8+ T cell intrinsic. This is an important distinction as CD4+ T cell help is known to enhance viral control and maintenance of the broad CX3CR1+ population,13 and Trib1 KO CD4+ T cells have increased cytokine production in this setting.16 Despite the ability of Trib1 KO CD8+ T cells to skew toward TKLR differentiation in a CD8+ T cell-intrinsic manner, the persistence of both TINT and TKLR (whether WT or Trib1 KO) was dependent on CD4+ T cells.
Our data also show that deleting one signaling molecule enhances immune checkpoint blockade. PD-1 is a well-described inhibitory receptor that is upregulated beginning at the TPROG stage, with highest expression on TTERM and lowest expression on TKLR. Blockade of PD-1 or its ligand PD-L1 results in improved viral control during clone 13 infection and improved anti-tumoral immunity in both mouse and human cancers.3,7–9,42 Here, we demonstrate that Trib1 KO improves PD-1 pathway blockade by decreasing viral load compared to WT mice also treated with a blocking PD-L1 antibody, highlighting a potential therapeutic target for improving immune therapies. Additionally, while targeting either the PD-1 pathway or Trib1 alone improved viral control, Trib1 KO produced distinct effects on CD8+ TEX cell ontogeny compared to anti-PD-L1 treatment alone. Specifically, PD-1 pathway blockade acts on the TPROG subset to promote accumulation of CX3CR1+ TINT cells.7–11 It is important to note that these prior studies included all CX3CR1+CD8+ cells within the broad definition of intermediate cells and did not investigate the TKLR subset.10,12,13 Accordingly, we found that PD-L1 pathway blockade led to an expansion of a more narrowly defined CX3CR1+KLRG1− TINT cell subset and Trib1 loss enhanced this expansion as well. However, Trib1 deficiency and not PD-L1 blockade increased the frequency of the CX3CR1+KLRG1+ TKLR population and the combination of Trib1 deletion and immune checkpoint blockade resulted in the greatest expansion of this subset. Thus, in combination, Trib1 deletion and PD-1 blockade serve to first increase the total number of effector-like TINT and TKLR cells and, secondly, increase the function of individual cells, resulting in a more robustly expanded effector-like pool of CD8+ cells.
In summary, we utilized multiple approaches to demonstrate that deleting Trib1 from T cells results in improved viral control that is associated with TINT enrichment and TKLR expansion. Moreover, Trib1 deletion can further augment PD-1 pathway blockade in a model of chronic disease. Combined, these findings demonstrate that Trib1 controls TEX cell differentiation trajectories and suggest that Trib1 or other regulators of TKLR differentiation may be additional strategies for improving immunotherapies such as immune checkpoint blockade during chronic infection and cancer.
Limitations of the study
Further work is needed to determine whether KLR expression is required for the function of the TKLR subset. The molecular target(s) of Trib1 responsible for CX3CR1+CD8+ T cell expansion, function, and survival remain unknown, as do the molecular mechanisms of how Trib1 deletion in CD4+ T cells may affect viral control and CD8+ T cell function. Moreover, expanding studies to investigate the contribution of Trib1 with and without PD-1 pathway blockade in anti-tumor immunity would be insightful.
STAR★METHODS
RESOURCE AVAILABILITY
Lead contact
Further information and requests for resources and reagents should be directed to and will be fulfilled by the corresponding authors, Martha S. Jordan (jordanm@pennmedicine.upenn.edu) and Warren S. Pear (wpear@pennmedicine.upenn.edu).
Materials availability
This study did not generate new and unique reagents.
Data and code availability
All scRNA-seq and scTCR-seq data generated in this study will be deposited on GEO prior to publication. This paper additionally uses publicly available data. The GEO ascension numbers for these datasets are listed in the key resources table.
This study does not report original code.
Any additional information required to reanalyze the data reported in this paper is available from the corresponding authors upon request.
KEY RESOURCES TABLE.
| REAGENT or RESOURCE | SOURCE | IDENTIFIER |
|---|---|---|
|
| ||
| Antibodies | ||
|
| ||
| Anti-mouse Ly108 BV421 | BD Biosciences | Cat#: 740090; RRID: AB_2739850; Clone: 13G3 |
| Anti-mouse Ly108 BV711 | BD Biosciences | Cat: 740823; RRID: AB_2740481; Clone: 13G3 |
| Anti-mouse CX3CR1 BV605 | Biolegend | Cat#: 149027; RRID: AB_2565937; Clone: SA011F11 |
| Anti-mouse CD4 BV786 | Biolegend | Cat#: 100552; RRID: AB_2563053; Clone: RM4-5 |
| Anti-mouse CD4 BB700 | BD Biosciences | Cat#: 566408; RRID: AB_2744427; Clone: RM4-5 |
| Anti-mouse CD44 BV786 | BioLegend | Cat#: 103059; RRID: AB_2571953; Clone: IM7 |
| Anti-mouse CD44 AF700 | Invitrogen | Cat#: 56-0441-82; RRID: AB_494011; Clone: IM7 |
| Anti-mouse CD44 PE | BD Biosciences | Cat# 553134; RRID: AB_394649; Clone IM7 |
| Anti-mouse CD8a BV650 | BD Biosciences | Cat#: 563234; RRID: AB_2738084; Clone: 53–6.7 |
| Anti-mouse CD8a PerCP-Cy5.5 | BD Biosciences | Cat# 551162; RRID: AB_394081; Clone: 53–6.7 |
| Anti-mouse KLRG1 BV421 | BD Biosciences | Cat# 566284; RRID: AB_2737875 Clone: 2F1 |
| Anti-mouse KLRG1 PE/Dazzle 594 | Biolegend | Cat#: 138423; RRID: AB_2564050; Clone: 2F1 |
| Anti-mouse CD101 AF700 | Invitrogen | Cat#: 56-1011-82; RRID: AB_2815246; Clone: Moush101 |
| Anti-mouse TCRbeta APC-Fire | Biolegend | Cat#: 109246; RRID: AB_2629697; Clone: H57-597 |
| Anti-mouse NKG2A B6 PE/Cyanine 7 | Biolegend | Cat#: 142809; RRID: AB_2728160; Clone: 16A11 |
| Anti-mouse CD94 FITC | Biolegend | Cat#: 105506; RRID: AB_2133002; Clone: 18d3 |
| Anti-mouse CD45.2 PerCP/Cyanine 5.5 | Biolegend | Cat#: 109828; RRID: AB_893350; Clone: 104 |
| Anti-mouse CD45.1 | Invitrogen | Cat#: 15-0453-82; RRID: AB_468759; Clone: A20 |
| Anti-mouse CD107a FITC | BD Biosciences | Cat#: 561069; RRID: AB_395057; Clone: ID4B |
| Anti-mouse PD-L1 (B7-H1) | BioXCell | Cat#: BE0101; RRID: AB_10949073; Clone: 10F.9G2 |
| Anti-mouse CD4 antibody (GK1.5) | BioXCell | Cat# BE0003-1; RRID: AB_1107636; Clone GK1.5 |
|
| ||
| Bacterial and virus strains | ||
|
| ||
| LCMV clone 13 | Rafi Ahmed | Grown by Wherry lab |
|
| ||
| Biological samples | ||
|
| ||
| Vero cells | ATCC | Grown by Wherry lab |
|
| ||
| Chemicals, peptides, and recombinant proteins | ||
|
| ||
| gp (33–41) peptide KAVYNFATM | GenScript | Custom |
| LCMV Tetramer gp33 (H2-Db) | NIH Tetramer Core | H2-Db |
| Live/Dead Aqua Fluorescent Dye | Invitrogen | Cat# L34957 |
| BD Brilliant Buffer | BD Biosciences | Cat# 566349 |
| BD Cytofix/Cytoperm Kit | BD Biosciences | Cat# 554714 |
| Brefeldin A | Sigma Aldrich | Cat# B7651-5MG |
| Monensin | BD Biosciences | Cat# 554724 |
| RPMI 1640 medium | Mediatech | Cat# MT10040CM |
| HI Fetal Bovine Serum | HyClone | Cat# SH30071.03 |
| Penicillin-Streptomycin | Mediatech | Cat# MT3002CI |
| β-mercaptoethanol | Sigma-Aldrich | Cat# M6250-500ML |
| L-glutamine | Mediatech | Cat# MT10040CM |
| PBS | Mediatech | Cat# MT21031CV |
| ACK Lysis Buffer | Fisher Scientific | Cat# 10-548E |
| 16% Paraformaldehyde | Fisher Scientific | Cat# 28908 |
| Fc Block 2.4G2 | Supernatant from 2.4G2 hybridoma | Maintained in lab |
| Medium 199 | Thermo Fisher Scientific | Cat# 31100035 |
| Agarose | SeaKem | Cat# 50010 |
| Neutral Red | Sigma Aldrich | Cat# 72210-25G |
|
| ||
| Critical commercial assays | ||
|
| ||
| Chromium Single Cell 5′ Library & Gel Bead Kit | 10x Genomics | Cat# 1000014 |
| Chromium Single Cell V(D)J Enrichment Kit for Mouse T cells | 10x Genomics | Cat# 1000071 |
|
| ||
| Deposited data | ||
|
| ||
| scRNA-seq; Mus musculus LCMV cl13-infected CD8+ and CD4+ T cells | Rome et al.16 | GSE143802 |
| scRNA-seq; Mus musculus LCMV cl13-infected CD8+ T cells | Giles et al.4 | GSE199565 |
| scTCR-seq Mus musculus LCMV cl13-infected T cells from WT and Trib1 KO mice | This paper | GSE235530 |
|
| ||
| Experimental models: Organisms/strains | ||
|
| ||
| Cd4-Cre+Trib1f/f Trib1 KO mice | Rome et al.16 | Bred in house |
| Cd4-Cre+Trib1+/+ Trib1 WT mice | Jackson Labs | Strain 022071; bred in house |
| P14 Mice | Wherry lab | C57BL/6J background; bred in house |
| Cd4-Cre+ Trib1f/f Trib1 KO P14 mice | This paper | Bred in house |
| C57BL/6J WT Mice | Jackson Labs | Strain 000664 |
|
| ||
| Software and algorithms | ||
|
| ||
| Gene Set Enrichment Analysis | Subramanian et al. (2005)43 | https://www.gsea-msigdb.org/gsea/index.jsp |
| TooManyCells 2.2.0.0 | Schwartz et al. (2020)32 | https://github.com/GregorySchwartz/too-many-cells |
| Cellranger 3.1.0 | 10X Genomics | https://support.10xgenomics.com/single-cell-gene-expression/software/ |
| Seurat 4.1.0 | Stuart et al. (2019)44 | https://github.com/satijalab/seurat |
| Scrublet 0.2-1-0 | Wolock et al. (2019)45 | https://github.com/swolock/scrublet |
| Velocyto 0.17.17 | La Manno et al. (2018)39 | https://velocyto.org |
| ScanPY 1.9.1 | Wolf et al. (2018)46 | https://scanpy.readthedocs.io/en/stable/# |
| scVelo 0.2.5 | Bergen et al. (2020)38 | https://scvelo.readthedocs.io/en/stable/ |
| Cellrank 1.5.1 | Lange et al. (2022)40 | https://cellrank.readthedocs.io/en/stable/ |
| dittoSeq 1.6.0 | Bunis et al. (2020)47 | https://github.com/dtm2451/dittoSeq |
| UpsetR 1.4.0 | Conway et al. (2017)48 | https://github.com/hms-dbmi/UpSetR |
| R version 4.1.2 | R foundation | https://www.r-project.org |
| Python version 3.9.2 | Rossum (1995)49 | https://www.python.org/ |
| GraphPad Prism 9.3.1 | GraphPad | https://www.graphpad.com/ |
| FlowJo 10.8.0 and 10.9.0 | FlowJo LLC | https://www.fiowjo.com/solutions/fiowjo |
EXPERIMENTAL MODEL AND STUDY PARTICIPANT DETAILS
Mice
CD4-Cre+Trib1F/F Trib1 KO mice were generated as previously described,16 and were used with age and sex matched CD4-Cre+Trib1+/+ WT mice as controls. Both female and male mice were used in experiments. For adoptive transfer experiments, CD4-Cre+ P14 mice with the WT Trib1 gene and a transgenic TCR specific for LCMV peptide gp33–41 were crossed with CD4-Cre+Trib1F/F Trib1 KO mice to generate conditional Trib1 KO P14 mice. All WT and Trib1 KO mice were bred and backcrossed on the C57BL/6 background. Recipient C57BL/6 CD45 congenic mice were purchased from Jackson Laboratory. Mice were housed in a pathogen-controlled environment and all breeding and animal use was performed in accordance with Institutional Animal Care and Use Committee (IACUC) guidelines at the University of Pennsylvania.
LCMV infection
For all experiments, 5–7-week-old mice were infected with LCMV clone 13 (4 3 × 10⁶ PFU) by tail vein injection. LCMV virus was grown in BHK cells and titered by plaque assay in the laboratory of John Wherry at the University of Pennsylvania. For adoptive transfer experiments, recipient mice were infected one day after adoptive transfer of P14 cells.
METHOD DETAILS
Adoptive T cell transfer
Donor PBMCs were isolated from WT or Trib1 KO P14 mice using Histopaque-1083 centrifugation (Sigma-Aldrich). A small aliquot of PBMCs was stained and analyzed by flow cytometry to determine the frequency of P14 T cells from each donor sample. Recipient mice were intravenously injected with donor PBMCs containing 500 WT and 500 Trib1 KO P14 cells. Mice were infected with LCMV clone 13 one day after adoptive cell transfer. Donor WT and Trib1 KO P14 mice and recipient mice were all congenically distinct based on the expression of CD45.1 and CD45.2.
GK1.5 antibody treatment
WT or Trib1 KO mice were given either 200mg of anti-mouse CD4, clone GK1.5 antibody (BioXCell) or sterile PBS by intraperitoneal injection one day before tail vein infection with LCMV clone 13. Mice were treated again with either 200μg of GK1.5 antibody or sterile PBS one day post infection. Mice were analyzed on day 30 post infection.
Anti-PD-L1 antibody treatment
WT or Trib1 KO mice were infected with clone 13 on day 0. On day 15, all mice were bled and PD-1 expression was confirmed on peripheral CD8+ T cells. Mice were given 5 doses of either 200mg anti-PD-L1 antibody (10F.9G2, BioXCell) or sterile PBS by intraperitoneal injection every 3 days beginning at day 16. Mice were analyzed on day 29, one day after final treatment.
Flow cytometry and cell sorting
Spleens were manually disrupted by passing through a 70 μM cell strainer to generate a single cell suspension. Cells were resuspended in PBS then stained with the amine-reactive dye Live/Dead Aqua (Invitrogen) for 20 min. Surface staining was performed with antibody cocktails using antibodies for Ly108 (13G3, BD), CX3CR1 (SA11F11, Biolegend), CD4 (RM4–5 BD and Biolegend), CD44 (IM7, Biolegend, BD, or Invitrogen), CD8 (53–6.7, BD), KLRG1 (2F1, Biolegend), CD101 (Moushi101, eBioscience), TCRbeta (H57–597, Biolegend), NKG2A (16A11, Biolegend), CD94 (18d3, Biolegend), CD45.2 (104, Biolegend), and CD45.1 (A20, Invitrogen). Tetramer specific for H2-Db-restricted to the gp33–41 epitope of LCMV was obtained from the National Institutes of Health Tetramer Core Facility. Surface staining was completed in staining buffer of 1:1 Brilliant Stain Buffer (BD) and 2% FBS in PBS with 5% Fc block (2.4G) and stained for 1 h at 4°. Cells were washed and fixed in 4% paraformaldehyde. For intracellular staining of CD107a, cells were stimulated for 4 h at 37°C in the presence of 0.4 μg/mL gp3333–41 peptide, of brefeldin A (Sigma-Aldrich), monensin (BD), and anti-CD107a (1D4B, BD) and then staining for surface and intracellular proteins completed using the BD Cytofix/Cytoperm kit per the manufacturer’s instructions. Flow cytometry was run on a BD Fortessa Flow Cytometer. Data were analyzed using FlowJo software (TreeStar, version 10.8.0–10.9.0). For all analysis, doublets were excluded. Cells were gated on live events using Live/Dead Aqua (Invitrogen). For scRNA-sequencing and scTCR-sequencing, cells were sorted on a BD FACSAria II cell sorter as previously described.16
Serum plaque assays for LCMV viral load
Serum was obtained from peripheral blood of infected mice. 10-fold dilutions of serum in 1% RPMI were incubated on adherent Vero cells for 1h at 37°C. Vero cells were then overlaid with a 1:1 mixture of medium (2X Medium 199 with 10% FBS, 1% L-glutamate/Penicillin/Streptomycin) and 1% agarose. Cells were incubated at 37°C for 4d. Cells were then overlaid with medium containing 1% agarose and neutral red dye and incubated at 37°C for 12–16 h. The gel was then removed the cells, plaque-forming units (PFUs) were counted, and viral load was calculated.
scRNA-sequencing and scTCR-sequencing
scRNA-sequencing was performed on sorted activated T cells from WT and Trib1 KO mice infected with LCMV clone 13 for 15d as described16 using the Chromium Single Cell 5ʹ Library & Gel Bead Kit (10x Genomics). scTCR-sequencing and library generation were performed simultaneously using the Chromium Single Cell V(D)J Enrichment Kit for Mouse T cells (10x Genomics). Libraries were sequenced on a NextSeq 550 using paired-end sequencing on one high output FlowCell (Illumina).
Single-cell RNA-seq data analysis based in TooManyCells
Previously published scRNA-seq data of WT and Trib1 KO CD44+ TCRβ+ T cells from d15 p.i with LCMV cl13 (GSE143802)16 was processed using the methodology of Rome et al. and the scRNA-seq analysis program, TooManyCells (v2.2.0.0),32 with default settings. Before analyzing the data, Scrublet (v0.2–1-0)45 was employed to detect the presence of doublets. Overall, only four doublets were detected in total from WT and Trib1 KO cellranger outputs. The TooManyCells “–draw-leaf” flag was used to overlay upper-quartile scaled gene expression across all trees. To generate a new tree containing only cells with low Cd4 expression, Cd4 expression was first projected across the tree with an exact gene expression cutoff of 0, defining Cd4 “high” and “low” expression. A cell whitelist file containing barcodes of only Cd4 low-expressing cells was then created with the TooManyCells “–labels-output” flag and used to generate a new tree with the TooManyCells flag “–cell-whitelist-file.” The tree was trimmed using the flag “–smart-cutoff 1,” which prunes nodes one standard deviation away from the median of all node sizes of the original tree. Differential gene expression between clusters was obtained using edgeR50 through TooManyCells differential with the flag “–normalization ‘NoneNorm’.” Volcano plots and bar graphs were plotted using GraphPad Prism (v9.3.1).
GSEA analysis
GSEA was performed using the Broad Institute software (https://www.gsea-msigdb.org/gsea/index.jsp). Previously published gene signatures4 (consisting of 500 genes) were used as gene sets to compare to a log normalized count matrix with Cd4 low only cells, annotated by TooManyCells cluster using a phenotype file. Genes in the count matrix were ranked by Signal2Noise and GSEA was performed using 1000 phenotype permutations.
Single-cell RNA-seq data analysis based in Seurat
Cellranger outputs were additionally analyzed in R (v4.1.2) using Seurat (v4.1.0).44,51 Cells with numbers of features over 2500 and below 200 and mitochondrial reads above 5% were removed. The remaining cells were assigned identities based on TooManyCells cluster barcodes and cell barcodes not found in the Cd4 low tree were subsetted out of the Seurat object. Gene expression was then normalized using Seurat’s NormalizeData function and scaled by the ScaleData function. The DoHeatmap function was used to generate a heatmap of the top 15 significant DEGs for each cluster, with average expression of genes per cluster generated by the AverageExpression function. Cluster projections of Cluster 3 and Cluster 9 was done following methodology from Giles et. Al4 with S and G2M scores calculated for each cell using the CellCycleScoring function.
RNA velocity analysis
Velocyto (v.17.17)39 was run on the cellranger counts output folder to generate a loom file containing the spliced/unspliced counts matrix. The loom file was merged to an annadata object containing metadata of either WT or Trib1 KO counts matrix restricted to barcodes found in the cell whitelist file using Python (v3.6.8) package scanPY (v1.9.1).46 The annadata object was preprocessed in scanPY following Seurat convention. UMAPs of WT and Trib1 KO were created by setting the number of neighbors to 100 and the numbers of PCs to 50. The spliced/unspliced counts were then normalized using the package scVelo (v0.2.5)38 and genes without a shared splice count of 20 were filtered out of the annadata object. The moments were then computed across 30 neighbors and 30 PCs. Velocities were estimated using scVelo’s dynamical model, and velocities were then calculated and embedded onto UMAPs. The python package cellrank (v1.5.1)40 was then used to calculate terminal states, initial states, macrostate lineages and site directed PAGA, with a probability threshold of 0.95.
Single-cell TCR-seq data analysis
scTCR reads were aligned to the mm10 genome and consensus TCR annotations were performed using the cellranger vdj pipeline (10X genomics, v3.1.0) for WT and Trib1 KO fastqs separately. TCR clonotype data and gene expression data of Cd4 low expressing cells were combined into one overall Seurat object based on shared cell barcodes. Clonotypes with cell populations higher than 5 were used for downstream analysis. Stacked bar graphs of cluster counts per clonotype were visualized using dittBarPlot (dittoSeq, v1.6.0)47 and upset plots were created using UpsetR (v1.4.0).48
QUANTIFICATION AND STATISTICAL ANALYSIS
Statistical methods for each experiment are briefly described in the corresponding figure legend. For direct comparisons of flow cytometry data or viral load, comparisons of two groups are calculated using a student t-test. If variance was statistically significant, a t test with Welch’s correction was used. For P14 adoptive transfer experiments, a paired t test was used given that the comparisons were calculated based on two populations within the same recipient mouse. When mice from two independent experiments were combined for analyses (GK1.5 experiments and anti-PD-L1 experiments), we first performed a two-way ANOVA including in the model the experiment as one factor, the treatment group as the second factor, and the interaction between the experiment and treatment group to evaluate the significance of the interaction. In all cases, there was no significant interaction and thus, the data were combined and analyzed as a 1-way ANOVA with treatment group as the single variable, as shown in Figures 2H–2L and 5. 1-way ANOVAs were performed with Brown-Forsythe and Welch’s correction to account for different variances between treatment groups and multiple comparisons were adjusted for using Dunnet’s T3 test. Statistical methods for computational analysis of scRNA-seq and scTCR-seq is described in the corresponding methods section.
Study approval
No human data were included in this manuscript. Animal studies were performed with the approval of the University of Pennsylvania Institutional Animal Care and Use Committee (IACUC) for the described experiments.
Supplementary Material
Highlights.
Trib1 deficiency promotes effector gene expression during T cell exhaustion (TEX)
Trib1 deletion in TEX drives clonal expansion of effector-like CD8+ TINT and TKLR
Promotion of TKLR in Trib1 KO is CD8 intrinsic, but viral control requires CD4 cells
Trib1 deletion improves viral control during PD-L1 blockade
ACKNOWLEDGMENTS
Flow cytometry used the University of Pennsylvania Flow Cytometry and Cell Sorting Core (P30CA016520). We thank G.W. Schwartz (University of Pennsylvania), Ansuman Satpathy, Bence Daniel, and Joy Pai (Stanford University) and members of the Pear and Jordan labs for advice and helpful discussions. Schematics were created using BioRender. This study was supported by NIH grants R01AI047833 (M.S.J. and W.S.P.); AI155577, AI115712, AI117950, AI108545, AI082630, and CA210944 (E.J.W.); T32CA009615 and K12CA076931 (S.E.M.); T32CA009140 (K.S.R. and J.R.G.); P30CA016520 (P.A.G.); and a CRI-Mark Foundation Fellowship (J.R.G.). The Wherry lab is also supported by the Parker Institute for Cancer Immunotherapy (PICI).
Footnotes
DECLARATION OF INTERESTS
E.J.W. is a member of PICI and advisor for Danger Bio, Marengo, Janssen, New Limit, Pluto Immunotherapeutics, Related Sciences, Rubius Therapeutics, Synthekine, and Surface Oncology. E.J.W. is a founder of Surface Oncology, Danger Bio, and Arsenal Biosciences.
INCLUSION AND DIVERSITY
We support inclusive, diverse, and equitable conduct of research.
SUPPLEMENTAL INFORMATION
Supplemental information can be found online at https://doi.org/10.1016/j.celrep.2023.112905.
REFERENCES
- 1.Hashimoto M, Kamphorst AO, Im SJ, Kissick HT, Pillai RN, Ramalingam SS, Araki K, and Ahmed R (2018). CD8 T Cell Exhaustion in Chronic Infection and Cancer: Opportunities for Interventions. Annu. Rev. Med. 69, 301–318. 10.1146/annurev-med-012017-043208. [DOI] [PubMed] [Google Scholar]
- 2.McLane LM, Abdel-Hakeem MS, and Wherry EJ (2019). CD8 T Cell Exhaustion During Chronic Viral Infection and Cancer. Annu. Rev. Immunol. 37, 457–495. 10.1146/annurev-immunol-041015-055318. [DOI] [PubMed] [Google Scholar]
- 3.Pauken KE, and Wherry EJ (2015). Overcoming T cell exhaustion in infection and cancer. Trends Immunol. 36, 265–276. 10.1016/j.it.2015.02.008. [DOI] [PMC free article] [PubMed] [Google Scholar]
- 4.Giles JR, Ngiow SF, Manne S, Baxter AE, Khan O, Wang P, Staupe R, Abdel-Hakeem MS, Huang H, Mathew D, et al. (2022). Shared and distinct biological circuits in effector, memory and exhausted CD8(+) T cells revealed by temporal single-cell transcriptomics and epigenetics. Nat. Immunol. 23, 1600–1613. 10.1038/s4159-0022-01338-4. [DOI] [PMC free article] [PubMed] [Google Scholar]
- 5.Chung HK, McDonald B, and Kaech SM (2021). The architectural design of CD8+ T cell responses in acute and chronic infection: Parallel structures with divergent fates. J. Exp. Med. 218, e20201730. 10.1084/jem.20201730. [DOI] [PMC free article] [PubMed] [Google Scholar]
- 6.Beltra JC, Manne S, Abdel-Hakeem MS, Kurachi M, Giles JR, Chen Z, Casella V, Ngiow SF, Khan O, Huang YJ, et al. (2020). Developmental Relationships of Four Exhausted CD8(+) T Cell Subsets Reveals Underlying Transcriptional and Epigenetic Landscape Control Mechanisms. Immunity 52, 825–841.e8. 10.1016/j.immuni.2020.04.014. [DOI] [PMC free article] [PubMed] [Google Scholar]
- 7.Blackburn SD, Shin H, Freeman GJ, and Wherry EJ (2008). Selective expansion of a subset of exhausted CD8 T cells by alphaPD-L1 blockade. Proc. Natl. Acad. Sci. USA 105, 15016–15021. 10.1073/pnas.0801497105. [DOI] [PMC free article] [PubMed] [Google Scholar]
- 8.Im SJ, Hashimoto M, Gerner MY, Lee J, Kissick HT, Burger MC, Shan Q, Hale JS, Lee J, Nasti TH, et al. (2016). Defining CD8+ T cells that provide the proliferative burst after PD-1 therapy. Nature 537, 417–421. 10.1038/nature19330. [DOI] [PMC free article] [PubMed] [Google Scholar]
- 9.Utzschneider DT, Charmoy M, Chennupati V, Pousse L, Ferreira DP, Calderon-Copete S, Danilo M, Alfei F, Hofmann M, Wieland D, et al. (2016). T Cell Factor 1-Expressing Memory-like CD8(+) T Cells Sustain the Immune Response to Chronic Viral Infections. Immunity 45, 415–427. 10.1016/j.immuni.2016.07.021. [DOI] [PubMed] [Google Scholar]
- 10.Hudson WH, Gensheimer J, Hashimoto M, Wieland A, Valanparambil RM, Li P, Lin JX, Konieczny BT, Im SJ, Freeman GJ, et al. (2019). Proliferating Transitory T Cells with an Effector-like Transcriptional Signature Emerge from PD-1(+) Stem-like CD8(+) T Cells during Chronic Infection. Immunity 51, 1043–1058.e4. 10.1016/j.immuni.2019.11.002. [DOI] [PMC free article] [PubMed] [Google Scholar]
- 11.Pauken KE, Sammons MA, Odorizzi PM, Manne S, Godec J,Khan O, Drake AM, Chen Z, Sen DR, Kurachi M, et al. (2016). Epigenetic stability of exhausted T cells limits durability of reinvigoration by PD-1 blockade. Science 354, 1160–1165. 10.1126/science.aaf2807. [DOI] [PMC free article] [PubMed] [Google Scholar]
- 12.Chen Y, Zander RA, Wu X, Schauder DM, Kasmani MY, Shen J, Zheng S, Burns R, Taparowsky EJ, and Cui W (2021). BATF regulates progenitor to cytolytic effector CD8(+) T cell transition during chronic viral infection. Nat. Immunol. 22, 996–1007. 10.1038/s41590-021-00965-7. [DOI] [PMC free article] [PubMed] [Google Scholar]
- 13.Zander R, Schauder D, Xin G, Nguyen C, Wu X, Zajac A, and Cui W (2019). CD4(+) T Cell Help Is Required for the Formation of a Cytolytic CD8(+) T Cell Subset that Protects against Chronic Infection and Cancer. Immunity 51, 1028–1042.e4. 10.1016/j.immuni.2019.10.009. [DOI] [PMC free article] [PubMed] [Google Scholar]
- 14.Daniel B, Yost KE, Hsiung S, Sandor K, Xia Y, Qi Y, Hiam-Galvez KJ, Black M, J Raposo C, Shi Q, et al. (2022). Divergent clonal differentiation trajectories of T cell exhaustion. Nat. Immunol. 23, 1614–1627. 10.1038/s41590-022-01337-5. [DOI] [PMC free article] [PubMed] [Google Scholar]
- 15.Kasmani MY, Zander R, Chung HK, Chen Y, Khatun A, Damo M,Topchyan P, Johnson KE, Levashova D, Burns R, et al. (2023). Clonal lineage tracing reveals mechanisms skewing CD8+ T cell fate decisions in chronic infection. J. Exp. Med. 220, e20220679. 10.1084/jem.20220679. [DOI] [PMC free article] [PubMed] [Google Scholar]
- 16.Rome KS, Stein SJ, Kurachi M, Petrovic J, Schwartz GW, Mack EA, Uljon S, Wu WW, DeHart AG, McClory SE, et al. (2020). Trib1 regulates T cell differentiation during chronic infection by restraining the effector program. J. Exp. Med. 217, e20190888. 10.1084/jem.20190888. [DOI] [PMC free article] [PubMed] [Google Scholar]
- 17.Khan O, Giles JR, McDonald S, Manne S, Ngiow SF, Patel KP, Werner MT, Huang AC, Alexander KA, Wu JE, et al. (2019). TOX transcriptionally and epigenetically programs CD8(+) T cell exhaustion. Nature 571, 211–218. 10.1038/s41586-019-1325-x. [DOI] [PMC free article] [PubMed] [Google Scholar]
- 18.Alfei F, Kanev K, Hofmann M, Wu M, Ghoneim HE, Roelli P,Utzschneider DT, von Hoesslin M, Cullen JG, Fan Y, et al. (2019). TOX reinforces the phenotype and longevity of exhausted T cells in chronic viral infection. Nature 571, 265–269. 10.1038/s41586-019-1326-9. [DOI] [PubMed] [Google Scholar]
- 19.Scott AC, Dündar F, Zumbo P, Chandran SS, Klebanoff CA, Shakiba M, Trivedi P, Menocal L, Appleby H, Camara S, et al. (2019). TOX is a critical regulator of tumour-specific T cell differentiation. Nature 571, 270–274. 10.1038/s41586-019-1324-y. [DOI] [PMC free article] [PubMed] [Google Scholar]
- 20.Seo H, Chen J, González-Avalos E, Samaniego-Castruita D, Das A, Wang YH, López-Moyado IF, Georges RO, Zhang W, Onodera A, et al. (2019). TOX and TOX2 transcription factors cooperate with NR4A transcription factors to impose CD8(+) T cell exhaustion. Proc. Natl. Acad. Sci. USA 116, 12410–12415. 10.1073/pnas.1905675116. [DOI] [PMC free article] [PubMed] [Google Scholar]
- 21.Wang X, He Q, Shen H, Xia A, Tian W, Yu W, and Sun B (2019). TOX promotes the exhaustion of antitumor CD8(+) T cells by preventing PD1 degradation in hepatocellular carcinoma. J. Hepatol. 71, 731–741. 10.1016/j.jhep.2019.05.015. [DOI] [PubMed] [Google Scholar]
- 22.Yao C, Sun HW, Lacey NE, Ji Y, Moseman EA, Shih HY, Heuston EF, Kirby M, Anderson S, Cheng J, et al. (2019). Single-cell RNA-seq reveals TOX as a key regulator of CD8(+) T cell persistence in chronic infection. Nat. Immunol. 20, 890–901. 10.1038/s41590-019-0403-4. [DOI] [PMC free article] [PubMed] [Google Scholar]
- 23.Li J, Zaslavsky M, Su Y, Guo J, Sikora MJ, van Unen V, Christophersen A, Chiou SH, Chen L, Li J, et al. (2022). KIR(+)CD8(+) T cells suppress pathogenic T cells and are active in autoimmune diseases and COVID-19. Science 376, eabi9591. 10.1126/science.abi9591. [DOI] [PMC free article] [PubMed] [Google Scholar]
- 24.Chou C, Zhang X, Krishna C, Nixon BG, Dadi S, Capistrano KJ,Kansler ER, Steele M, Han J, Shyu A, et al. (2022). Programme of self-reactive innate-like T cell-mediated cancer immunity. Nature 605, 139–145. 10.1038/s41586-022-04632-1. [DOI] [PMC free article] [PubMed] [Google Scholar]
- 25.Dadi S, Chhangawala S, Whitlock BM, Franklin RA, Luo CT, Oh SA, Toure A, Pritykin Y, Huse M, Leslie CS, and Li MO (2016). Cancer Immunosurveillance by Tissue-Resident Innate Lymphoid Cells and Innate-like T Cells. Cell 164, 365–377. 10.1016/j.cell.2016.01.002. [DOI] [PMC free article] [PubMed] [Google Scholar]
- 26.Prajapati K, Perez C, Rojas LBP, Burke B, and Guevara-Patino JA(2018). Functions of NKG2D in CD8(+) T cells: an opportunity for immunotherapy. Cell. Mol. Immunol. 15, 470–479. 10.1038/cmi.2017.161. [DOI] [PMC free article] [PubMed] [Google Scholar]
- 27.Danger R, Feseha Y, and Brouard S (2022). The Pseudokinase TRIB1 in Immune Cells and Associated Disorders. Cancers 14, 1011. 10.3390/cancers14041011. [DOI] [PMC free article] [PubMed] [Google Scholar]
- 28.Dedhia PH, Keeshan K, Uljon S, Xu L, Vega ME, Shestova O,Zaks-Zilberman M, Romany C, Blacklow SC, and Pear WS (2010). Differential ability of Tribbles family members to promote degradation of C/EBPalpha and induce acute myelogenous leukemia. Blood 116, 1321–1328. 10.1182/blood-2009-07-229450. [DOI] [PMC free article] [PubMed] [Google Scholar]
- 29.Murphy JM, Nakatani Y, Jamieson SA, Dai W, Lucet IS, and Mace PD (2015). Molecular Mechanism of CCAAT-Enhancer Binding Protein Recruitment by the TRIB1 Pseudokinase. Structure 23, 2111–2121. 10.1016/j.str.2015.08.017. [DOI] [PubMed] [Google Scholar]
- 30.Uljon S, Xu X, Durzynska I, Stein S, Adelmant G, Marto JA, Pear WS, and Blacklow SC (2016). Structural Basis for Substrate Selectivity of the E3 Ligase COP1. Structure 24, 687–696. 10.1016/j.str.2016.03.002. [DOI] [PMC free article] [PubMed] [Google Scholar]
- 31.Giles JR, Manne S, Freilich E, Oldridge DA, Baxter AE, George S, Chen Z, Huang H, Chilukuri L, Carberry M, et al. (2022). Human epigenetic and transcriptional T cell differentiation atlas for identifying functional T cell-specific enhancers. Immunity 55, 557–574.e7. 10.1016/j.immuni.2022.02.004. [DOI] [PMC free article] [PubMed] [Google Scholar]
- 32.Schwartz GW, Zhou Y, Petrovic J, Fasolino M, Xu L, Shaffer SM,Pear WS, Vahedi G, and Faryabi RB (2020). TooManyCells identifies and visualizes relationships of single-cell clades. Nat. Methods 17, 405–413. 10.1038/s41592-020-0748-5. [DOI] [PMC free article] [PubMed] [Google Scholar]
- 33.Knell J, Best JA, Lind NA, Yang E, D’Cruz LM, and Goldrath AW (2013). Id2 influences differentiation of killer cell lectin-like receptor G1(hi) short-lived CD8+ effector T cells. J. Immunol. 190, 1501–1509. 10.4049/jimmunol.1200750. [DOI] [PMC free article] [PubMed] [Google Scholar]
- 34.Weinreich MA, Takada K, Skon C, Reiner SL, Jameson SC, and Hogquist KA (2009). KLF2 transcription-factor deficiency in T cells results in unrestrained cytokine production and upregulation of bystander chemokine receptors. Immunity 31, 122–130. 10.1016/j.immuni.2009.05.011. [DOI] [PMC free article] [PubMed] [Google Scholar]
- 35.Aubert RD, Kamphorst AO, Sarkar S, Vezys V, Ha SJ, Barber DL, Ye L, Sharpe AH, Freeman GJ, and Ahmed R (2011). Antigen-specific CD4 T-cell help rescues exhausted CD8 T cells during chronic viral infection. Proc. Natl. Acad. Sci. USA 108, 21182–21187. 10.1073/pnas.1118450109. [DOI] [PMC free article] [PubMed] [Google Scholar]
- 36.Matloubian M, Concepcion RJ, and Ahmed R (1994). CD4+ T cells are required to sustain CD8+ cytotoxic T-cell responses during chronic viral infection. J. Virol. 68, 8056–8063. 10.1128/JVI.68.12.8056-8063.1994. [DOI] [PMC free article] [PubMed] [Google Scholar]
- 37.Zajac AJ, Blattman JN, Murali-Krishna K, Sourdive DJ, Suresh M, Altman JD, and Ahmed R (1998). Viral immune evasion due to persistence of activated T cells without effector function. J. Exp. Med. 188, 2205–2213. 10.1084/jem.188.12.2205. [DOI] [PMC free article] [PubMed] [Google Scholar]
- 38.Bergen V, Lange M, Peidli S, Wolf FA, and Theis FJ (2020). Generalizing RNA velocity to transient cell states through dynamical modeling. Nat. Biotechnol. 38, 1408–1414. 10.1038/s41587-020-0591-3. [DOI] [PubMed] [Google Scholar]
- 39.La Manno G, Soldatov R, Zeisel A, Braun E, Hochgerner H, Petukhov V, Lidschreiber K, Kastriti ME, Lönnerberg P, Furlan A, et al. (2018). RNA velocity of single cells. Nature 560, 494–498. 10.1038/s41586-018-0414-6. [DOI] [PMC free article] [PubMed] [Google Scholar]
- 40.Lange M, Bergen V, Klein M, Setty M, Reuter B, Bakhti M, Lickert H, Ansari M, Schniering J, Schiller HB, et al. (2022). CellRank for directed single-cell fate mapping. Nat. Methods 19, 159–170. 10.1038/s41592-021-01346-6. [DOI] [PMC free article] [PubMed] [Google Scholar]
- 41.Blackburn SD, Shin H, Haining WN, Zou T, Workman CJ, Polley A, Betts MR, Freeman GJ, Vignali DAA, and Wherry EJ (2009). Coregulation of CD8+ T cell exhaustion by multiple inhibitory receptors during chronic viral infection. Nat. Immunol. 10, 29–37. 10.1038/ni.1679. [DOI] [PMC free article] [PubMed] [Google Scholar]
- 42.Krishna S, Lowery FJ, Copeland AR, Bahadiroglu E, Mukherjee R, Jia L, Anibal JT, Sachs A, Adebola SO, Gurusamy D, et al. (2020). Stem-like CD8 T cells mediate response of adoptive cell immunotherapy against human cancer. Science 370, 1328–1334. 10.1126/science.abb9847. [DOI] [PMC free article] [PubMed] [Google Scholar]
- 43.Subramanian A, Tamayo P, Mootha VK, Mukherjee S, Ebert BL, Gillette MA, Paulovich A, Pomeroy SL, Golub TR, Lander ES, and Mesirov JP (2005). Gene set enrichment analysis: a knowledge-based approach for interpreting genome-wide expression profiles. Proc. Natl. Acad. Sci. USA 102, 15545–15550. 10.1073/pnas.0506580102. [DOI] [PMC free article] [PubMed] [Google Scholar]
- 44.Stuart T, Butler A, Hoffman P, Hafemeister C, Papalexi E, Mauck WM 3rd, Hao Y, Stoeckius M, Smibert P, and Satija R (2019). Comprehensive Integration of Single-Cell Data. Cell 177, 1888–1902.e21. 10.1016/j.cell.2019.05.031. [DOI] [PMC free article] [PubMed] [Google Scholar]
- 45.Wolock SL, Lopez R, and Klein AM (2019). Scrublet: Computational Identification of Cell Doublets in Single-Cell Transcriptomic Data. Cell Syst. 8, 281–291.e9. 10.1016/j.cels.2018.11.005. [DOI] [PMC free article] [PubMed] [Google Scholar]
- 46.Wolf FA, Angerer P, and Theis FJ (2018). SCANPY: large-scale single-cell gene expression data analysis. Genome Biol. 19, 15. 10.1186/s13059-017-1382-0. [DOI] [PMC free article] [PubMed] [Google Scholar]
- 47.Bunis DG, Andrews J, Fragiadakis GK, Burt TD, and Sirota M (2021). dittoSeq: Universal User-Friendly Single-Cell and Bulk RNA Sequencing Visualization Toolkit. Bioinformatics 36, 5535–5536. 10.1093/bioinformatics/btaa1011. [DOI] [PMC free article] [PubMed] [Google Scholar]
- 48.Conway JR, Lex A, and Gehlenborg N (2017). UpSetR: an R package for the visualization of intersecting sets and their properties. Bioinformatics 33, 2938–2940. 10.1093/bioinformatics/btx364. [DOI] [PMC free article] [PubMed] [Google Scholar]
- 49.Rossum G (1995). Python reference manual (CWI (Centre for Mathematics and Computer Science). [Google Scholar]
- 50.Robinson MD, McCarthy DJ, and Smyth GK (2010). edgeR: a Bioconductor package for differential expression analysis of digital gene expression data. Bioinformatics 26, 139–140. 10.1093/bioinformatics/btp616. [DOI] [PMC free article] [PubMed] [Google Scholar]
- 51.Butler A, Hoffman P, Smibert P, Papalexi E, and Satija R (2018). Integrating single-cell transcriptomic data across different conditions, technologies, and species. Nat. Biotechnol. 36, 411–420. 10.1038/nbt.4096. [DOI] [PMC free article] [PubMed] [Google Scholar]
Associated Data
This section collects any data citations, data availability statements, or supplementary materials included in this article.
Supplementary Materials
Data Availability Statement
All scRNA-seq and scTCR-seq data generated in this study will be deposited on GEO prior to publication. This paper additionally uses publicly available data. The GEO ascension numbers for these datasets are listed in the key resources table.
This study does not report original code.
Any additional information required to reanalyze the data reported in this paper is available from the corresponding authors upon request.
KEY RESOURCES TABLE.
| REAGENT or RESOURCE | SOURCE | IDENTIFIER |
|---|---|---|
|
| ||
| Antibodies | ||
|
| ||
| Anti-mouse Ly108 BV421 | BD Biosciences | Cat#: 740090; RRID: AB_2739850; Clone: 13G3 |
| Anti-mouse Ly108 BV711 | BD Biosciences | Cat: 740823; RRID: AB_2740481; Clone: 13G3 |
| Anti-mouse CX3CR1 BV605 | Biolegend | Cat#: 149027; RRID: AB_2565937; Clone: SA011F11 |
| Anti-mouse CD4 BV786 | Biolegend | Cat#: 100552; RRID: AB_2563053; Clone: RM4-5 |
| Anti-mouse CD4 BB700 | BD Biosciences | Cat#: 566408; RRID: AB_2744427; Clone: RM4-5 |
| Anti-mouse CD44 BV786 | BioLegend | Cat#: 103059; RRID: AB_2571953; Clone: IM7 |
| Anti-mouse CD44 AF700 | Invitrogen | Cat#: 56-0441-82; RRID: AB_494011; Clone: IM7 |
| Anti-mouse CD44 PE | BD Biosciences | Cat# 553134; RRID: AB_394649; Clone IM7 |
| Anti-mouse CD8a BV650 | BD Biosciences | Cat#: 563234; RRID: AB_2738084; Clone: 53–6.7 |
| Anti-mouse CD8a PerCP-Cy5.5 | BD Biosciences | Cat# 551162; RRID: AB_394081; Clone: 53–6.7 |
| Anti-mouse KLRG1 BV421 | BD Biosciences | Cat# 566284; RRID: AB_2737875 Clone: 2F1 |
| Anti-mouse KLRG1 PE/Dazzle 594 | Biolegend | Cat#: 138423; RRID: AB_2564050; Clone: 2F1 |
| Anti-mouse CD101 AF700 | Invitrogen | Cat#: 56-1011-82; RRID: AB_2815246; Clone: Moush101 |
| Anti-mouse TCRbeta APC-Fire | Biolegend | Cat#: 109246; RRID: AB_2629697; Clone: H57-597 |
| Anti-mouse NKG2A B6 PE/Cyanine 7 | Biolegend | Cat#: 142809; RRID: AB_2728160; Clone: 16A11 |
| Anti-mouse CD94 FITC | Biolegend | Cat#: 105506; RRID: AB_2133002; Clone: 18d3 |
| Anti-mouse CD45.2 PerCP/Cyanine 5.5 | Biolegend | Cat#: 109828; RRID: AB_893350; Clone: 104 |
| Anti-mouse CD45.1 | Invitrogen | Cat#: 15-0453-82; RRID: AB_468759; Clone: A20 |
| Anti-mouse CD107a FITC | BD Biosciences | Cat#: 561069; RRID: AB_395057; Clone: ID4B |
| Anti-mouse PD-L1 (B7-H1) | BioXCell | Cat#: BE0101; RRID: AB_10949073; Clone: 10F.9G2 |
| Anti-mouse CD4 antibody (GK1.5) | BioXCell | Cat# BE0003-1; RRID: AB_1107636; Clone GK1.5 |
|
| ||
| Bacterial and virus strains | ||
|
| ||
| LCMV clone 13 | Rafi Ahmed | Grown by Wherry lab |
|
| ||
| Biological samples | ||
|
| ||
| Vero cells | ATCC | Grown by Wherry lab |
|
| ||
| Chemicals, peptides, and recombinant proteins | ||
|
| ||
| gp (33–41) peptide KAVYNFATM | GenScript | Custom |
| LCMV Tetramer gp33 (H2-Db) | NIH Tetramer Core | H2-Db |
| Live/Dead Aqua Fluorescent Dye | Invitrogen | Cat# L34957 |
| BD Brilliant Buffer | BD Biosciences | Cat# 566349 |
| BD Cytofix/Cytoperm Kit | BD Biosciences | Cat# 554714 |
| Brefeldin A | Sigma Aldrich | Cat# B7651-5MG |
| Monensin | BD Biosciences | Cat# 554724 |
| RPMI 1640 medium | Mediatech | Cat# MT10040CM |
| HI Fetal Bovine Serum | HyClone | Cat# SH30071.03 |
| Penicillin-Streptomycin | Mediatech | Cat# MT3002CI |
| β-mercaptoethanol | Sigma-Aldrich | Cat# M6250-500ML |
| L-glutamine | Mediatech | Cat# MT10040CM |
| PBS | Mediatech | Cat# MT21031CV |
| ACK Lysis Buffer | Fisher Scientific | Cat# 10-548E |
| 16% Paraformaldehyde | Fisher Scientific | Cat# 28908 |
| Fc Block 2.4G2 | Supernatant from 2.4G2 hybridoma | Maintained in lab |
| Medium 199 | Thermo Fisher Scientific | Cat# 31100035 |
| Agarose | SeaKem | Cat# 50010 |
| Neutral Red | Sigma Aldrich | Cat# 72210-25G |
|
| ||
| Critical commercial assays | ||
|
| ||
| Chromium Single Cell 5′ Library & Gel Bead Kit | 10x Genomics | Cat# 1000014 |
| Chromium Single Cell V(D)J Enrichment Kit for Mouse T cells | 10x Genomics | Cat# 1000071 |
|
| ||
| Deposited data | ||
|
| ||
| scRNA-seq; Mus musculus LCMV cl13-infected CD8+ and CD4+ T cells | Rome et al.16 | GSE143802 |
| scRNA-seq; Mus musculus LCMV cl13-infected CD8+ T cells | Giles et al.4 | GSE199565 |
| scTCR-seq Mus musculus LCMV cl13-infected T cells from WT and Trib1 KO mice | This paper | GSE235530 |
|
| ||
| Experimental models: Organisms/strains | ||
|
| ||
| Cd4-Cre+Trib1f/f Trib1 KO mice | Rome et al.16 | Bred in house |
| Cd4-Cre+Trib1+/+ Trib1 WT mice | Jackson Labs | Strain 022071; bred in house |
| P14 Mice | Wherry lab | C57BL/6J background; bred in house |
| Cd4-Cre+ Trib1f/f Trib1 KO P14 mice | This paper | Bred in house |
| C57BL/6J WT Mice | Jackson Labs | Strain 000664 |
|
| ||
| Software and algorithms | ||
|
| ||
| Gene Set Enrichment Analysis | Subramanian et al. (2005)43 | https://www.gsea-msigdb.org/gsea/index.jsp |
| TooManyCells 2.2.0.0 | Schwartz et al. (2020)32 | https://github.com/GregorySchwartz/too-many-cells |
| Cellranger 3.1.0 | 10X Genomics | https://support.10xgenomics.com/single-cell-gene-expression/software/ |
| Seurat 4.1.0 | Stuart et al. (2019)44 | https://github.com/satijalab/seurat |
| Scrublet 0.2-1-0 | Wolock et al. (2019)45 | https://github.com/swolock/scrublet |
| Velocyto 0.17.17 | La Manno et al. (2018)39 | https://velocyto.org |
| ScanPY 1.9.1 | Wolf et al. (2018)46 | https://scanpy.readthedocs.io/en/stable/# |
| scVelo 0.2.5 | Bergen et al. (2020)38 | https://scvelo.readthedocs.io/en/stable/ |
| Cellrank 1.5.1 | Lange et al. (2022)40 | https://cellrank.readthedocs.io/en/stable/ |
| dittoSeq 1.6.0 | Bunis et al. (2020)47 | https://github.com/dtm2451/dittoSeq |
| UpsetR 1.4.0 | Conway et al. (2017)48 | https://github.com/hms-dbmi/UpSetR |
| R version 4.1.2 | R foundation | https://www.r-project.org |
| Python version 3.9.2 | Rossum (1995)49 | https://www.python.org/ |
| GraphPad Prism 9.3.1 | GraphPad | https://www.graphpad.com/ |
| FlowJo 10.8.0 and 10.9.0 | FlowJo LLC | https://www.fiowjo.com/solutions/fiowjo |