

Abstract
We have developed a method that enables the multiplexed detection of proteins based on counting single molecules. Paramagnetic beads were labeled with fluorescent dyes to create optically distinct subpopulations of beads, and antibodies to specific proteins were then immobilized to individual subpopulations. Mixtures of subpopulations of beads were then incubated with a sample, and specific proteins were captured on their specific beads; these proteins were then labeled with enzymes via immunocomplex formation. The beads were suspended in enzyme substrate, loaded into arrays of femtoliter wells—or Single Molecule Arrays (Simoa)—that were integrated into a microfluidic device (the Simoa disc). The wells were then sealed with oil, and imaged fluorescently to determine: a) the location and subpopulation identity of individual beads in the femtoliter wells, and b) the presence or absence of a single enzyme associated with each bead. The images were analyzed to determine the average enzyme per bead (AEB) for each bead subpopulation that provide a quantitative parameter for determining the concentration of each protein. We used this approach to simultaneously detect TNF-α, IL-6, IL-1α, and IL-1β in human plasma with single molecule resolution at subfemtomolar concentrations, i.e., 200- to 1000-fold more sensitive than current multiplexed immunoassays. The simultaneous, specific, and sensitive measurement of several proteins using multiplexed digital ELISA could enable more reliable diagnoses of disease.
Introduction
The ability to precisely measure multiple proteins simultaneously is important in several fields, including clinical diagnostics, testing of blood banks, and the analysis of biochemical pathways.1 Multiplexed protein measurements provide richer information on the biological status of a sample compared to single protein measurements, while minimizing the use of sample volume and eliminating the need to run multiple assays. We have developed a method for the simultaneous detection of single molecules of multiple proteins, an approach we call multiplexed digital ELISA. Digital ELISA—which we have previously described2—works by capturing proteins on microscopic beads, labeling the proteins with an enzyme, isolating the beads in arrays of 50-fL wells (Single Molecule Arrays, or Simoa), and detecting bead-associated enzymatic activity using fluorescence imaging. In multiplexed digital ELISA, multiple subpopulations of beads each with its own fluorescent signature and specific antibody are incubated together in the same sample, and imaged simultaneously on the same array within a microfluidic device. Spatial localization of individual beads in arrays enables the simultaneous determination of the single molecule signal associated with each bead subpopulation, enabling concentrations of multiple proteins to be determined at very low concentrations. We have used this method to simultaneously measure four cytokines in plasma down to low to subfemtomolar concentrations, potentially facilitating greater understanding of inflammatory diseases.
Multiplexed protein measurements have previously been developed using both planar and bead-based protein capture methods. Planar multiplexed protein arrays—where capture antibodies are spotted onto planar surfaces in periodic arrays—have traditionally suffered from poor sensitivity and high cross-reactivity, but robust planar arrays for multiplexing 2–10 proteins at picomolar concentrations have emerged.3 Bead-based methods, where proteins are captured and labeled on beads in solution, have been used to detect close to 100 proteins in serum, also at picomolar concentrations.4 The xMAP technology (Luminex Corporation)—based on the detection of immunocomplexes associated with fluorescently encoded beads in a flow cytometer—in particular, has found widespread adoption.3,4,5,6,7 While these two approaches have enabled the measurement of multiple proteins in blood, the fact that they rely on the ensemble signal from a large number of reporter molecules has limited their sensitivity—hundreds of labeled antibodies are required to reach instrument detection limits8—and has limited their use in clinical diagnostics where analytical sensitivity is essential. We sought to develop an approach that combined the single molecule sensitivity of digital ELISA with bead encoding techniques to provide highly sensitive, multiplexed detection of proteins. Current ensemble multiplexed immunoassays are not sensitive enough to detect cytokines in many patients with chronic inflammatory disease.9,10 Multiplexed cytokines assays with femtomolar sensitivity would allow the precise measurement of these proteins in blood, and potentially enable the next generation of multivariate diagnostic tests.
Methods and Materials
Materials.
2.7-μm-diam., carboxyl-functionalized paramagnetic beads were obtained from Agilent Technologies. 1-ethyl-3-(3-dimethylaminopropyl) carbodiimide hydrochloride (EDC) was purchased from Thermo Scientific. Tween 20, bovine serum albumin (BSA), and 2-(N-morpholino)ethanesulfonic acid (MES) were purchased from Sigma-Aldrich. Phosphate buffered saline (PBS) was from Amresco. Alexa Fluor 488 hydrazide was obtained from Life Technologies. Cyanine-5 (cy5) hydrazide was obtained from GE Healthcare. Hilyte 750 hydrazide was obtained from Anaspec. Antibodies and proteins were obtained from R&D Systems. Detection antibodies were biotinylated using standard methods as described previously.11 Streptavidin-β-galactosidase (SβG) was conjugated in the laboratory using protocols described previously.11 Resorufin-β-D-galactopyranoside (RGP) was purchased from Life Technologies. Simoa discs—comprised of 24 arrays of femtoliter wells molded into cylic olefin polymer and bonded to a microfluidic manifold, as described previously12—were obtained from Sony DADC. Fluorocarbon oil (Krytox®) was obtained from Dupont. De-indentified plasma samples from human donors were obtained from Bioreclamation.
Preparation of populations of fluorescently labeled capture beads that present different antibodies.
A stock solution of paramagnetic beads (2.3 × 10⁹ beads/mL) was vortexed for 5 s three times, and placed on rotary mixer for 15 min. 521 μL of bead solution (1.2 × 10⁹ beads) was pipetted into a 1.7-mL polypropylene tube. The beads were separated on a magnet and washed twice with 1 mL PBS + 0.1% Tween 20, and twice with 1mL PBS. The beads were resuspended in 1 mL of PBS and transferred into 15-mL polypropylene tube. 1 mg of the dye-hydrazide was dissolved in 100 μL PBS. A solution of 40 mg/mL EDC in MES buffer pH 6.2 was prepared. Sufficient PBS was first added to the tube to make the total reaction volume 10 mL, 2.4–213 μL of dye hydrazide solution was then added to the beads depending on the fluorescence level required, and 250 μL of 40 mg/mL EDC was added to the bead/dye suspension. The tube was capped, inverted twice, vortexed intermittently for 10 s, and placed on a rotating mixer for 30 min. After separating the beads on a magnet, the beads were washed once with 5 mL PBS + 0.1% Tween 20, resuspended in 1 mL of PBS + 0.1% Tween 20, and transferred into a 1.7-mL polypropylene tube. After separating the beads on a magnet, the beads fieldwere washed 3 times with 1 mL of PBS + 0.1% Tween 20, resuspended in 1mL PBS + 0.1% Tween 20, and placed on a rotating mixer for 1 h. After separating the beads on a magnet, the PBS + 0.1% Tween 20 solution was removed, the beads were resuspended in 1 mL of 100 mM sodium bicarbonate buffer pH 9.3 added, and placed on a rotating mixer for 1 h. The beads were stored in 100 mM sodium bicarbonate buffer, pH 9.3 at 2–8 °C in an opaque container. To conjugate an antibody to dye-encoded beads, 479 μL of encoded bead stock (1.2 × 10⁹ beads/mL = 0.575 × 10⁹ beads) was pipetted into a 1.7-mL polypropylene tube. The beads were separated and washed 3 times with 0.01 M NaOH, followed by separation and washing 3 times with deionized water. The beads were separated and washed twice with PBS + 0.1% Tween 20, followed by twice with 50 mM MES pH 6.2. A solution of 1 mg/mL capture antibody in 50 mM MES pH 6.2 was prepared. The beads were pelleted on a magnet, the buffer was aspirated, and 0.25 mL of 1 mg/mL capture antibody solution was added to the beads. The mixture of beads and solution of antibody was vortexed, and incubated on a rotation mixer for 30 min. A solution containing 0.1 mg/mL EDC in 50 mM MES pH 6.2 was prepared, and 0.25 mL of this solution was added to the bead/antibody solution. This mixture was vortexed and incubated on the rotation mixer for 30 min, and the beads were separated and washed 3 times with PBS. 1 mL of 1% BSA in PBS was added to the beads and incubated for 60 min on the rotation mixer. The beads were washed twice with PBS, and stored at 2−8 °C in a buffer containing 500 mM Tris + 1% BSA + 0.1 % Tween 20 + 0.15% Proclin 300 antimicrobial.
Capture of multiple proteins on subpopulations of magnetic beads and formation of enzyme-labeled immunocomplexes.
500,000 beads of each of the four subpopulations presenting antibodies to the four proteins were mixed, pelleted, and the supernatant was aspirated. Test solutions (100 μL) were added to the mixture of the 2,000,000 magnetic beads and incubated for 2 h at 23 °C. The beads were then separated and washed three times in 5× PBS and 0.1% Tween-20. The beads were resuspended and incubated with solutions containing mixtures of biotinylated detection antibodies (anti-TNF-α at 0.1 μg/mL; anti-IL-6 at 0.15 μg/mL; anti-IL-1α at 0.1 μg/mL; and anti-IL-1β at 0.3 μg/mL) for 60 min at 23 °C. The beads were then separated and washed three times in 5× PBS and 0.1% Tween-20. The beads were incubated with solutions containing SβG (35 pM) for 30 min at 23 °C, separated, washed seven times in 5× PBS and 0.1% Tween-20, and washed once in PBS. 1 million beads were then resuspended in 120 μL of 100 μM RGP in PBS, and 15 μL of this bead solution was loaded into a Simoa disc. The bead manipulation steps were performed on a Tecan EVO liquid handling system.
Loading and sealing of beads in femtoliter-volume well arrays.
A Simoa disc composed of 24 3 × 4 mm arrays of ~216,000 femtoliter wells and individually addressable microfluidic manifolds12 was placed on the platen of a customized system developed by Stratec Biomedical for the load, seal, and imaging of the arrays. We have described the design of this microfluidic device and have provided details of its operation in a previous publication.12 For each sample analyzed, 15 μL of the solution containing the mixture of bead subpopulations and RGP was pipetted manually into the inlet port of the disc. Vacuum pressure was then applied to the outlet port and drew the bead solution over the arrays of femtoliter wells. The beads were allowed to settle via gravity onto the wells of the array for 2 min. After the beads had settled, 50 μL of fluorocarbon oil was automatically dispensed by the system in the inlet port, and vacuum was simultaneously applied to the outlet port to pull the oil over the array. The oil pushed the aqueous solution and beads that were not in wells off the array surface, and formed a liquid-tight seal over the wells containing beads and enzyme substrate as described previously.12
Imaging of single molecules and fluorescent beads in femtoliter-volume well arrays.
Once the wells were sealed, a customized optical arrangement in the load, seal, and image system performed the imaging steps necessary for identifying which bead types were in which well, and whether enzyme activity was associated with the beads. The fluorescence-based optical system (developed by Stratec Biomedical) was composed of: a white light illumination source; a custom, 12-element, wide field of view (3 × 4 mm object) microscope lens system; a CCD camera (Allied Vision, Prosilica GT3300 8 Mp). The imaging process took 45 s in total for each array, and was composed of the following sequential steps. First, a “dark field” image of the array was acquired by using the 622 nm/615 nm excitation/emission filters (exposure time = 0.3 ms). Second, an image at 574 nm/615 nm excitation/emission (exposure time = 3 s) was acquired; this image is the t = 0 image (F1) of the single molecule resorufin signal. Third, an image at excitation/emission of 740 nm/800 nm (exposure time = 9 s) was acquired to identify beads labelled with the HF-750 dye. Fourth, an image at excitation/emission of 680 nm/720 nm (exposure time = 3 s) was acquired; this image was not used in this work. Fifth, an image at excitation/emission of 622 nm/667 nm (exposure time = 3 s) was acquired to identify beads labelled with the cy5 dye. Sixth, an image at 574 nm/615 nm excitation/emission (exposure time = 3 s) was acquired 30 s after the image F1; this image is the t = 30 s image (F2) of the single molecule resorufin signal. Finally, an image at excitation/emission of 490 nm/530 nm (exposure time = 2 s) was acquired to identify beads labelled with the AF-488 dye. Images were saved as a single IPL file.
Analysis of images.
A custom image analysis software program was used to determine the enzyme activity associated with each bead within each subpopulation from the captured images. An algorithm first identified and removed occlusions (such as bubbles and dust) from the images. A masking method was then applied to the dark field image to define the locations and boundaries of the wells. The resulting well mask was then applied to each of the fluorescence images to determine the presence of beads and enzymes within the wells. For the bead fluorescence images, histograms of fluorescence intensity were generated for the well population. Peaks in the histograms were identified automatically and used to determine the populations of empty wells (low fluorescence), and populations of single beads at a particular fluorescence level for each fluorescence wavelength. The well mask was also applied to the difference between the second and first frame at the resorufin wavelengths, i.e., F2−F1. Wells that had been classified as containing a single bead from a particular bead subpopulation were classified as: a) associated with enzyme activity (“on” or active), if the fluorescence from resorufin within that well increased beyond a known threshold, or; b) not associated with enzyme activity (“off” or inactive), if the fluorescence from resorufin within that well did not increase beyond a known threshold. For each “on” bead the intensity increase was determined. For each bead subpopulation, the fraction of “on” beads (fon) was determined. In the digital range (fon < 0.7), fon was converted to average number of enzymes per bead (AEB) using the Poisson distribution equation as described previously.11 In the analog range (fon > 0.7), AEB was determined from the average increase in fluorescence of all the beads in an array as described previously.11 During classification of beaded wells and determination of enzyme activity, the fluorescence and location of wells were corrected for the following: optical blurring and scattering, background non-uniformity, intra-well bead settling locations, wavelength-dependent refraction differences in the lens assembly, and bleed of fluorescence of dyes outside their dominant wavelengths.
Results and Discussion
The measurement of single proteins using digital ELISA has been described in detail previously.2,1 In multiplexed digital ELISA (Figure 1), subpopulations of microscopic beads each with their own unique fluorescent signature were created. Capture antibodies that bind a specific target protein were then immobilized on each subpopulation of beads. The subpopulations of beads were combined and incubated with a sample. An immunoassay sandwich was then formed by capture of the specific proteins on the corresponding subpopulations of beads, followed by sequential labeling of these proteins using a mixture of corresponding specific, biotinylated detection antibodies, and a common enzyme reporter molecule, streptavidin-β-galactosidase (SβG). The beads were suspended in a fluorogenic substrate of SβG, and loaded into a microfluidic device (the “Simoa disc”)12 containing a 3×4 mm array of ~216,000 femtoliter-sized microwells micromolded in cyclic olefin polymer. The microfluidic design of the Simoa disc has been described in detail in a previous publication;12 the use of a micromolded microfluidic device provided the large numbers of wells, low fluorescence, and simple fluidic sealing to enable multiplexed Simoa. The wells of the array were sealed using fluorocarbon oil to prevent diffusion of the fluorescent product out of the wells.12 A bead associated with a single enzyme label generates a locally high concentration of fluorescent product in the sealed 50-fL well, making it possible to image single molecules.2 After sealing, the array was fluorescently imaged at the excitation/emission wavelengths of the enzyme product and the different dyes used to label the subpopulations of beads.
Figure 1.
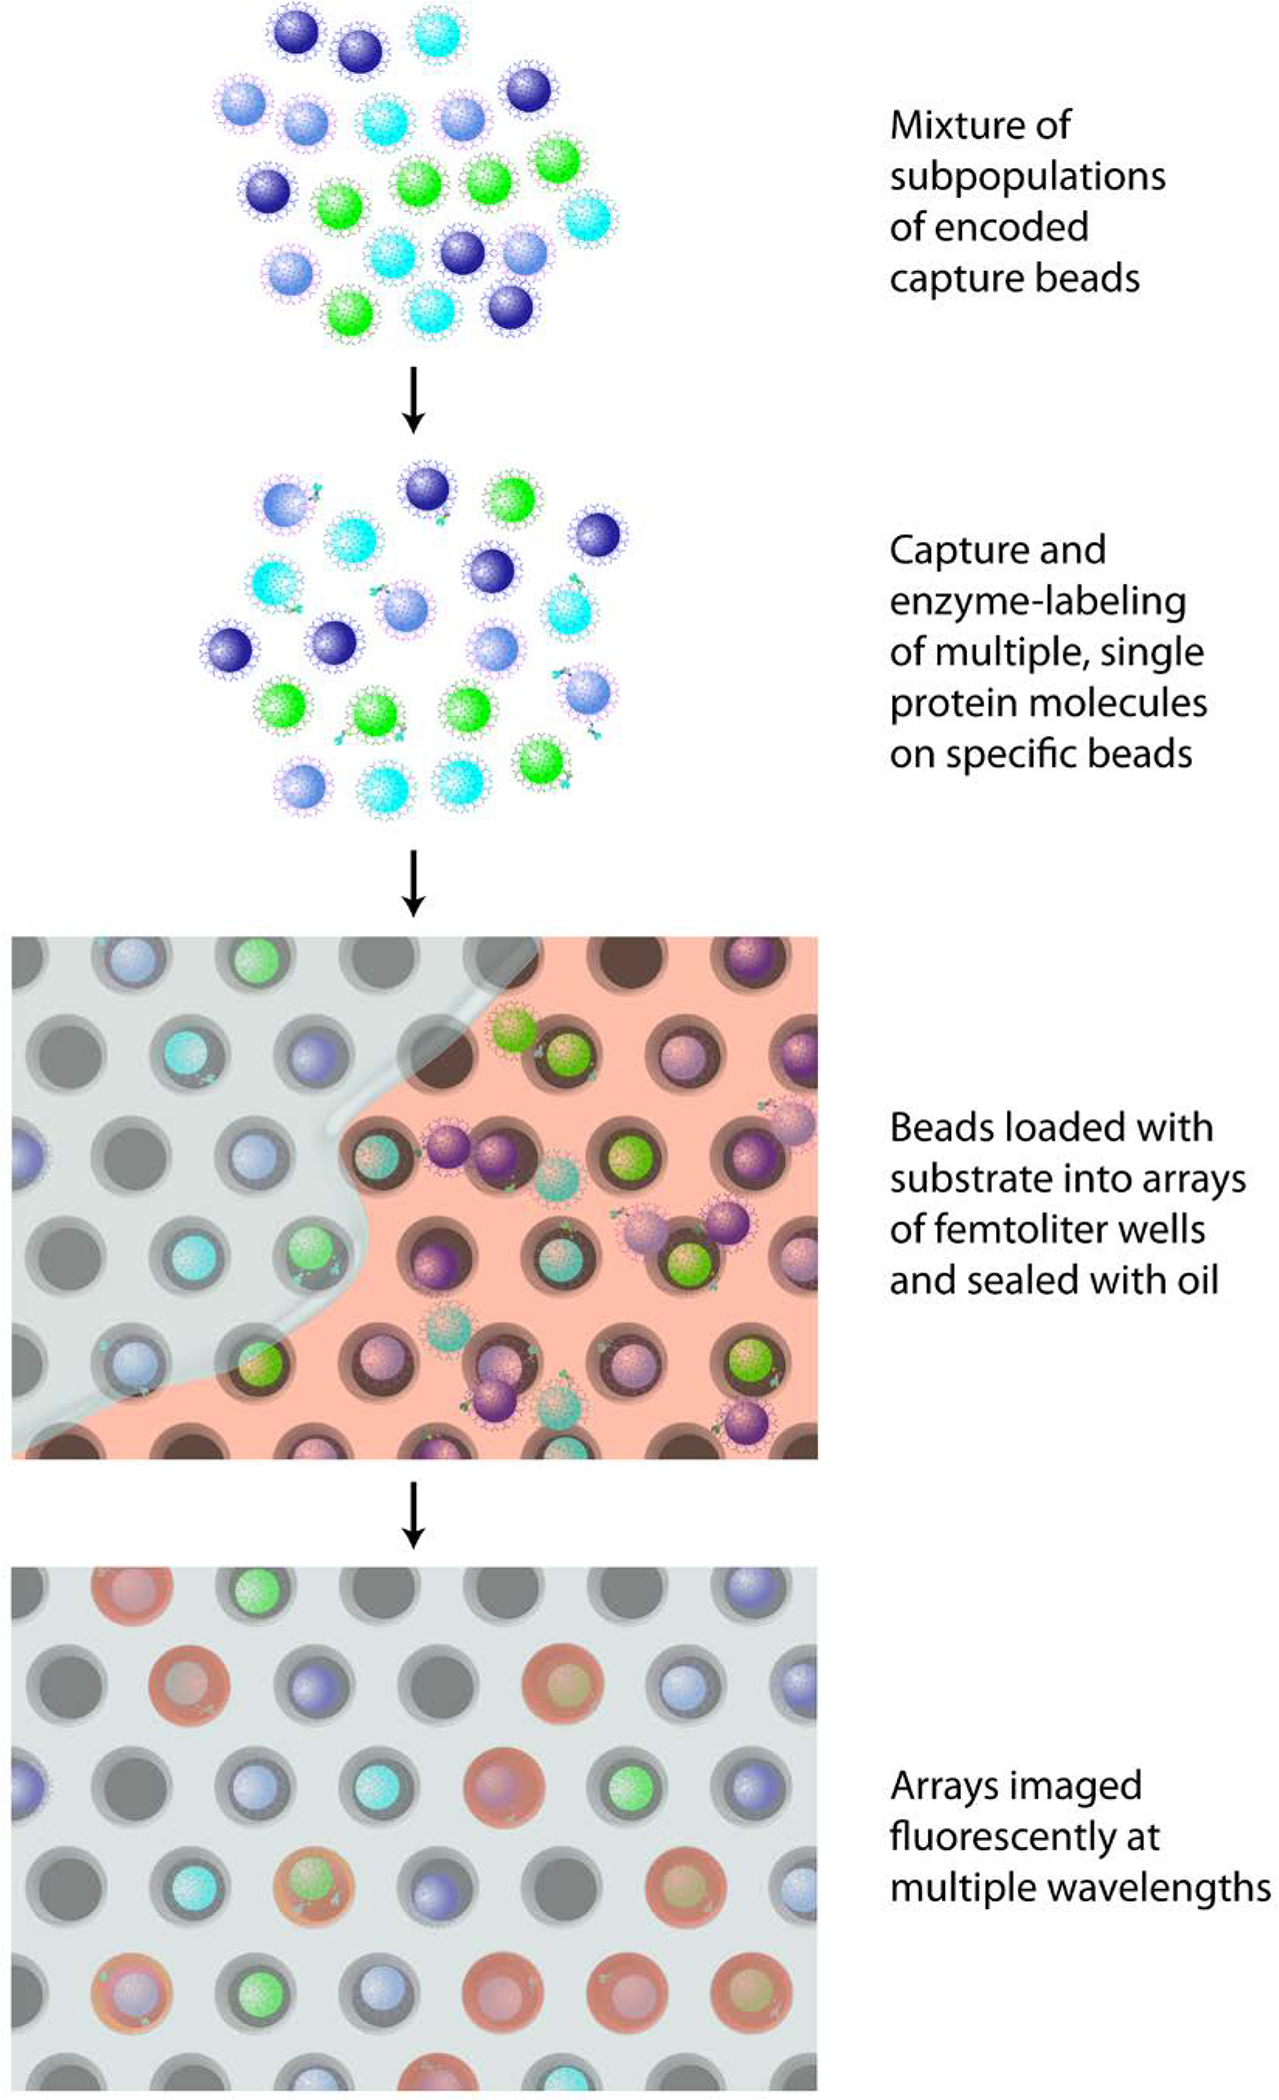
Schematic of the multiplexed digital ELISA process.
We used a customized Simoa imaging system to image ~200,000 wells in single exposures at submicron resolution at five emission wavelengths. Based on these images, it was possible to determine the location in the femtoliter well arrays of thousands of beads from each subpopulation (“decoding”), and whether or not these beads were associated with enzyme activity. At femtomolar concentrations of proteins, the number of target molecules in a sample is smaller than the number of beads in a subpopulation, so the key measurement is the fraction of active, enzyme-associated (“on”) beads or fon.11 In multiplex digital ELISA, we use the combination of spatial separation of beads and bead encoding to determine fon independently for each protein, and then convert that to average enzymes per bead (AEB) via Poisson statistics.11 At values of fon less than about 0.7, Poisson statistics indicate that the majority of active beads are associated with a single enzyme, giving multiplexed digital ELISA its single molecule sensitivity. At higher concentrations, where essentially every bead is associated with at least one enzyme, we determined AEB from the average fluorescence intensity of all of the beads imaged for each subpopulation.11 To determine the concentrations of multiple proteins in an unknown sample, we generated calibration curves of AEB against known concentrations of protein mixtures, and then interpolated concentrations from measured AEB values of unknowns.
The first challenge for multiplexing digital ELISA was the potential for interference of the single enzyme signal by bead fluorescence. Single enzymes are detected by measuring fluorescence emitted from resorufin at 615±22 nm, and it was imperative that fluorescence from beads at this wavelength was low because the amount of resorufin produced from a single enzyme molecule is relatively small. Methods for fluorescently labeling beads via encapsulation or attachment of specific dye-labeled molecules that enable their encoding and decoding are well established.13,14 The amount of fluorescent dye encapsulated in commercial beads, however, is extremely high, resulting in unacceptably high fluorescent signal in the resorufin emission band, so that single molecules could not be detected. We had, therefore, to develop a method to label beads with multiple levels of individual dyes without interfering with detection of single enzymes. To encode beads with specific dyes and intensity levels, we first covalently attached dye molecules to carboxyl beads, hydrolyzed the unreacted activated carboxyl groups, and then covalently attached capture antibodies via regenerated carboxyl groups. We demonstrated that this approach had no adverse effect on assay performance when compared to beads coupled with antibody only (Supplementary Fig. 1). Alexa Fluor® 488 hydrazide (AF-488), cyanine 5 hydrazide (cy5), and Hilyte Fluor® 750 hydrazide (HF-750) dyes were used to encode bead types for multiplexed digital ELISA. By precisely controlling the ratio of encoding dye molecules to beads, discrete encoding levels for each dye were prepared, yielding subpopulations of beads that can be distinguished on the Simoa imager. Fig. 2 shows histograms of the fluorescence of four bead subpopulations used here: single levels of AF-488 and HF-750, and two levels of cy5. Automated software was used to identify bead subpopulations from these histograms as described in the Methods section. The fluorescence from these four bead populations did not significantly change the signals in the resorufin channel, allowing the detection of single enzyme molecules (Supplementary Table 1).
Figure 2.
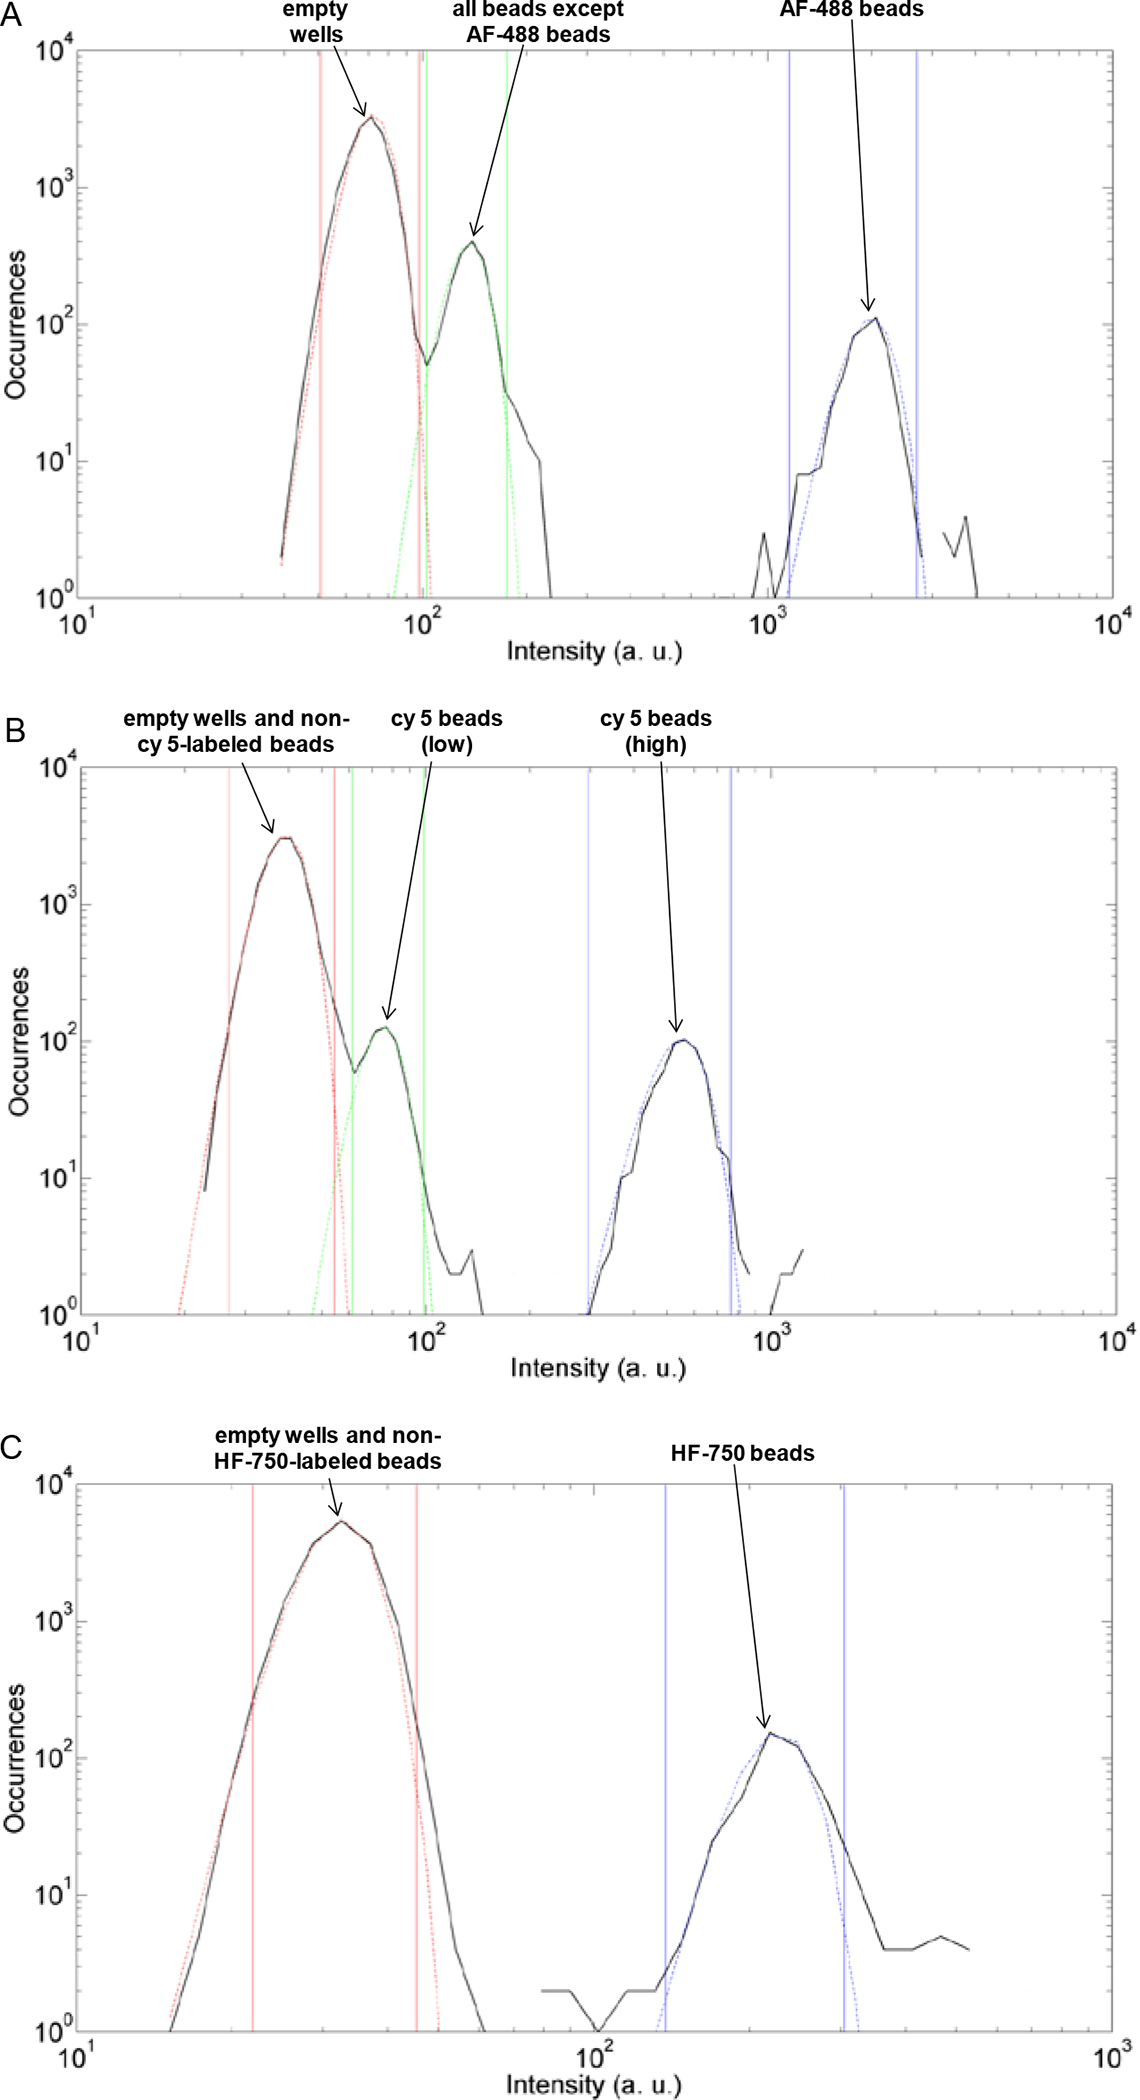
Histograms of fluorescence intensity from a sub-region of images of a representative array acquired at excitation/emission wavelengths of: A) 490 nm/530 nm; B) 622 nm/667 nm; and, C) 740 nm/800 nm. The black lines are experimental data; the colored dotted lines are Gaussian fits to these data to identify subpopulations. The vertical solid colored lines are the upper and lower limits for each population identified. For each image, the first peak corresponds to empty wells or wells containing beads not fluorescent in that channel. In image A, the second peak corresponds to beads that are not labeled with AF-488; the third peak corresponds to beads labeled with AF-488. In B, the second peak corresponds to the low level of cy5 labeled beads, and the third peak to the second, higher level of cy5-labeled beads. In C, the second peak corresponds to HF-750-labeled beads.
The second challenge was to make sure that interactions between the bead subpopulations did not result in false positive Simoa signals. A false positive is defined as counting of a single enzyme associated with the bead intended to capture a specific protein that does not originate from capture and labeling of that particular protein. We have shown previously that digital ELISA measurements of single proteins have false positive signals from the interaction of detection antibodies and enzyme with the capture beads in the absence of target protein molecules. In single-plex these false positives result in a consistent background that provides a useful noise floor for Simoa.2 In multiplexed digital ELISA, false positives are more problematic because any interaction between bead subpopulations of a high abundance protein and a low abundance protein can greatly increase the number of positive beads counted for the latter. Two sources of false positives are of particular concern: optical cross-talk and cross-reactivity of reagents.
Optical cross-talk occurs when signal from one well optically scatters into its neighboring wells (Fig. 3). Optical scatter of fluorescence from resorufin produced by many enzyme labels on a bead into a neighboring well containing a bead with no enzyme label could result in the “off” bead actually appear as if it is associated with an enzyme, and be incorrectly identified as “on”. As a result, the AEB value for that protein would be falsely elevated.15 Analysis of images of high AEB bead subpopulations (and bright encoded beads) indicated that crosstalk was on the order of ≤1−2%, meaning that the likelihood of false positive signals from a low abundance analyte (AEB ≈ 0.01) increases if its beads are adjacent to those of an analyte at much higher concentrations (AEB > 1) (Fig. 3 and Supplementary Table 2). To reduce the impact of optical scatter, we developed a computational method for its active correction of each array based on analysis of the average scatter of encoded beads that have no neighboring beads. First, a “crosstalk-free” baseline was determined from the mean of the resorufin signal growth of non-beaded wells having only non-beaded neighbors. Second, the fraction of fluorescence crosstalk was determined from the average signal growth above baseline of non-beaded wells adjacent to only one positive, beaded neighboring well in each of the 6 nearest neighbor directions. Third, the signals of each beaded well was corrected by subtracting the weighted, directional mean of crosstalk based on the intensity of each of the beaded nearest neighbors. This correction allowed for the reduction of false positive calls when both high and low abundance proteins were present (Supplementary Table 2).
Figure 3.
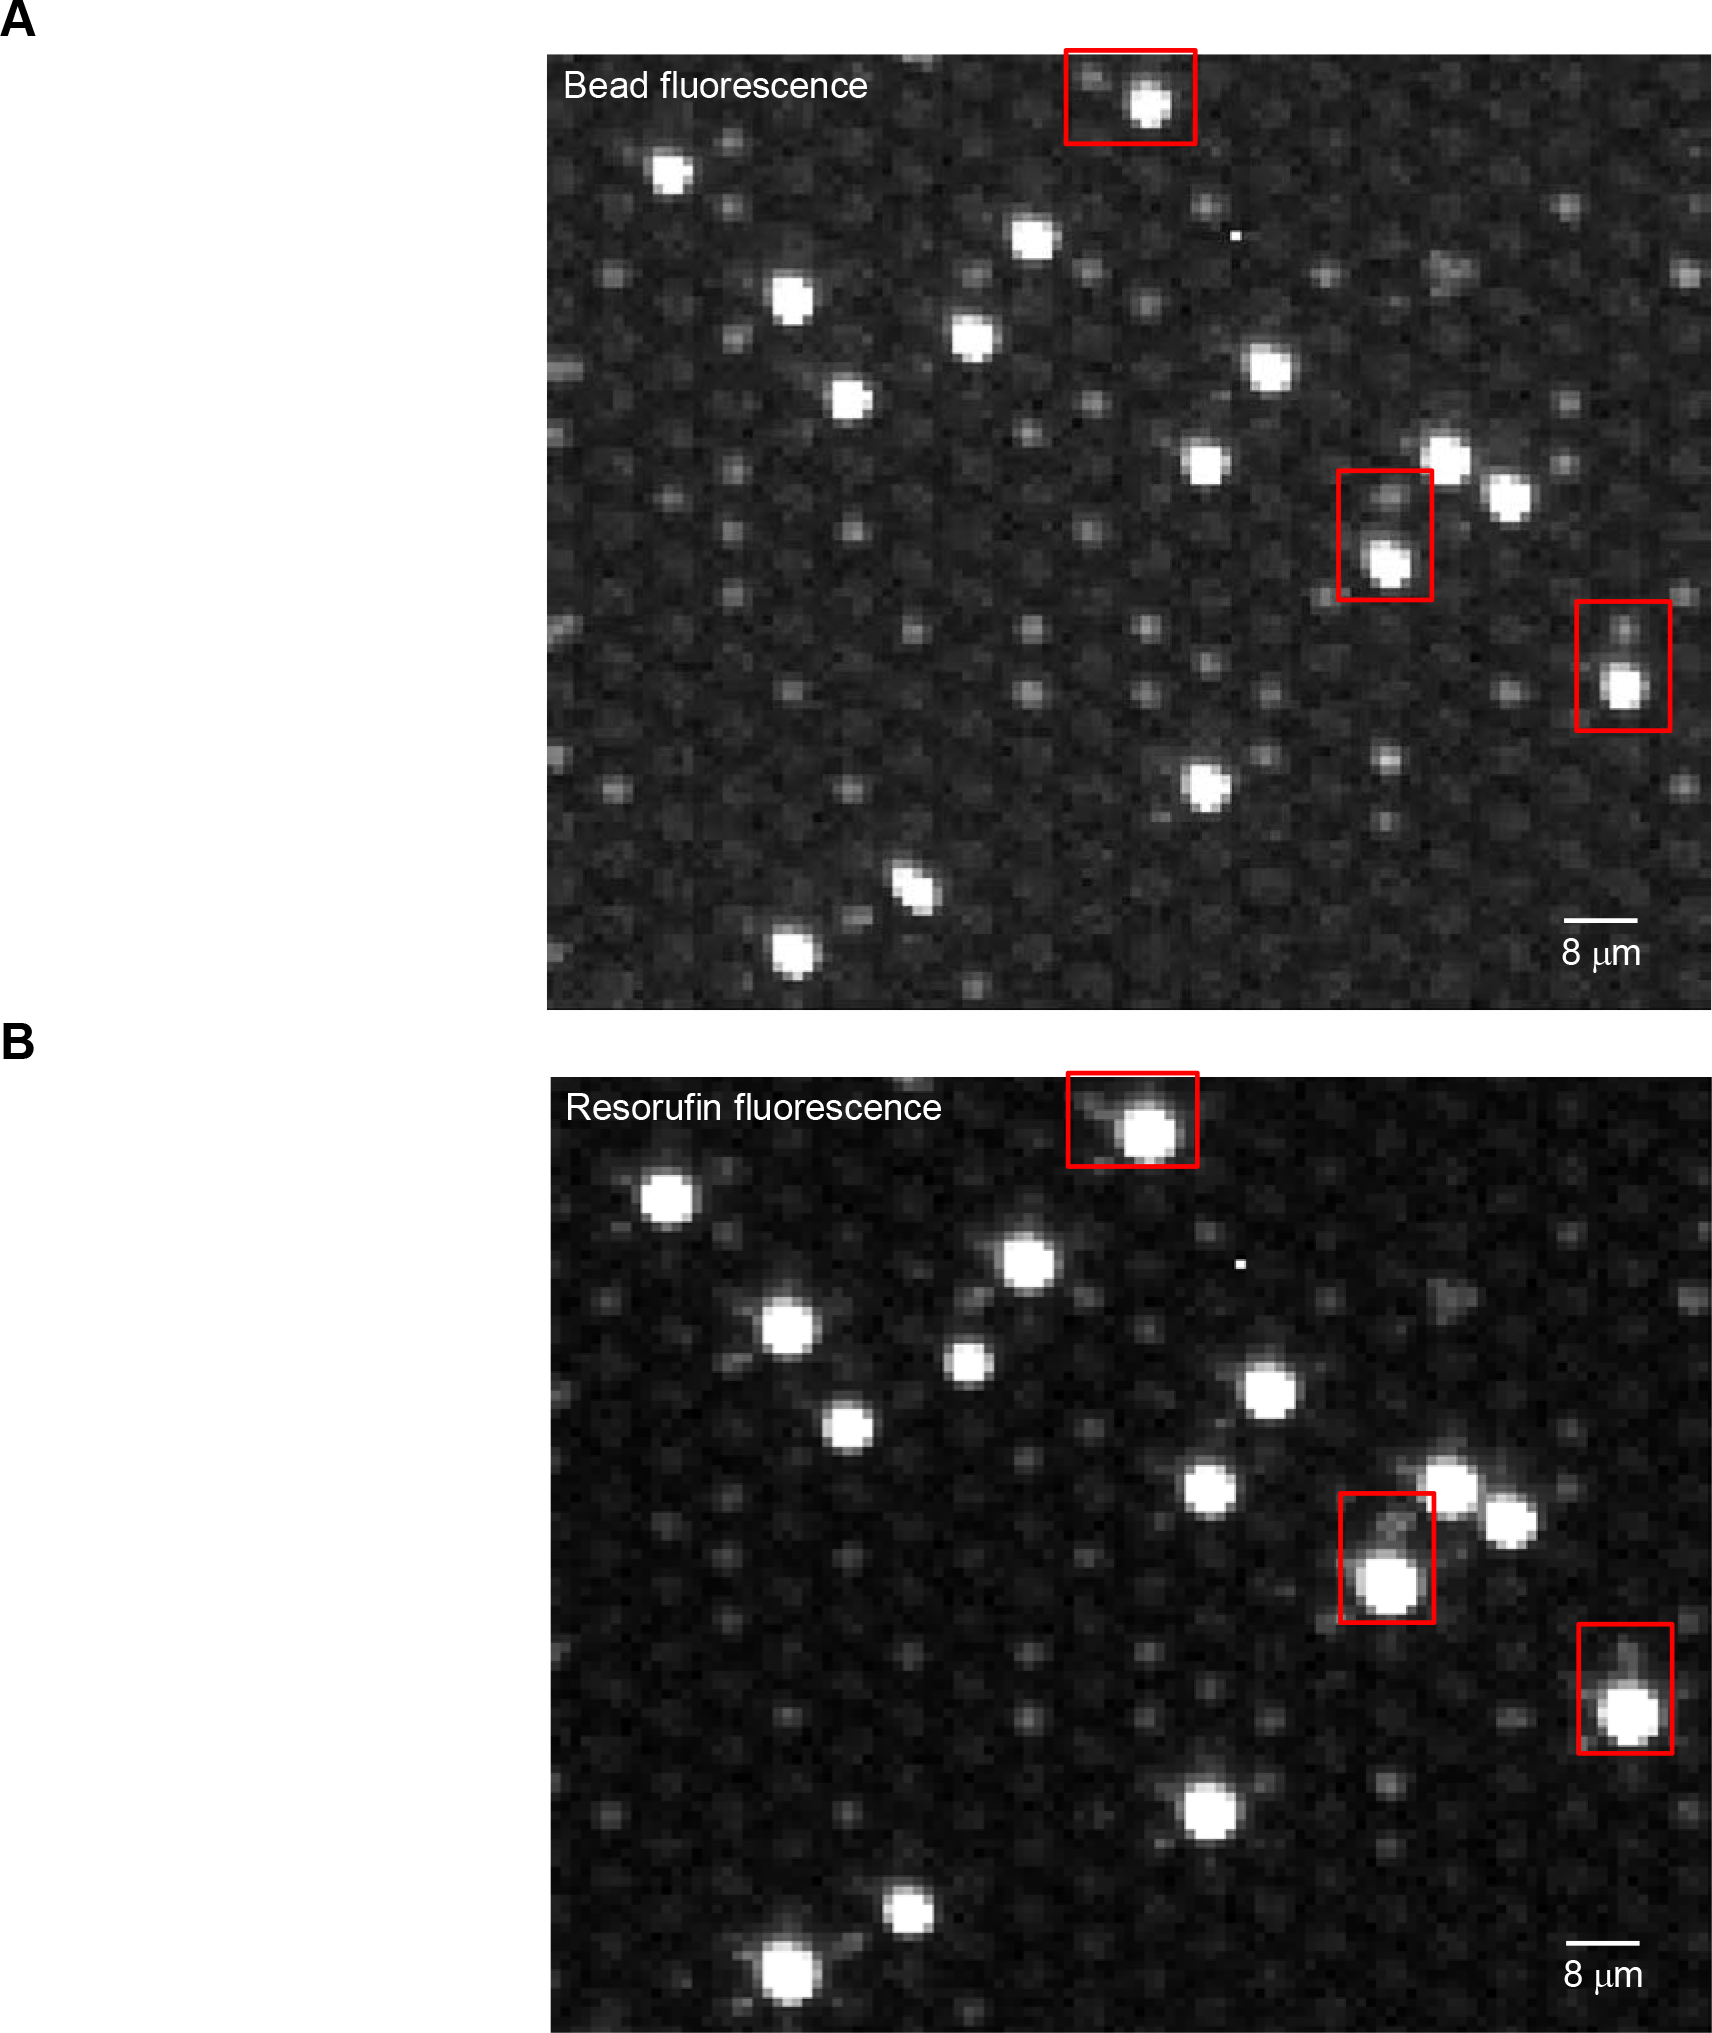
Images showing optical scatter that can lead to false positive “on” beads. In this experiment, IL-6 beads labeled with AF-488, and TNF-α, IL-1α, and IL-1β beads that were not labeled with AF-488, were incubated with a high concentration of IL-6 (100 pg/mL) but no other cytokines. Portions are shown of the Simoa images at: A) 490 nm/530 nm ex/em to identify beads; and B) at 574 nm/615 nm ex/em to detect enzyme activity. The bright beads in A correspond to the IL-6 beads; the dim beads correspond to the other cytokines. The red boxes show situations where IL-6 beads associated a high number of enzymes (AEB = 8) were imaged alongside beads not associated with an enzyme. The image in B shows that optical scatter from the high AEB beads can scatter into the wells containing “off” beads. The contrasts in these images were adjusted so the eye can see the optical scatter (~1–2%) that occurs: the scaling was set to 6% of the total dynamic range of the camera (black point = 241; white point = 1,228; maximum camera signal = 16,383).
Cross-reactivity of immunological reagents is a source of false positive signals in immunoassays in general. If the antibodies used to detect protein “A” also bound another protein “B” in the multiplex with sufficient affinity that protein “B” was captured and measured on protein “A” beads at similar concentrations, then the specificity and dynamic range of the multiplex would be poor, limiting its usefulness. Our goal was to minimize false positive signals from cross-reactivity between the reagents used to detect each cytokine in the multiplex. To this end, for each new protein added to a multiplex, we performed “drop out” experiments to demonstrate that the protein or antibody reagents did not cause false positive signals in the single-plex assay of the new protein or in the existing multiplex assay, as described in Supplementary Text and Supplementary Figure 2.
After minimizing the occurrence of false positives, we developed a multiplex digital ELISA based on the approach in Figure 1 for simultaneously measuring the concentrations of 4 cytokines (TNF-α, IL-6, IL-1α, and IL-1β) in plasma. Details of the preparation of reagents, the assay steps used to form immunocomplexes, Simoa imaging, and image analysis used to decode each bead and to determine AEB values for the 4 cytokines are provided in the Methods. Figure 4 shows representative images of the different wavelengths imaged.
Figure 4.
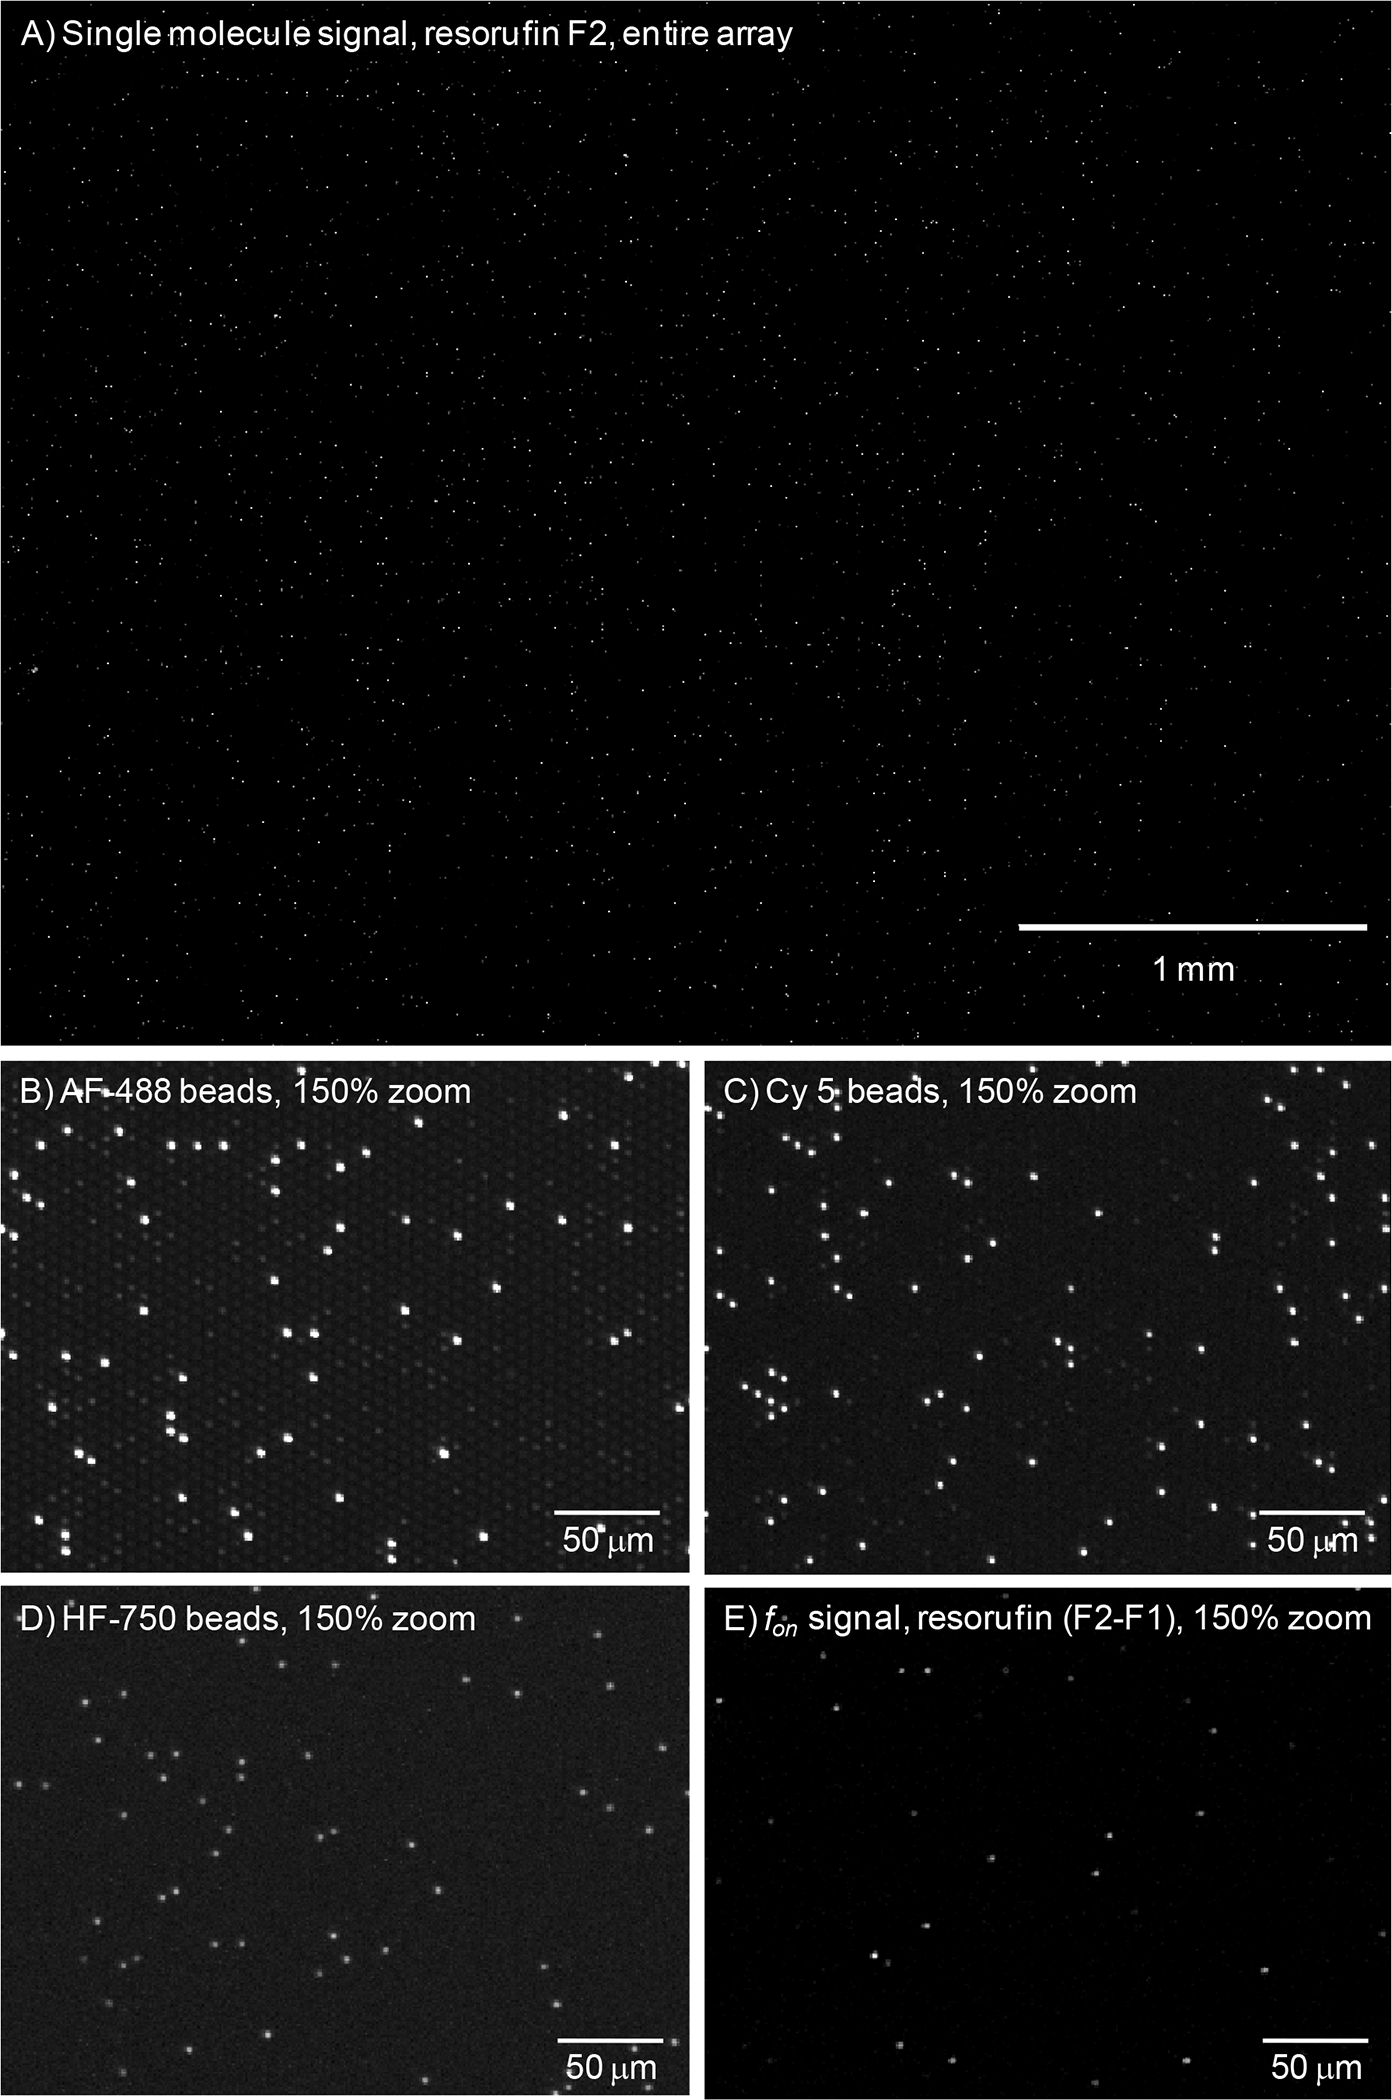
Representative images of an array from multiplexed digital ELISA at: A) & E) 574/615 nm ex/em; B) 490/530 nm ex/em; C) 622/667 nm ex/em; D) 740/800 nm ex/em.
To evaluate the sensitivity and specificity of this 4-plex digital ELISA, we determined AEB values for samples in which: a) all four proteins were spiked into bovine serum (our calibration matrix) from femtomolar up to picomolar concentrations; and b) each individual protein was spiked into bovine serum separately. The first samples indicate the ability to measure 4 proteins simultaneously at femtomolar concentrations (sensitivity); the second set of samples would indicate the occurrence of false positives in the 3 non-spiked proteins (specificity) and sensitivity. Figure 5 and Supplementary Figure 3 show plots of AEB against concentrations of 4 cytokines from these samples; Supplementary Table 3 provides the AEB values for each sample. The limits of detection (LODs) determined by interpolating the concentration at 3 s.d. of the background above background were 21 & 69 fg/mL (1.2 & 3.9 fM), 3 & 24 fg/mL (0.15 & 1.2 fM), 5 & 27 fg/mL (0.3 & 1.5 fM), and 43 & 32 fg/mL (2.5 & 1.9 fM), for TNF-α, IL-6, IL-1α, and IL-1β, respectively, in these two spiking experiments. These LODs are comparable to our previously reported values for non-encoded, single-plex digital ELISAs for TNF-α (11 fg/mL) and IL-6 (10 fg/mL),9 and encoded, single-plex digital ELISAs for all 4 cytokines given differences in the CV of backgrounds for particular experiments (Table 1). We did not observe significant increases in backgrounds from false positive in the 3 subpopulations of beads that did not have protein spiked into the sample, up to 10 pg/mL of the spiked protein. At 100 pg/mL spiked proteins, most of the backgrounds were not elevated, although we did observe slight increases in signals from TNF-α beads spiked with 100 pg/mL of IL-1α and IL-1β (Supplementary Fig.3 and Supplementary Table 3). These data indicate that multiplexed digital ELISA can provide similar sensitivity, specificity, and dynamic range as the single-plex approach.
Figure 5.
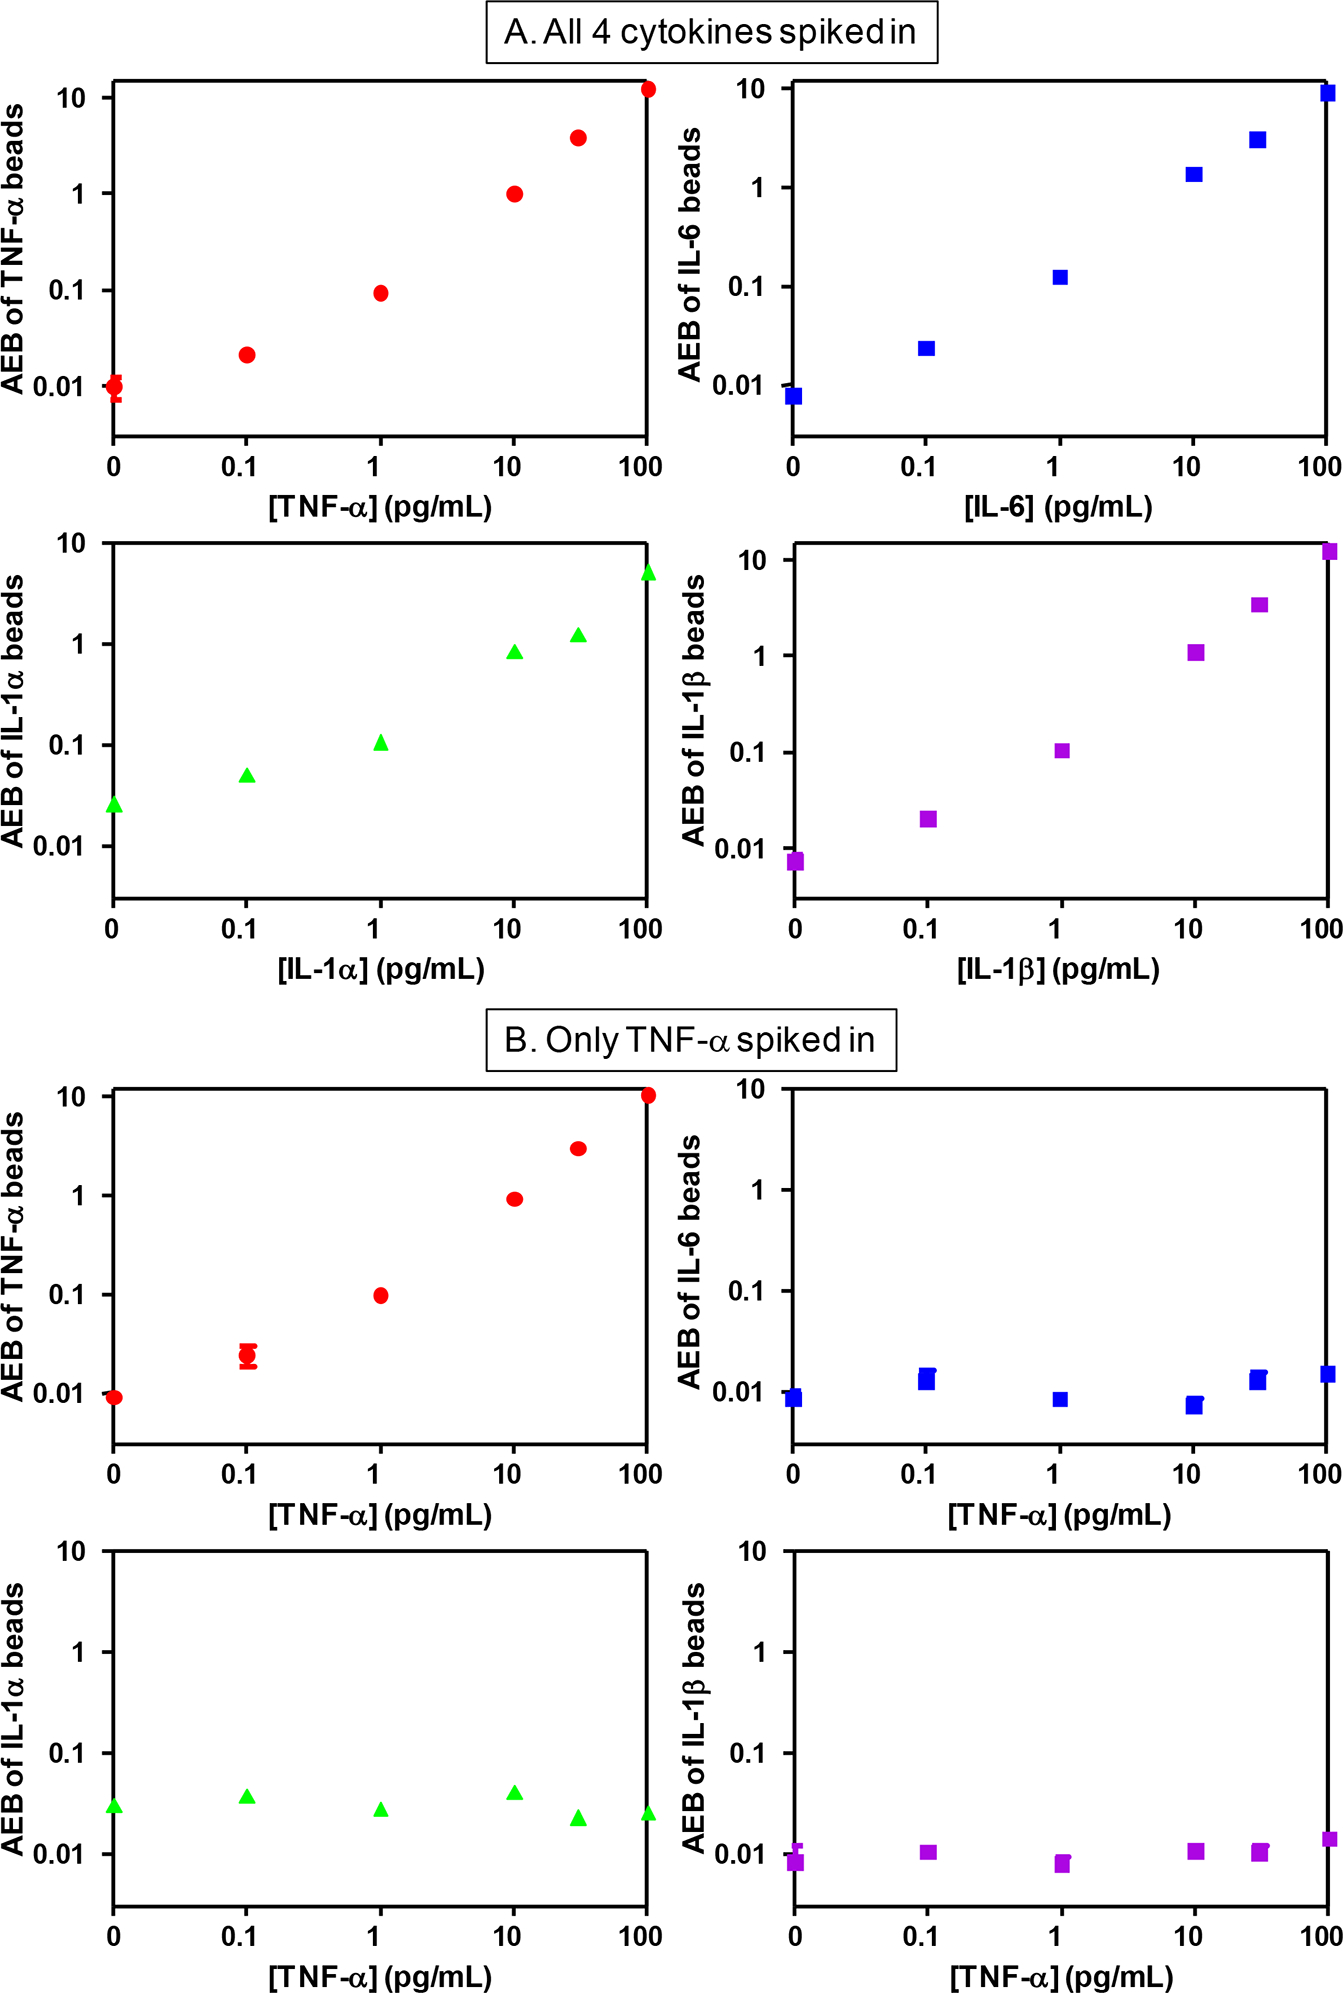
Plots of AEB against protein concentration for 4 beads specific to 4 cytokines measured in bovine serum samples spiked with: A) all 4 cytokines; and B) only TNF-α. The plots for samples spiked with only IL-6, only IL-1α, and only IL-1β are shown in Supplementary Fig. 3.
Table 1.
Limits of detection of 4 cytokines measured in multiplex and single-plex digital ELISA. The CV of the background is given in each case, as that is an important parameter for determining LOD.
| Cytokine | LOD (fg/mL) | LOD (fM) | CV of background* | Source |
|---|---|---|---|---|
|
| ||||
| TNF-α | 69 | 3.9 | 27% | Multiplex; this work; all 4 cytokines spiked in |
| 21 | 1.2 | 12% | Multiplex; this work; only TNF-α spiked in | |
| 11 | 0.6 | 6% | Single-plex; this work, encoded beads | |
| 11 | 0.6 | 12% | Single-plex; Song et al.,9 non-encoded beads | |
| IL-6 | 24 | 1.2 | 16% | Multiplex; this work; all 4 cytokines spiked in |
| 3 | 0.15 | 1% | Multiplex; this work; only IL-6 spiked in | |
| 4 | 0.2 | 9% | Single-plex; this work, encoded beads | |
| 10 | 0.5 | 8% | Single-plex; Song et al.,9 non-encoded beads | |
| IL-1α | 27 | 1.5 | 8% | Multiplex; this work; all 4 cytokines spiked in |
| 5 | 0.3 | 2% | Multiplex; this work; only IL-1α spiked in | |
| 24 | 1.3 | 12% | Single-plex, this work, encoded beads | |
| IL-1β | 32 | 1.9 | 19% | Multiplex; this work; all 4 cytokines spiked in |
| 43 | 2.5 | 19% | Multiplex; this work; only IL-1β spiked in | |
| 12 | 0.7 | 10% | Single-plex, this work, encoded beads | |
LODs were determined using a 3 s.d. method, including those calculated from data in ref. (9).
We used this assay to simultaneously measure the concentrations of the 4 cytokines in plasma from 15 healthy humans (Table 2). The concentrations of TNF-α, IL-6, IL-1α, and IL-1β were in the range (mean ± s.d) 3.8−8.5 (5.4±1.2), 1.4−16.0 (4.1±3.6), 0.33−1.62 (0.87±0.41), and 0.65−12.1 (4.8±3.5) pg/mL, respectively. All cytokines were detected in all samples, except two samples in which IL-1α was not detected. The mean concentration of IL-6 was close to that we previously measured in plasma using single-plex digital ELISA (3 pg/mL);9 the concentration of TNF-α, was higher than previously (3 pg/mL), perhaps because of differences in collection method of plasma. All 4 cytokines were in the low- or sub-pg/mL range. Analog multiplex immunoassays typically have LOD greater than 5 pg/mL,3 so many of the cytokines would have been undetected or, for those that would have been detected, the imprecision would have been high.
Table 2.
Concentrations of 4 cytokines measured in the plasma of 15 healthy human donors using multiplex digital ELISA. Concentrations are given as the mean and standard deviation of three replicates.
| Sample ID | [TNF-α] (pg/mL) | [IL-6] (pg/mL) | [IL-1α] (pg/mL) | [IL-1β] (pg/mL) |
|---|---|---|---|---|
|
| ||||
| 1 | 8.45±1.11 | 5.02±0.61 | 0.96±0.37 | 8.84±1.02 |
| 2 | 5.32±0.39 | 4.99±0.45 | 0.91±0.21 | 1.51±0.13 |
| 3 | 5.32±1.56 | 3.68±0.88 | 0.67±0.11 | 2.99±0.58 |
| 4 | 6.16±1.51 | 1.68±0.27 | 0.33±0.14 | 2.82±0.56 |
| 5 | 5.73±1.18 | 4.48±0.30 | 0.33±0.24 | 6.51±1.32 |
| 6 | 6.95±1.89 | 4.89±1.06 | 0.62±0.36 | 1.96±0.43 |
| 7 | 5.89±1.36 | 2.92±0.68 | not detected | 6.32±1.49 |
| 8 | 3.79±0.41 | 1.74±0.31 | 0.52±0.23 | 1.06±0.17 |
| 9 | 4.43±0.64 | 16.0±3.4 | not detected | 0.65±0.06 |
| 10 | 3.78±0.96 | 1.56±0.36 | 1.50±0.38 | 8.09±2.04 |
| 11 | 4.07±0.82 | 1.37±0.13 | 1.16±0.34 | 4.55±0.94 |
| 12 | 5.85±0.20 | 3.61±0.41 | 1.62±0.26 | 12.1±0.8 |
| 13 | 4.73±0.24 | 2.66±0.37 | 0.84±0.36 | 2.41±0.13 |
| 14 | 5.43±0.51 | 4.97±0.59 | 1.17±0.40 | 2.79±0.34 |
| 15 | 4.92±0.46 | 2.02±0.16 | 0.67±0.20 | 8.86±0.49 |
This work has provided an initial demonstration of multiplexing 4 proteins using digital ELISA. Three main factors limit the number of proteins that can be combined in a multiplexed digital ELISA. First, the number of wells that can be imaged (about 200,000) using a low-cost camera provides a limit on the plex. To minimize Poisson noise, we require several thousand beads per protein to be imaged,2 so, with a maximum bead loading efficiency of ~50%,12 increasing the number of proteins beyond 10 would result in reduced precision from Poisson noise. Second, antibody cross-reactivity places a limit on the plex; our experience so far indicates that above 10 cytokines, it is challenging to find antibodies that “play nicely together” and do not result in false positive signals from cross-reactivity. Third, we are currently limited to about 12 bead types that can be decoded on the optical system using multiple levels of 4 dyes. We believe, therefore, that the sweet spot for this technique will be to multiplex 10 or fewer proteins.
Conclusions
We have demonstrated that it is possible to measure multiple proteins simultaneously at the single molecule level using Simoa. The ability to reliably detect and quantify low concentrations of multiple proteins in clinical samples could have a major impact on the ability to assess the status of complex pathways in biological samples in one experiment. For example, multiplex detection of cytokine status in chronic inflammatory diseases, such as Crohn’s disease, could lead to a better understanding of the molecular basis of disease, and facilitate the development improved diagnostics and therapeutics. Multivariate tests are becoming increasingly important to diagnose complex diseases, e.g., the Oncotype DX® breast cancer test (Genomic Health).16 These tests are usually based on measuring multiple nucleic acids using PCR, so methods like multiplexed digital ELISA would greatly expand the capability of these tests by measuring multiple proteins. We believe that multiplexed digital ELISA could greatly improve the quantitative understanding of complex biological phenomena in inflammatory diseases, cancer, infectious diseases, and neurology.
Supplementary Material
Acknowledgements
This project was supported by Award Number R43CA133987 from the National Cancer Institute. We thank William McGuigan, Gary Watson, William Gigante, and Les Walling of Stratec Biomedical for developing the load, seal, and image system. We thank Kurt Tolksdorf and Benjamin English for assistance developing image analysis algorithms. We thank Anne Tsimboukis (atsimboukis@aol.com) for rendering Figure 1.
References
- 1.Kingsmore SF Multiplexed protein measurement: technologies and applications of protein and antibody arrays, Nat. Rev. Drug Discov. 2006, 5, 310–20. [DOI] [PMC free article] [PubMed] [Google Scholar]
- 2.Rissin DM; Kan CW; Campbell TG; Howes SC; Fournier DR; Song L; Piech T; Patel PP; Chang L; Rivnak AJ; Ferrell EP; Randall JD; Provuncher GK; Walt DR; Duffy DC Single-molecule enzyme-linked immunosorbent assay detects serum proteins at subfemtomolar concentrations, Nat. Biotechnol. 2010, 28, 595–599. [DOI] [PMC free article] [PubMed] [Google Scholar]
- 3.Chowdhury F; Williams A; Johnson P Validation and comparison of two multiplex technologies, Luminex and Mesoscale Discovery, for human cytokine profiling, J. Immunol. Methods 2009, 340, 55–64. [DOI] [PubMed] [Google Scholar]
- 4.Hsu HY; Joos TO; Koga H Multiplex microsphere-based flow cytometric platforms for protein analysis and their application in clinical proteomics - from assays to results, Electrophoresis 2009, 30, 4008–19. [DOI] [PubMed] [Google Scholar]
- 5.Arellano Garcia M; Hu S; Wang J; Henson B; Zhou H; Chia D; Wong D Multiplexed immunobead-based assay for detection of oral cancer protein biomarkers in saliva, Oral diseases 2008, 14, 705. [DOI] [PMC free article] [PubMed] [Google Scholar]
- 6.Croft H; Malinowski T; Krizbai L; Mikec I; Kajic V; Reed C; Varga A; James D Use of Luminex xMAP-derived Bio-Plex bead-based suspension array for specific detection of PPV W and characterization of epitopes on the coat protein of the virus, J. Virol. Methods 2008, 153, 203. [DOI] [PubMed] [Google Scholar]
- 7.Olsson A; Vanderstichele H; Andreasen N; De Meyer G; Wallin A; Holmberg B; Rosengren L; Vanmechelen E; Blennow K Simultaneous measurement of beta-amyloid(1–42), total tau, and phosphorylated tau (Thr181) in cerebrospinal fluid by the xMAP technology, Clin. Chem. 2005, 51, 336. [DOI] [PubMed] [Google Scholar]
- 8.Fichorova RN et al. Biological and technical variables affecting immunoassay recovery of cytokines from human serum and simulated vaginal fluid: a multicenter study, Anal. Chem. 2008, 80, 4741–51. [DOI] [PMC free article] [PubMed] [Google Scholar]
- 9.Song L; Hanlon DW; Chang L; Provuncher GK; Kan CW; Campbell TG; Fournier DR; Ferrell EP; Rivnak AJ; Pink BA; Minnehan KA; Patel PP; Wilson DH; Till MA; Faubion WA; Duffy DC Single molecule measurements of tumor necrosis factor α and interleukin-6 in the plasma of patients with Crohn’s disease. J. Immunol. Methods 2011, 372, 177–86. [DOI] [PubMed] [Google Scholar]
- 10.Gustot T; Lemmers A; Louis E; Nicaise C; Quertinmont E; Belaiche J; Roland S; Van Gossum A; Deviere J; Franchimont D Profile of soluble cytokine receptors in Crohn’s disease, Gut 2005, 54, 488. [DOI] [PMC free article] [PubMed] [Google Scholar]
- 11.Rissin DM, Fournier DR, Piech T, Kan CW, Campbell TG, Song L, Chang L, Rivnak AJ, Patel PP, Provuncher GK, Ferrell EP, Howes SC, Pink BA, Minnehan KA, Wilson DH, Duffy DC Simultaneous detection of single molecules and singulated ensembles of molecules enables immunoassays with broad dynamic range, Anal. Chem. 2011, 83, 2279–2285. [DOI] [PMC free article] [PubMed] [Google Scholar]
- 12.Kan CW; Rivnak AJ; Campbell TG; Piech T; Rissin DM; Mosl M; Peterca A; Niederberger H-P; Minnehan KA; Patel PP; Ferrell EP; Meyer RE; Chang L; Wilson DH; Fournier DR; Duffy DC Isolation and detection of single molecules on paramagnetic beads using sequential fluid flows in microfabricated polymer array assemblies, Lab Chip 2012, 12, 977–95. [DOI] [PubMed] [Google Scholar]
- 13.Braeckmans K; De Smedt SC; Leblans M; Pauwels R; Demeester J Encoding microcarriers: present and future technologies, Nat. Rev. Drug Discov. 2002, 6, 447–56. [DOI] [PubMed] [Google Scholar]
- 14.Ferguson JA; Steemers FJ; Walt DR Anal. Chem. 2000, 72, 5618–24. [DOI] [PubMed] [Google Scholar]
- 15.Optical crosstalk of fluorescence from the high loading of dyes on beads can also potentially result in false positive identification of low dye bead subpopulations. This phenomenon was not observed in the 4-plex developed here, but for cases with higher bead fluorescence corrections of the type described for enzyme crosstalk can be used to minimize incorrect bead classification. [Google Scholar]
- 16.Paik S; Shak S; Tang G; Kim C; Baker J; Cronin M; Baehner FL; Walker MG; Watson D; Park T; Hiller W; Fisher ER; Wickerham DL; Bryant J; Wolmark N A multigene assay to predict recurrence of tamoxifen-treated, node-negative breast cancer, N. Engl. J. Med. 2004, 351, 2817–26 [DOI] [PubMed] [Google Scholar]
Associated Data
This section collects any data citations, data availability statements, or supplementary materials included in this article.