

Abstract
Long-term pulmonary sequelae of Coronavirus 2019 (COVID-19) remain unclear. Thus, we aimed to establish post-COVID-19 temporal changes in chest computed tomography (CT) features of pulmonary fibrosis and to investigate associations with respiratory symptoms and physiological parameters at 3 and 12 months' follow-up. Adult patients who attended our initial COVID-19 follow-up service and developed chest CT features of interstitial lung disease, in addition to cases identified using British Society of Thoracic Imaging codes, were evaluated retrospectively. Clinical data were gathered on respiratory symptoms and physiological parameters at baseline, 3 months, and 12 months. Corresponding chest CT scans were reviewed by two thoracic radiologists. Associations between CT features and functional correlates were estimated using random effects logistic or linear regression adjusted for age, sex and body mass index. In total, 58 patients were assessed. No changes in reticular pattern, honeycombing, traction bronchiectasis/bronchiolectasis index or pulmonary distortion were observed. Subpleural curvilinear lines were associated with lower odds of breathlessness over time. Parenchymal bands were not associated with breathlessness or impaired lung function overall. Based on our results, we conclude that post-COVID-19 chest CT features of irreversible pulmonary fibrosis remain static over time; other features either resolve or remain unchanged. Subpleural curvilinear lines do not correlate with breathlessness. Parenchymal bands are not functionally significant. An awareness of the different potential functional implications of post-COVID-19 chest CT changes is important in the assessment of patients who present with multi-systemic sequelae of COVID-19 infection.
KEYWORDS: COVID-19, CT, pulmonary fibrosis, respiratory symptoms, lung function tests
Background
Coronavirus 2019 (COVID-19), caused by severe acute respiratory syndrome coronavirus 2 (SARS-CoV-2), results in a spectrum of disease.1 Although there are several recognised complications in the short to medium term following initial diagnosis,2–4 long-term implications of post-COVID-19 pulmonary radiological abnormalities remain unclear. The acute phase of COVID-19 presents with ground glass opacification (GGO) with lower lobe predominance on chest computed tomography (CT), before progressing to more focal consolidation.5 In some cases, it advances to fibrosis, with radiological findings of reticular pattern (RP), traction bronchiectasis and parenchymal bands.6 The most common chest CT abnormalities at 12 months include GGO, fibrotic-like changes, bronchiectasis, interlobular septal thickening, reticular opacity and consolidation.7 Older age, male sex, length of hospitalisation and non-invasive mechanical ventilation are associated with persistent radiological abnormalities.8–10 Radiological volume of disease during hospitalisation can be a predictor of persistent disease burden.8,11 However, a proportion of radiological changes seen at 6 months resolve by 12 months.12
Understanding how chest CT features evolve and correlate with respiratory symptoms or physiological parameters can facilitate the prediction of long-term respiratory impairment. Biomarkers, including C-reactive protein (CRP), have shown correlation with CT abnormalities.13 Persisting dyspnoea is seen with higher rates of RP.6 Reduction in carbon monoxide diffusing capacity is associated with persisting radiological abnormalities over 12 months.14
Our study aimed to establish temporal changes in specific CT features of pulmonary fibrosis post COVID-19 and to investigate associations with respiratory symptoms and lung function test results at 3 and 12 months' follow-up.
Methods
We have previously described the results of the radiological investigations and lung function tests that were performed at 6 and 12 weeks' follow-up in the initial COVID-19 follow-up clinic at our multi-centre institution in London, UK, between April and October 2020.15 This earlier analysis was conducted to evaluate the COVID-19 follow-up service to understand utilisation of diagnostic services and outcomes of referral pathways in anticipation of subsequent waves of COVID-19 in the UK. In the present study, we conducted a retrospective review of the clinical records of those patients who attended that initial COVID-19 follow-up clinic who were also identified as having CT features consistent with interstitial lung disease (ILD) 0–12 months after COVID-19 diagnosis. Additional patients who had not attended the initial follow-up clinic but who had radiological evidence of post-COVID-19 ILD over the same time period were identified from radiological reports using British Society of Thoracic Imaging (BSTI) codes.16 Further details are provided in supplementary material S1.
Clinical data
Data were extracted from the time of initial COVID-19 presentation (baseline) and clinic visits at 3 and 12 months. Patient characteristics included age, sex, body mass index (BMI), smoking history, ethnicity, comorbidities, maximal respiratory support requirements, length of hospitalisation and SARS-CoV-2 PCR result. Clinical measurements included: respiratory symptoms (breathlessness, cough and chest pain) as documented in clinical records at baseline, 3 months and 12 months; exercise test results (from 1-min sit-to-stand or 6-min walk tests, including modified Borg dyspnoea scale score) at 3 months; lung function test results (forced expiratory volume in 1 s (FEV1), forced vital capacity (FVC), FEV1/FVC ratio, total lung capacity (TLC) and transfer factor for carbon monoxide (DLCO)) at 3 months and 12 months; and blood test results (lymphocytes, CRP, D-dimer, ferritin, troponin, brain natriuretic peptide, creatinine and urea) at baseline, 3 months and 12 months. Percentage predicted lung function test values were derived from European Community for Coal and Steel reference equations (1993) as per local policy. Desaturation on exercise testing was defined as ≥4% post-exertional decrease in oxygen saturation (SpO2) compared with resting or baseline saturation.
Assessment of CT features
Unenhanced helical volumetric acquisition with high-resolution reconstructions were obtained. CT scans were reviewed independently by two thoracic radiologists (with 24 and 10 years' experience, respectively) who were blinded to clinical and functional data. Images were reviewed on window widths and level settings appropriate for the lung parenchyma (centre −500 Hounsfield units (HU), width −1500 HU). For each lobe, extent of consolidation, GGO, RP, honeycombing and crazing paving pattern (CP) were scored to the nearest 5% based on previously published CT scoring systems.17,18 Distribution of CT features were recorded as widespread, central, peripheral, perilobular or random. The traction bronchiectasis/bronchiolectasis index (TBI) was scored between 0 and 3. Pulmonary distortion, parenchymal bands (linear bands contacting the pleural surface) and subpleural curvilinear lines (linear bands parallel to the pleural surface) were recorded as either present or absent. Consensus scoring is described in supplementary material S1.
Statistical analysis
Patient demographic, clinical and radiological characteristics were summarised as frequencies (%) and median (interquartile range (IQR)). Values were compared across baseline and follow-up timepoints (alpha=0.05) using Chi-squared test (or Fisher's exact test if any cell frequency ≤5) for categorical variables and Kruskal–Wallis or two-sample Wilcoxon rank-sum (Mann–Whitney U) test for continuous variables. Associations between CT features and presence/absence of symptoms or measures of lung function were estimated using random effects logistic or linear regression, respectively, with robust standard errors grouped by patient over the three timepoints. Associations with exercise test results at 3 months were estimated using logistic regression for desaturation versus no desaturation and linear regression for change in modified Borg dyspnoea score and SpO2. All models were adjusted for age, sex and BMI. Whole-lung quantification of CT features is described in supplementary material S1. Interobserver agreement was estimated as Lin's concordance correlation coefficient for consolidation, GGO, RP, honeycombing, CP and TBI; and as Cohen/Conger's Kappa (ordinal weighted) for pulmonary distortion, parenchymal bands, subpleural curvilinear lines and lobar distribution of CT features.
Ethics
The study received approval from the NHS Health Research Authority and the South West − Cornwall & Plymouth Research Ethics Committee (reference 21/SW/0138).
Results
Patients' characteristics
Fifty patients were identified from the COVID-19 follow-up service and eight from BSTI imaging codes. Hence, 58 patients, with a median age of 58 years (IQR 52–58), were assessed (Table 1). Twenty-two (37.9%) were female. Forty-seven of 55 patients tested (85.5%) had a positive SARS-CoV-2 PCR result at presentation. The remainder had a clinicoradiological diagnosis of COVID-19. Common comorbidities were hypertension (31/58, 53.4%), obesity (30/58, 51.7%), diabetes mellitus (23/58, 39.7%), asthma (6/58, 10.3%) and chronic kidney disease (6/58, 10.3%). Three patients (5.2%) had obstructive sleep apnoea. Thirty (51.7%) had never smoked. Respiratory support at presentation ranged from no supplementary oxygen requirement (8/58, 13.8%) to invasive positive pressure ventilation (IPPV; 27/58, 46.6%). One patient (1.7%) required IPPV with extracorporeal membrane oxygenation.
Table 1.
Characteristics of patients with CT scan data at each timepoint
| Characteristic | All patients, n=58 | With baseline CT scan, n=48 | With 3-month CT scan, n=56* | With 12-month CT scan, n=45* | p-value† | |
|---|---|---|---|---|---|---|
| SARS-CoV-2 PCR result | Positive/tested (%) | 47/55 (85.5%) | 37/45 (82.2%) | 46/53 (86.8%) | 37/43 (86.1%) | 0.834 |
| Interval between CT scans (days) | Median (IQR) | – | – | 93 (63–121) | 349 (263–370) | – |
| Range | – | – | 45–263 | 165–435 | ||
| Age (years) | Median (IQR) | 58 (52–68) | 59 (54–69) | 58 (53–67) | 58 (52–66) | 0.792 |
| Range | 33–82 | 33–82 | 33–82 | 33–80 | ||
| Sex | Female | 22 (37.9%) | 18 (37.5%) | 21 (37.5%) | 19 (42.2%) | 0.891 |
| Male | 36 (62.1%) | 30 (62.5%) | 35 (62.5%) | 26 (57.8%) | ||
| Smoking history | Ex-smoker | 6 (10.3%) | 5 (10.4%) | 6 (10.7%) | 4 (8.9%) | 0.999 |
| Never smoked | 30 (51.7%) | 24 (50.0%) | 29 (51.8%) | 23 (51.1%) | ||
| Not recorded | 22 (37.9%) | 19 (39.6%) | 21 (37.5%) | 18 (40.0%) | ||
| BMI (kg/m2) | Median (IQR) | 29.7 (26.9–31.5) | 29.7 (27.7–31.4) | 29.9 (26.9–31.6) | 29.6 (26.9–32.3) | 0.975 |
| Ethnicity | Asian or Asian British | 5 (8.6%) | 3 (6.3%) | 5 (8.9%) | 5 (11.1%) | 0.988 |
| Black, Black British, Caribbean or African | 13 (22.4%) | 13 (27.1%) | 12 (21.4%) | 9 (20.0%) | ||
| White | 13 (22.4%) | 12 (25.0%) | 13 (23.2%) | 9 (20.0%) | ||
| Mixed or other ethnic groups | 20 (34.5%) | 16 (33.3%) | 20 (35.7%) | 17 (37.8%) | ||
| Not specified | 7 (12.1%) | 4 (8.3%) | 6 (10.7%) | 5 (11.1%) | ||
| Comorbidities | Asthma | 6/58 (10.3%) | 6/48 (12.5%) | 4/56 (7.1%) | 6/45 (13.3%) | 0.569 |
| DM | 23/58 (39.7%) | 19/48 (39.6%) | 22/56 (39.3%) | 19/45 (42.2%) | 0.955 | |
| HTN | 31/58 (53.4%) | 28/48 (58.3%) | 30/56 (53.6%) | 23/45 (51.1%) | 0.783 | |
| IHD/TIA/CVA/AF/DVT | 7/58 (12.1%) | 7/48 (14.6%) | 6/56 (10.7%) | 6/45 (13.3%) | 0.824 | |
| CKD | 6/58 (10.3%) | 5/48 (10.4%) | 6/56 (10.7%) | 5/45 (11.1%) | 1.000 | |
| Obesity | 30/58 (51.7%) | 25/48 (52.1%) | 28/56 (50.0%) | 24/45 (53.3%) | 0.957 | |
| Peak respiratory support required | None | 8 (13.8%) | 8 (16.7%) | 8 (14.3%) | 6 (13.3%) | 1.000 |
| Supplementary oxygen with peak FiO2 <60% | 15 (25.9%) | 9 (18.8%) | 13 (23.2%) | 11 (24.4%) | ||
| Supplementary oxygen with peak FiO2 ≥60% but not requiring CPAP, IPPV or ECMO | 5 (8.6%) | 3 (6.3%) | 5 (8.9%) | 4 (8.9%) | ||
| CPAP | 2 (3.5%) | 2 (4.2%) | 2 (3.6%) | 2 (4.4%) | ||
| IPPV | 27 (46.6%) | 25 (52.1%) | 27 (48.2%) | 21 (46.7%) | ||
| IPPV + ECMO | 1 (1.7%) | 1 (2.1%) | 1 (1.8%) | 1 (2.2%) | ||
| Length of hospital admission (days) | Median (IQR) | 32 (7–61) | 39 (6.5–67.5) | 35.5 (6.5–61.5) | 34 (8–59) | 0.958 |
*For 10 patients without baseline CT, intervals to 3-month and 12-month scans were calculated from date of discharge at baseline.
†Chi-squared test (or Fisher's exact test if any cell frequency ≤5) for categorical variables, Kruskal–Wallis test for continuous variables comparing values at each timepoint (baseline, 3 months and 12 months); for each comorbidity, presence versus absence (some patients had multiple health conditions).
AF = atrial fibrillation; CKD = chronic kidney disease; CPAP = continuous positive airway pressure; CT = computed tomography; CVA = cerebrovascular accident; DM = diabetes mellitus; DVT = deep venous thrombosis; ECMO = extracorporeal membrane oxygenation; FiO2 = fraction of inspired oxygen; HTN = hypertension; IHD = ischemic heart disease; IPPV = invasive positive pressure ventilation; IQR = interquartile range; SARS-Cov-2 = severe acute respiratory syndrome-coronavirus 2; TIA = transient ischaemic attack.
Respiratory symptoms and physiological parameters
Symptoms, exercise tests, lung function tests and numbers of corresponding CT scans are summarised in Fig 1. Breathlessness was the most common symptom at baseline (43/44 patients, 97.7%), 3 months (28/47, 59.6%) and 12 months (22/44, 50.0%) (Table 2). Cough was frequently reported at baseline (38/43 patients, 88.4%) and less frequently subsequently (10/47 (21.3%) at 3 months; 6/30 (20.0%) at 12 months). Chest pain was reported by a few patients (6/44, 13.6%) at baseline and by none at 12 months.
Fig 1.

Flow chart showing reported symptoms, exercise tests, lung function tests and chest CT scans performed at baseline (t0), 3 months (t1) and 12 months (t2) after COVID-19 infection. COVID-19 = Coronavirus 2019; CT = computed tomography; DLCO = transfer factor for carbon monoxide; FEV1 = forced expiratory volume in 1 s; FVC = forced vital capacity; TLC = total lung capacity.
Table 2.
Repeat measurements (symptoms, lung function tests and blood tests) and exercise test results
| Measurement* | Baseline | 3 months | 12 months | ||
|---|---|---|---|---|---|
| Symptoms | |||||
| Breathlessness | 97.7% (43/44) | 59.6% (28/47) | 50.0% (22/44) | ||
| Cough | 88.4% (38/43) | 21.3% (10/47) | 20.0% (6/30) | ||
| Chest pain | 13.6% (6/44) | 17.0% (8/47) | 0.0% (0/29) | ||
| Exercise test results (3 months only) | |||||
| Oxygen saturation (baseline) (%) | 97 (96–98), n=43 | ||||
| Oxygen saturation (lowest final) (%) | 95 (93–97), n=43 | ||||
| Change in modified Borg dyspnoea scale score | 2 (1–2), n=37 | ||||
| Change in oxygen saturation (%) | –2 (–3 to 0), n=41 | ||||
| Test result | No desaturation | 64.4% (29/45) | |||
| Desaturation | 31.1% (14/45) | ||||
| Patient unable | 4.4% (2/45) | ||||
| Lung function test results (3 months and 12 months only) | |||||
| FEV1 (% predicted) | 84 (72–99), n=44 | 93 (83–101), n=27 | |||
| FVC (% predicted) | 81 (70–97), n=45 | 88 (77–100), n=27 | |||
| FEV1/FVC ratio | 111 (105–117), n=44 | 107 (102–111), n=27 | |||
| TLC (% predicted) | 72 (60–82), n=25 | 79 (69–83), n=11 | |||
| DLCO (% predicted) | 59 (53–67), n=27 | 73 (63–77), n=22 | |||
| Spirometry | Normal | 55.6% (25/45) | 85.2% (23/27) | ||
| Restrictive | 42.2% (19/45) | 14.8% (4/27) | |||
| Obstructive | 2.2% (1/45) | 0.0% (0/27) | |||
| Bloods | |||||
| Lymphocytes (3109/L) | 0.7 (0.5–1.1), n=45 | 1.9 (1.5–2.6), n=44 | 2.1 (1.6–2.6), n=26 | ||
| CRP (mg/L) | 158 (103–294), n=45 | 2.1 (0.8–9.7), n=42 | 3.3 (0.9–8.3), n=20 | ||
| D-dimer (μg/mL) | 2,435 (1,176–10,842), n=44 | 323 (27–865), n=39 | 373 (0–453), n=8 | ||
| Ferritin (μg/L) | 1,116 (544–2,493), n=42 | 82 (34–202), n=40 | 226 (58–469), n=6 | ||
| Troponin (ng/mL) | 8 (1–26), n=44 | 1 (1–3), n=39 | 1.5 (1–2), n=6 | ||
| BNP (pg/mL) | 11 (1–51), n=35 | 22 (1–56), n=38 | 1 (1–25), n=7 | ||
| Creatinine (μmol/L) | 77 (63–125), n=53 | 78 (65–96), n=44 | 81 (65–116), n=32 | ||
| Urea (μmol/L) | 10.3 (6.1–17.3), n=54 | 5.5 (4.4–7.0), n=42 | 6.1 (3.9–8.0), n=30 | ||
*D-dimer >20,000 μg/mL was replaced with 20,000 μg/mL, <270 μg/mL with 27 μg/mL; troponin <5 ng/mL was replaced with 1 ng/mL; BNP <10 pg/mL was replaced with 1 pg/mL. Blood test result values are reported as the nadir lymphocyte count, peak CRP, peak D-dimer, peak ferritin, peak troponin, peak BNP, peak creatinine and peak urea at each timepoint.
BNP = brain natriuretic peptide; CRP = C-reactive protein; DLCO = transfer factor for carbon monoxide; FEV1 = forced expiratory volume in 1 s; FVC = forced vital capacity; TLC = total lung capacity.
Post-exertional desaturation occurred in 14/45 (31.3%) patients upon exercise testing at 3 months (Table 2). At 3 months, spirometry was normal in 25/45 (55.6%) patients; restrictive in 19/45 (42.2%); and obstructive in 1/45 (2.2%). At 12 months, spirometry was normal in 23/27 (85.2%) patients; restrictive in 4/27 (14.8%); and obstructive in none. Median TLC was 72% predicted (IQR 60–82) at 3 months and 79% predicted (IQR 69–83) at 12 months. Median DLCO was 59% predicted (IQR 53–67) at 3 months and 73% predicted (IQR 63–77) at 12 months.
Blood tests at baseline demonstrated: median nadir lymphocyte count 0.73109/L; median peak CRP 158 mg/L; median peak D-dimer 2435 μg/mL; and median peak ferritin 1116 μg/L. Resolution of most blood test abnormalities occurred by 3 or 12 months (Table 2).
Assessment of CT features
Interobserver agreement
There was moderate-to-high interobserver agreement for extent of consolidation, GGO and TBI (Lin's concordance correlation coefficient >0.4) (Table S1). Interobserver agreement was moderate for pulmonary distortion at baseline and 3 months; and for parenchymal bands and subpleural curvilinear lines at all timepoints (Cohen/Conger's ordinal weighted kappa >0.4). There was moderate-to-high agreement for lobar distribution of CT features (Table S2).
Longitudinal changes in CT features
Following baseline scans, 3-month CT scans were performed at a median 93 (IQR 63–121) days and 12-month CT scans at a median 349 (IQR 263–370) days. Consolidation extent decreased between baseline and 3 months (p<0.001, Mann–Whitney U test) and was static between 3 and 12 months (Fig 2a). GGO extent did not change between baseline and 3 months but did decrease between 3 and 12 months (p =0.001) (Fig 2b). CP extent decreased between baseline and 3 months (p=0.004) but remained static between 3 and 12 months (Fig 2c).
Fig 2.
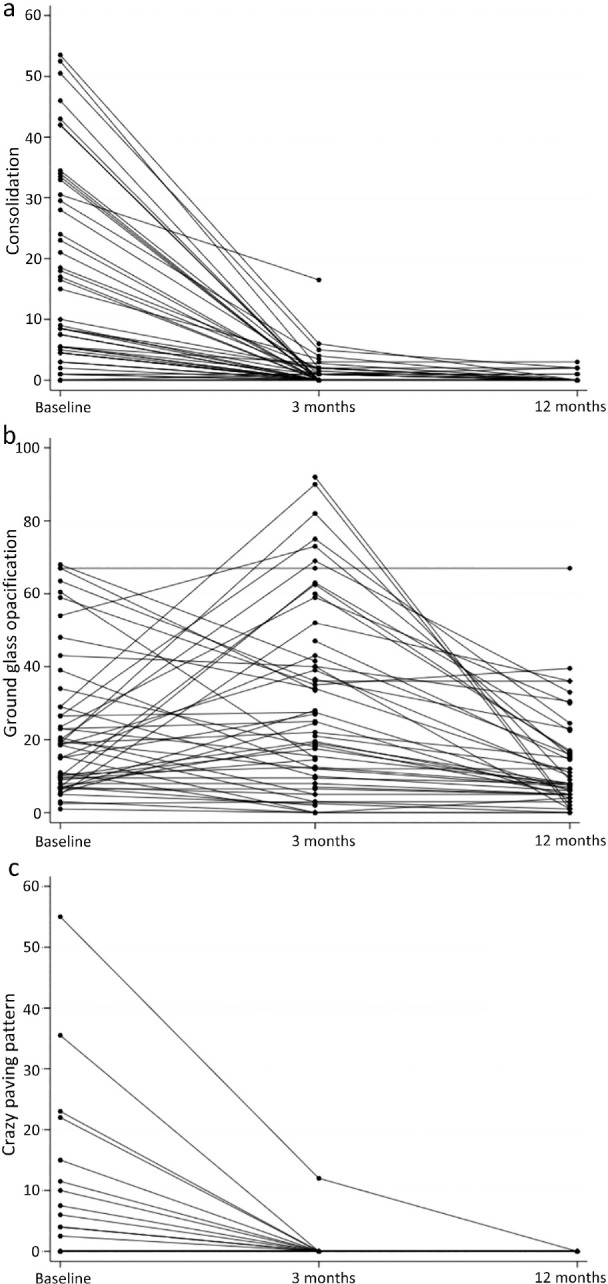
Mean percentage extent of (a) consolidation, (b) ground glass opacification and (c) crazy paving pattern on chest CT scans at baseline, 3 months and 12 months after COVID-19 infection. Number of patients at baseline = 48. Number of patients at 3 months = 56. Number of patients at 12 months = 46. COVID-19 = Coronavirus 2019; CT = computed tomography.
Parenchymal bands increased between baseline and 3 months (p<0.001), with no change thereafter (Fig 3a, Table S3). An increase in subpleural curvilinear lines was observed between baseline and 3 months (p=0.004), with no change thereafter (Fig 3b, Table S3). No overall changes in extent of RP, honeycombing, traction bronchiectasis/bronchiolectasis or pulmonary distortion were evident across timepoints (Fig S1).
Fig 3.

Percentage of patients whose CT scans at baseline, 3 months and 12 months after COVID-19 infection showed parenchymal bands (a) and subpleural curvilinear lines (b). COVID-19 = Coronavirus 2019; CT = computed tomography.
Consolidation and GGO in particular were most frequently observed in a perilobular distribution and RP was observed peripherally (Table S4). CP was most frequently observed in widespread or peripheral distributions at baseline, albeit in only a few patients. Overall distributions of CT features did not change over time.
CT features and respiratory symptoms
Consolidation extent was strongly associated with breathlessness (odds ratio (OR) 3.35, 95% confidence interval (CI) 1.40–8.00; p=0.007) over all timepoints (Table 3), mainly because of strong correlation between consolidation and breathlessness at baseline (Fig S2a). Consolidation extent was not associated with either cough or chest pain. Honeycombing extent was strongly associated with breathlessness (OR 1.66, 95% CI 1.18–2.32; p=0.003) and weakly associated with chest pain (OR 1.45, 95% CI 0.94–2.25; P = 0.094). The number of patients with limited honeycombing was very low at each timepoint: among breathless patients, there was honeycombing in one patient at baseline; three patients at 3 months; and two patients at 12 months. There was a single non-breathless patient with honeycombing at each timepoint (Fig S2b). CP was a strong predictor of breathlessness (Fig S2c) and chest pain, but not of cough (Table 3).
Table 3.
Associations between CT features, symptoms and lung function*
| Outcome† | Breathlessness, odds ratio (95% CI) | Cough, odds ratio (95% CI) | Chest pain, odds ratio (95% CI) | Percentage predicted FVC, mean difference (95% CI) | FEV1/FVC ratio, mean difference (95% CI) | Percentage predicted TLC, mean difference (95% CI) | Percentage predicted DLCO, mean difference (95% CI) |
|---|---|---|---|---|---|---|---|
| Consolidation | 3.35 (1.40–8.00), p=0.007 | 1.22 (0.92–1.61), p=0.169 | 1.00 (0.95–1.05), p=0.954 | –5.33 (–7.60 to −3.07), p<0.001 | 1.70 (0.43–2.97), p=0.009 | –0.22 (–4.10 to 3.67), p=0.913 | –5.70 (–8.16 to–3.24), p<0.001 |
| Ground glass opacification | 1.01 (0.99–1.03), p=0.387 | 1.01 (1.00–1.03), p=0.285 | 1.01 (0.97–1.05), p=0.617 | –0.15 (–0.26 to −0.03), p=0.011 | 0.08 (–0.00 to 0.15), p=0.055 | –0.02 (–0.17 to 0.12), p=0.729 | –0.16 (–0.29 to −0.04), p=0.012 |
| Reticular pattern | 0.98 (0.93–1.03), p=0.354 | 0.97 (0.93–1.02), p=0.186 | 0.92 (0.80–1.06), p=0.273 | –0.24 (–0.82 to 0.33), p=0.402 | 0.14 (–0.10 to 0.38), p=0.252 | –0.22 (–0.60 to 0.16), p=0.253 | 0.18 (–0.55 to 0.91), p=0.629 |
| Honeycombing | 1.66 (1.18–2.32), p=0.003 | 1.00 (0.67–1.48), p=0.992 | 1.45 (0.94–2.25), p=0.094 | –2.72 (–5.08 to −0.37), p=0.023 | 0.85 (–0.48 to 2.18), p=0.209 | –0.31 (–1.63 to 1.01), p=0.649 | –1.79 (–5.71 to 2.13), p=0.371 |
| Crazy paving pattern | perfect prediction | 1.23 (0.78–1.94), p=0.4375 | perfect prediction | –0.62 (–1.48 to 0.24), p=0.155 | –0.08 (–0.66 to 0.50), p=0.795 | –1.25 (–2.32 to −0.19), p=0.021 | –1.64 (–2.51 to −0.76), p<0.001 |
| Pulmonary distortion | 0.91 (0.72–1.15), p=0.431 | 0.91 (0.76–1.09), p=0.316 | 0.73 (0.52–1.04), p=0.083 | –0.51 (–2.28 to 1.26), p=0.574 | 0.26 (–0.72 to 1.24), p=0.604 | –1.65 (–3.57 to 0.26), p=0.091 | 0.59 (–0.84 to 2.02), p=0.420 |
| Parenchymal bands | 0.91 (0.71–1.15), p=0.422 | 0.90 (0.71–1.14), p=0.368 | 0.82 (0.54–1.24), p=0.341 | –1.45 (–3.81–0.91), p=0.230 | 0.78 (–0.43 to 1.98), p=0.208 | –0.30 (–3.06 to 2.45), p=0.829 | –0.38 (–3.19 to 2.43), p=0.792 |
| Subpleural curvilinear lines | 0.72 (0.55–0.95), p=0.019 | 0.79 (0.61–1.03), p=0.083 | 0.75 (0.47–1.22), p=0.251 | 0.30 (–2.08 to 2.68), p=0.806 | –0.36 (–1.54 to 0.82), p=0.547 | 0.16 (–1.95 to 2.26), p=0.883 | 1.68 (–1.06 to 4.41), p=0.229 |
| Traction bronchiectasis/bronchiolectasis index | 0.97 (0.53–1.79), p=0.931 | 0.91 (0.56–1.50), p=0.724 | 0.48 (0.11–2.01), p=0.315 | –6.75 (–12.6 to −0.94), p=0.023 | 3.21 (0.33–6.09), p=0.029 | –3.36 (–8.80 to 2.09), p=0.227 | –5.65 (–14.2 to 2.94), p=0.197 |
*For binary outcomes (breathlessness, cough and chest pain), random effects logistic regression with robust standard errors, grouped by patient over three timepoints; for continuous outcomes (FVC, FEV1/FVC ratio, plethysmography TLC and diffusion DLCO), random effects linear regression with robust standard errors, grouped by patient over three timepoints; all models adjusted for age, sex and body mass index.
†For consolidation, ground glass opacification, reticular pattern, honeycombing, crazy paving pattern: whole lung % (mean of % for each of five lobes); for pulmonary distortion, parenchymal bands, and subpleural curvilinear lines: number of lobes affected; for traction bronchiectasis/bronchiolectasis index whole-lung mean index (mean of index for each of five lobes).
CI = confidence interval; DLCO = transfer factor for carbon monoxide; FEV1 = forced expiratory volume in 1 s; FVC = forced vital capacity; TLC = total lung capacity.
The extent of subpleural curvilinear lines was associated with lower odds of breathlessness (OR 0.72, 95% CI 0.55–0.95; p=0.019) and weakly associated with lower odds of cough (OR 0.79, 95% CI 0.61–1.03; p=0.083) (Table 3). The former was driven by there being a higher median number of lobes in which subpleural curvilinear lines were present among non-breathless versus patients at 3 and 12 months (Fig S2d). Extent of GGO, RP, traction bronchiectasis/bronchiolectasis, pulmonary distortion and parenchymal bands were not associated with breathlessness, cough or chest pain.
Honeycombing at baseline was a perfect predictor of breathlessness and cough at 12 months, whereas CP and parenchymal bands at baseline were perfect predictors of cough at 12 months (Table S5). These results were derived from the only patient with honeycombing at baseline who did not have breathlessness or cough at 12 months and from four patients without CP or parenchymal bands at baseline who had a cough at 12 months. No patients with CP or parenchymal bands at baseline had a cough at 12 months.
CT features and pulmonary physiological parameters
The extent of consolidation was strongly associated with lower percentage predicted FVC (ppFVC) (mean difference (MD) −5.33, 95% CI −7.60 to −3.07; p<0.001), as were GGO (MD −0.15, 95% CI −0.26 to −0.03; p=0.011), honeycombing (MD −2.72, 95% CI −5.08 to −0.37; p=0.023) and TBI (MD −6.75, 95% CI −12.6 to −0.94; p=0.023) (Table 3). The extent of pulmonary distortion at baseline was associated with higher ppFVC at 12 months (MD 3.52, 95% CI 0.77–6.27; p=0.015), as was the extent of subpleural curvilinear lines at baseline (MD 6.46, 95% CI 2.73–10.2; p=0.002) (Table S5).
Consolidation extent was associated with a higher FEV1/FVC ratio (MD 1.70, 95% CI 0.43–2.97; p=0.009), as was the extent of traction bronchiectasis/bronchiolectasis (MD 3.21, 95% CI 0.33–6.09; p=0.029). There was an inverse association between CP extent and percentage predicted TLC (ppTLC) (MD −1.25, 95% CI −2.32 to −0.19; p=0.021); and a weak inverse association between pulmonary distortion and ppTLC (MD −1.65, 95% CI −3.57 to 0.26; p=0.091). Consolidation extent was strongly inversely associated with percentage predicted DLCO (ppDLCO) (MD −5.70, 95% CI −8.16 to −3.24; p<0.001), as was CP (MD −1.64, 95% CI −2.51 to −0.76; p<0.001) and, less strongly, GGO (MD −0.16, 95% CI −0.29 to −0.04; p=0.012). The extent of traction bronchiectasis/bronchiolectasis, RP, parenchymal bands, pulmonary distortion and subpleural curvilinear lines was not associated with either ppTLC or ppDLCO. Associations between CT features at baseline and 3 months and exercise test results (at 3 months) are shown in Table S6.
Discussion
Pulmonary radiological abnormalities, ranging from GGO and interstitial thickening to fibrosis, were reported following the SARS-CoV-1 pandemic.19 During the COVID-19 pandemic, a systematic review and meta-analysis identified that 29% of chest CT scans demonstrated radiological changes of pulmonary fibrosis within 12 months of COVID-19-related hospitalisation.20 In our study comprising patients with varying degrees of COVID-19 severity, we evaluated associations between CT features, respiratory symptoms and physiological parameters. Understanding such associations is vital for monitoring progress and predicting recovery in this cohort. We found that selected post-COVID-19 radiological features on chest CT were not associated with significant functional detriment and that their presence alone might not necessarily require long-term specialist follow-up. This is of direct relevance to the clinical practice of general physicians because they are likely to encounter this cohort of patients both on the acute medical take and in specialty clinics. An awareness and appreciation of the different potential functional implications of post-COVID-19 chest CT changes will be important when holistically assessing patients who might present with multi-systemic sequelae of COVID-19 infection.
Evolution of CT features
Our data demonstrated improvement in the extent of consolidation and CP between baseline and 3 months. These findings are consistent with other studies that showed a decrease in consolidation and CP by 3 months.21,22 Bocchino et al. found that the prevalence of consolidation decreased from 71% at baseline to 0% by 6 months.23 We also found that, compared with baseline, parenchymal bands increased by 3 and 12 months. In another study, parenchymal bands remained present in 26/43 (60%) patients at 7 months.24
In our study, GGO extent improved by 12 months. Sonnweber et al. found that GGO extent decreased significantly between 60 and 100 days follow-up.25 Bonato et al. found that GGO decreased by 3 months, but by a lesser extent than consolidation or CP.22 One study reported a median reduction in GGO of 11.5% by 12 months,13 whereas another found that GGO prevalence decreased from 100% at baseline to 2% at 12 months.23 However, the GGO finding in our study does contrast with interim analysis from the UKILD Post-COVID study, which demonstrated that GGO did not improve over the course of follow-up.26
Our data did not show changes in chest CT features of irreversible fibrosis (RP, traction bronchiectasis or pulmonary distortion) or honeycombing (albeit in only a few patients) over 12 months. Bocchino et al found that fibrotic features identified at 3–6 months remained stable at 12 months.23 Han et al found that patients with fibrotic interstitial lung abnormalities at 6 months had persistent fibrotic features at 12 months; RP decreased during this interval.12
In another follow-up study, no honeycombing was seen at 12 months follow-up.27 In our study, no changes in honeycombing were observed because most patients did not have honeycombing at either baseline or subsequently. Given that honeycombing was rare, it is possible that patients whose CT scans showed honeycombing at baseline had mild ILD before they contracted COVID-19 or that their honeycombing was unlinked to COVID-19.
It is interesting to speculate why some studies have shown no change in fibrosis during follow-up whereas others have demonstrated progression over time. It is possible that this relates to the heterogeneous nature of the patient cohorts that have been assessed in different studies. Factors such as patient age, sex, BMI, smoking history and the need for mechanical ventilation during acute COVID-19 illness vary between study cohorts and it remains unclear how each of these variables might impact the likelihood of subsequent post-COVID-19 fibrosis progression or resolution. Differences in treatment regimens between cohorts might also have a role. Future studies should seek to explore this.
Respiratory symptoms
Subpleural curvilinear lines were associated with lower odds of breathlessness during follow-up. They are among the most frequently observed post-COVID-19 radiological abnormalities at 12 months, with one study reporting a 15% prevalence.28 Our data provide reassurance that subpleural curvilinear lines are not associated with a corresponding symptomatic burden and might represent sequelae of previous organising pneumonia. Bonato et al found that symptoms at follow-up were not associated with baseline CT features.22 Vijayakumar et al found that 6/32 (19%) patients reported breathlessness at 12 months, whereas 5/32 (16%) who reported breathlessness at 3 months had resolution of dyspnoea by 12 months despite no significant radiological resolution.13 In our study, there was no overall association between CT features and presence of cough or chest pain. Han et al reported a higher degree of cough among patients with fibrotic changes at 6 months than among those with radiological resolution.21
Pulmonary physiological parameters
Parenchymal bands were not associated with symptoms and changes in lung function test parameters overall, but their presence at baseline was associated with a greater change in SpO2 at 3 months; and their presence at 3 months was associated with twofold odds of desaturation upon exercise testing at 3 months. Extent of consolidation, GGO, honeycombing and CP were inversely associated with ppFVC overall. Extent of consolidation and traction bronchiectasis/bronchiolectasis were positively associated with the FEV1/FVC ratio. CP extent was associated with a reduction in ppTLC and ppDLCO.
At ∼2 months follow-up, higher CT scores have been associated with an increase in FEV1/FVC ratio and a decrease in ppFVC and ppDLCO.29 Among patients with ≥60% CT abnormality at 3 months, disease extent was shown to be negatively correlated with FVC and TLC and positively correlated with carbon monoxide transfer coefficient.13 At 4 months' follow-up of patients who required supplemental oxygen at index COVID-19 presentation, GGO and traction bronchiectasis have been strongly correlated with a reduction in ppDLCO and ppFVC, whereas RP has been strongly correlated with a reduction in ppDLCO.30 Han et al demonstrated that diffusing capacity was abnormal in patients with CT abnormalities persisting at 6 months.21 In their subsequent study, 13/53 (25%) patients had abnormal diffusing capacity at 12 months, with 11/13 (85%) of these patients having fibrotic interstitial lung abnormalities.12
Limitations
This is a retrospective study with a modest convenience sample of patients. It had low statistical power to detect associations (and no a priori sample size calculation). Conversely, our dataset was rich in outcome and exposure variables. Apparent evidence of associations should be interpreted in the context of the large number of statistical tests performed and regression models fitted. Symptoms were recorded based on information in clinic letters because formal scoring systems were not routinely documented. Variation in the extent of documentation by the clinicians reviewing patients in clinic might have limited our ability to acquire complete data on symptoms. Our study could not identify the presence of pulmonary fibrosis before COVID-19 onset in the absence of previous CT scans. We might have missed patients who had mild residual abnormalities on chest radiography at first follow-up and who might not have undergone subsequent CT that would have been more sensitive. The cohort was from the first 6 months of the pandemic, meaning that patients were unvaccinated against SARS-CoV-2 and exposed only to early SARS-CoV-2 variants.
Conclusions
Chest CT abnormalities persisted up to 12 months after initial SARS-CoV-2 infection. CT features of irreversible pulmonary fibrosis (RP, traction bronchiectasis/bronchiolectasis and pulmonary distortion) following COVID-19 remained static over time, whereas other features resolved or remained unchanged. Subpleural curvilinear lines were not associated with subsequent breathlessness and parenchymal bands were not functionally significant. CP extent was associated with a reduction in ppTLC and ppDLCO overall, whereas traction bronchiectasis/bronchiolectasis and pulmonary distortion were not. Data from prospective studies with larger cohorts and longer follow-up are needed to determine whether further radiological and functional improvements occur over time.
Summary
What is known?
Chest CT features of irreversible fibrosis can develop following acute pulmonary SARS-CoV-2 infection.
What is the question?
Following COVID-19, how do chest CT features of pulmonary fibrosis evolve over time and how are these CT features associated with patients' respiratory symptoms and lung physiological parameters at 3 and 12 months' follow-up?
What was found?
Over 12-months post-COVID-19 follow-up, chest CT features of irreversible fibrosis remained static, whereas other features either resolved or remain unchanged. The presence of subpleural curvilinear lines did not correlate with breathlessness. The presence of parenchymal bands did not have significant functional correlates.
What is the implication for practice now?
The presence on chest CT of subpleural curvilinear lines and parenchymal bands alone following COVID-19 might not require specific radiological or clinical follow-up.
Funding
KK is an Imperial 4i clinician scientist at Imperial College London. KK and OMK are supported by the National Institute for Health and Care Research (NIHR) Imperial Biomedical Research Centre (BRC). The views expressed are those of the authors and not necessarily those of the NIHR or the Department of Health and Social Care. KK is also supported by the Lee Family endowment to the Faculty of Medicine at Imperial College London.
Conflicts of interests
KK, RR, SMC, LCB-A, PR, MA-Z, SLE, CR, GKR, KW, SS and OMK declare no conflicts of interest. RKC declares royalties received from ALCS (UK); honoraria received from Boehringer Ingelheim; travel expenses for a regional (England) educational meeting received from Boehringer Ingelheim; being chair of the British Thoracic Society Air Travel Clinical Statement Group from 2018 to 2022 (unpaid); being a member of the Sarcoidosis UK Clinical Board from 2019 to current (unpaid); being president of the Harveian Society of London from 2022 to current (unpaid). MC declares speaker fees from Gilead (2021 and 2022) and Pfizer (2021 and 2022). PM declares speaker fees from AstraZeneca and Chiesi. JM declares a previous MRC Skills Development Fellowship at the Liverpool School of Tropical Medicine (post-doctoral fellowship, salary and research funding); consulting fees from the Global TB Programme, WHO; being an unpaid committee member of the external scientific advisory board for the TB Sequel study and of the British Thoracic Society Respiratory Infection Specialist Advisory Group. MW declares being a NIHR and Innovate UK grant holder; and being an advisory board member of Qureight. SJC declares a NIHR Imperial BRC Cancer Theme pilot project grant award with payments made to Imperial College London for staff costs; an Imperial College Healthcare NHS Trust Division of Women's, Children's and Clinical Support Divisional Research Funding Award 2019/20 with payments made to Imperial College London for staff costs; book royalties received from Oxford University Press; payment received for expert radiology medicolegal statement (Fairweather's Solicitors, UK); and support received for attending the European Society of Thoracic Radiology meeting in June 2022 as a faculty member.
Supplementary material
Additional supplementary material may be found in the online version of this article at www.rcpjournals.org/content/clinmedicine.
S1 – Supplementary methods
S2 – Supplementary figures
S3 – Supplementary tables
Acknowledgements
The authors thank all members of the multidisciplinary and administrative teams who contributed to the operation of the COVID-19 follow-up clinic at Imperial College Healthcare NHS Trust.
References
- 1.World Health Organization . Coronavirus disease (COVID-19) pandemic. WHO, 2022. www.who.int/europe/emergencies/situations/covid-19 [Accessed 31 July 2023]. [Google Scholar]
- 2.Mandal S, Barnett J, Brill SE, et al. ‘Long-COVID’: a cross-sectional study of persisting symptoms, biomarker and imaging abnormalities following hospitalisation for COVID-19. Thorax 2021;76:396–8. [DOI] [PMC free article] [PubMed] [Google Scholar]
- 3.Mallia P, Meghji J, Wong B, et al. Symptomatic, biochemical and radiographic recovery in patients with COVID-19. BMJ Open Respir Res 2021;8:e000908. [DOI] [PMC free article] [PubMed] [Google Scholar]
- 4.Kotecha T, Knight DS, Razvi Y, et al. Patterns of myocardial injury in recovered troponin-positive COVID-19 patients assessed by cardiovascular magnetic resonance. Eur Heart J 2021;42:1866–78. [DOI] [PMC free article] [PubMed] [Google Scholar]
- 5.Rousan LA, Elobeid E, Karrar M, Khader Y. Chest x-ray findings and temporal lung changes in patients with COVID-19 pneumonia. BMC Pulm Med 2020;20:245. [DOI] [PMC free article] [PubMed] [Google Scholar]
- 6.Yin X, Xi X, Min X, et al. Long-term chest CT follow-up in COVID-19 Survivors: 102-361 days after onset. Ann Transl Med 2021;9:1231. [DOI] [PMC free article] [PubMed] [Google Scholar]
- 7.Watanabe A, So M, Iwagami M, et al. One-year follow-up CT findings in COVID-19 patients: a systematic review and meta-analysis. Respirology 2022;27:605–16. [DOI] [PMC free article] [PubMed] [Google Scholar]
- 8.Cocconcelli E, Bernardinello N, Giraudo C, et al. Characteristics and prognostic factors of pulmonary fibrosis after COVID-19 pneumonia. Front Med (Lausanne) 2021;8:823600. [DOI] [PMC free article] [PubMed] [Google Scholar]
- 9.Pan F, Yang L, Liang B, et al. Chest CT patterns from diagnosis to 1 year of follow-up in patients with COVID-19. Radiology 2022;302:709–19. [DOI] [PMC free article] [PubMed] [Google Scholar]
- 10.Liu M, Lv F, Huang Y, Xiao K. Follow-up study of the chest CT characteristics of COVID-19 survivors seven months after recovery. Front Med (Lausanne) 2021;8:636298. [DOI] [PMC free article] [PubMed] [Google Scholar]
- 11.Caruso D, Guido G, Zerunian M, et al. Post-acute sequelae of cOVID-19 pneumonia: six-month chest CT follow-up. Radiology 2021;301:E396–405. [DOI] [PMC free article] [PubMed] [Google Scholar]
- 12.Han X, Fan Y, Alwalid O, et al. Fibrotic interstitial lung abnormalities at 1-year follow-up CT after severe COVID-19. Radiology 2021;301:E438–40. [DOI] [PMC free article] [PubMed] [Google Scholar]
- 13.Vijayakumar B, Tonkin J, Devaraj A, et al. CT lung abnormalities after COVID-19 at 3 months and 1 year after hospital discharge. Radiology 2022;303:444–54. [DOI] [PMC free article] [PubMed] [Google Scholar]
- 14.Wu X, Liu X, Zhou Y, et al. 3-month, 6-month, 9-month, and 12-month respiratory outcomes in patients following COVID-19-related hospitalisation: a prospective study. Lancet Respir Med 2021;9:747–54. [DOI] [PMC free article] [PubMed] [Google Scholar]
- 15.Kumar K, Ratnakumar P, Ricci P, et al. Recovering from COVID-19: lessons learnt from an intensive secondary care follow-up service. Future Healthc J 2022;9:335–42. [DOI] [PMC free article] [PubMed] [Google Scholar]
- 16.British Society of Thoracic Imaging . BSTI Covid-19 followup CT and CXR report codes. www.bsti.org.uk/covid-19-resources/covid-19-bsti-reporting-templates/ [Accessed 31 July 2023].
- 17.Wells AU, King AD, Rubens MB, et al. Lone cryptogenic fibrosing alveolitis: a functional-morphologic correlation based on extent of disease on thin-section computed tomography. Am J Respir Crit Care Med 1997;155:1367–75. [DOI] [PubMed] [Google Scholar]
- 18.Wells AU, Desai SR, Rubens MB, et al. Idiopathic pulmonary fibrosis: a composite physiologic index derived from disease extent observed by computed tomography. Am J Respir Crit Care Med 2003;167:962–9. [DOI] [PubMed] [Google Scholar]
- 19.Antonio GE, Wong KT, Hui DS, et al. Thin-section CT in patients with severe acute respiratory syndrome following hospital discharge: preliminary experience. Radiology 2003;228:810–5. [DOI] [PubMed] [Google Scholar]
- 20.Fabbri L, Moss S, Khan FA, et al. Parenchymal lung abnormalities following hospitalisation for COVID-19 and viral pneumonitis: a systematic review and meta-analysis. Thorax 2023;78:191–201. [DOI] [PubMed] [Google Scholar]
- 21.Han X, Fan Y, Alwalid O, et al. Six-month follow-up chest CT findings after severe COVID-19 pneumonia. Radiology 2021;299:E177–E86. [DOI] [PMC free article] [PubMed] [Google Scholar]
- 22.Bonato M, Peditto P, Landini N, et al. Multidimensional 3-month follow-up of severe COVID-19: airways beyond the parenchyma in symptomatic patients. J Clin Med 2022;11:4046. [DOI] [PMC free article] [PubMed] [Google Scholar]
- 23.Bocchino M, Lieto R, Romano F, et al. Chest CT-based assessment of 1-year outcomes after moderate COVID-19 pneumonia. Radiology 2022;305:479–85. [DOI] [PMC free article] [PubMed] [Google Scholar]
- 24.Poitevineau T, Chassagnon G, Bouam S, et al. Computed tomography after severe COVID-19 pneumonia: findings at 6 months and beyond. ERJ Open Res 2021;7:00488–2021. [DOI] [PMC free article] [PubMed] [Google Scholar]
- 25.Sonnweber T, Sahanic S, Pizzini A, et al. Cardiopulmonary recovery after COVID-19: an observational prospective multicentre trial. Eur Respir J 2021;57:2003481. [DOI] [PMC free article] [PubMed] [Google Scholar]
- 26.Stewart I, Jacob J, George PM, et al. Residual lung abnormalities following COVID-19 hospitalization: interim analysis of the UKILD Post-COVID study. Am J Respir Crit Care Med 2022;207:693–703. [DOI] [PMC free article] [PubMed] [Google Scholar]
- 27.Luger AK, Sonnweber T, Gruber L, et al. Chest CT of lung injury 1 year after COVID-19 pneumonia: the CovILD study. Radiology 2022;304:462–70. [DOI] [PMC free article] [PubMed] [Google Scholar]
- 28.Zhao Y, Yang C, An X, et al. Follow-up study on COVID-19 survivors one year after discharge from hospital. Int J Infect Dis 2021;112:173–82. [DOI] [PMC free article] [PubMed] [Google Scholar]
- 29.Axelsson GT, Halldorsson AB, Jonsson HM, et al. Respiratory function and CT abnormalities among survivors of COVID-19 pneumonia: a nationwide follow-up study. BMJ Open Respir Res 2022;9:e001347. [DOI] [PMC free article] [PubMed] [Google Scholar]
- 30.McGroder CF, Zhang D, Choudhury MA, et al. Pulmonary fibrosis 4 months after COVID-19 is associated with severity of illness and blood leucocyte telomere length. Thorax 2021;76:1242–5. [DOI] [PMC free article] [PubMed] [Google Scholar]