

Abstract
Forests are chiefly responsible for the terrestrial carbon sink that greatly reduces the buildup of CO2 concentrations in the atmosphere and alleviates climate change. Current predictions of terrestrial carbon sinks in the future have so far ignored the variation of forest carbon uptake with forest age. Here, we predict the role of China’s current forest age in future carbon sink capacity by generating a high-resolution (30 m) forest age map in 2019 over China’s landmass using satellite and forest inventory data and deriving forest growth curves using measurements of forest biomass and age in 3,121 plots. As China’s forests currently have large proportions of young and middle-age stands, we project that China’s forests will maintain high growth rates for about 15 years. However, as the forests grow older, their net primary productivity will decline by 5.0% ± 1.4% in 2050, 8.4% ± 1.6% in 2060, and 16.6% ± 2.8% in 2100, indicating weakened carbon sinks in the near future. The weakening of forest carbon sinks can be potentially mitigated by optimizing forest age structure through selective logging and implementing new or improved afforestation. This finding is important not only for the global carbon cycle and climate projections but also for developing forest management strategies to enhance land sinks by alleviating the age effect.
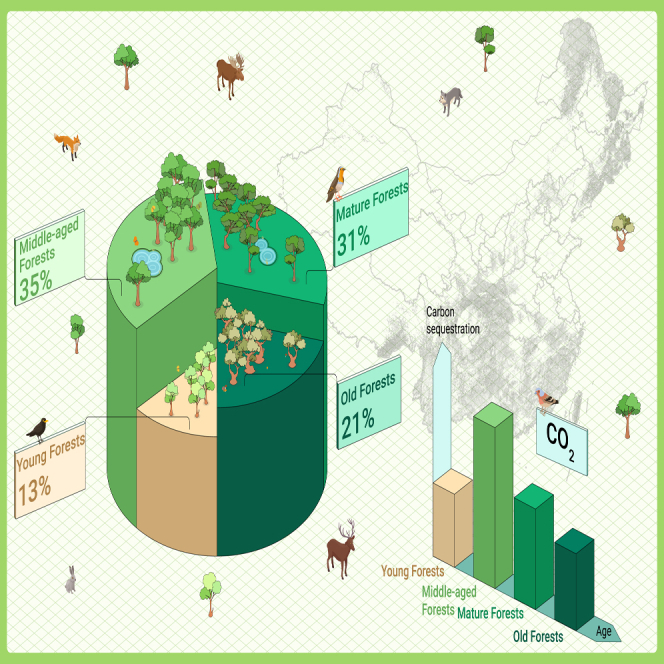
Graphical abstract
Public summary
-
•
Young and middle forests would sustain China’s current net primary productivity (NPP) for about 15 years.
-
•
Aging of forests would lead to an 8%–17% decline in China’s NPP in 40–80 years.
-
•
Optimizing forest age structure can be a way to maintain and enhance China’s carbon sink.
Introduction
Achieving carbon neutrality by 2060 is China’s commitment to the international community.1,2 Carbon neutrality requires reducing carbon emissions to a level that is in balance with carbon sinks in natural ecosystems, and the larger the sinks the less pressure on emission reduction.3 Terrestrial ecosystems are important carbon sinks, and China’s terrestrial ecosystem had a carbon sink of ∼0.33 PgC year−1, accounting for ∼12% of carbon emissions,4,5,6,7 although such estimates vary greatly.4,7,8,9 Forests contributed the highest proportion (∼80%) of carbon sinks among terrestrial ecosystems.10 To achieve carbon neutrality by 2060, the cost of reducing carbon emissions may increase exponentially with the amount of reduction,11 while the cost of increasing forest carbon sinks is relatively low.3 Therefore, predicting future changes in China’s forest carbon sinks is important to guide forest management and policy formulation for achieving carbon neutrality.
Many previous studies have predicted increased future forest carbon sinks in China for natural and anthropogenic reasons.11,12,13,14 An accelerated increase in China’s carbon sequestration after 2010 was documented due to climate change and human activities.12 About a 22.0%–31.5% increase in China’s carbon sequestration during the 2050s over the 2010s was projected by employing target-oriented management under various Representative Concentration Pathway scenarios.14 A potential increase of 66.7% in China’s carbon mitigation rate was predicted during 2020–2060 relative to the years 2000–2020 by employing new natural climate solutions.11 China’s forest carbon sink in 2000–2050 was projected to be as high as four times that of 1981–2000.13 However, these carbon sink predictions may be overly optimistic as the effects of forest stand age on forest growth have not been considered in these studies. Forest carbon sink potential is closely related to net primary productivity (NPP), which increases rapidly at young ages, peaks at middle ages, and then decreases at old ages to some extent.15,16 The decrease of NPP in aging forests is mainly driven by gross primary productivity (GPP), which declines faster with increasing age compared with autotrophic respiration (Ra).16,17,18,19,20 China has conducted intensive afforestation and reforestation programs since the 1960s,21 resulting in an increase in forest cover from 14% in the first China Forest Inventory Report (1973–1976) to 23% in the ninth China Forest Inventory Report (2014–2018). Planted and naturally regenerated forests are reported by the Food and Agriculture Organization of the United Nations (FAO) to occupy 94% of forest area in China, and most of them are currently in the young- and middle-aged categories22,23 with high carbon uptake capacity.24 High carbon sinks are thus likely to prevail in the near future in China given the absence of deforestation.25 However, there is a high risk that the carbon sink would decrease with natural forest aging.
Mapping China’s current forest age structure is critical for predicting the future forest carbon sink changes. About 85% of China’s forests grow in mountainous areas,26 and in most provinces forest stands are small (102–1002 m2) due to topographic variation and natural and anthropogenic disturbances. However, there were only three available forest age products covering all of China22,23,27 at the 1000 m spatial resolution, which is far beyond the stand scale (Figure S1) and not adequate for the quantitative analysis of China’s forest age structure, as the average age of two or more stands of different ages could be misleading in predicting future forest carbon sinks. For example, a 10-year-old forest and a 60-year-old forest could both have low growth rates, but when they are averaged to become a 35-year-old forest, the growth rate could double, according to some of the forest growth (NPP-age) curves. Therefore, mapping forest age at a higher resolution than the average size of forest stands is required to capture the spatial variability of forest attributes and improve forest growth and carbon sink estimation in China.
In this work, we present a robust prediction of how forest stand age impacts China’s future forest NPP based on the current forest age map and forest growth curves from different forest cover types. NPP was used to quantify the forest growth rate in terms of biomass production per unit time, and the NPP-age curve was used to represent the forest growth variation with stand age. Specifically, we first generated a forest age map based on high-resolution satellite images over China’s landmass, and then derived forest growth curves for different forest cover types and regions using satellite, forest inventory, and field survey data. We also predicted changes in China’s forest productivity from 2022 to 2100 based on the current forest age and the derived forest growth curves. Maps of peak forest growth years (the year with the peak forest NPP) and projected forest NPP in 2030, 2060, and 2100 are also provided to show the spatial patterns and trends of forest productivity changes in China. We project that China’s forests will maintain high growth rates for about 15 years. But as the forests grow older, their NPP will decline by 5.0% ± 1.4% in 2050, 8.4 ± 1.6% in 2060, and 16.6 ± 2.8% in 2100, indicating weakened carbon sinks in the near future. The weakening of the forest carbon sink can potentially be mitigated by optimizing forest age structure through selective logging and implementing new or improved afforestation. The projected changes and maps are expected to guide sustainable forest management and national policy development to achieve carbon neutrality by 2060.
Results
China’s forest age distribution at 30 m spatial resolution
Since most forests in mountainous areas are in small sizes (102–1002 m2), a forest age map of China at a high spatial resolution of 30 m (Figure 1) was generated as the base map of the current forest age structure for future prediction. It was derived by merging annual forest disturbance maps derived from Landsat time series data by the COLD algorithm28 and an age map of undisturbed forests in 2019. The latter was derived from a forest height map29 available from Global Ecosystem Dynamics Investigation (GEDI) satellite data at a 30 m resolution (Figure S2) using a machine learning method30 trained with forest height, climate, terrain, and available forest age data (see supplemental methods). Forests that were disturbed at least once between 1986 and 2019 occupied 29.1% of the forest area and were aged less than 35 years. In addition, there were 13% of forests aged no more than 25 years (young forests), 35% aged 26–45 years (middle-aged forests), 31% aged 46–70 years (mature forests), and 21% aged over 70 years (old forests). Older forests were mainly distributed in protected areas and remote mountains, while young- and middle-aged forests were mainly located in the south and southeast of China and in the planted and naturally regenerated forest areas. This forest age map was validated using two sets of reference datasets: one is the interpreted 3,907 reference forest disturbance dataset in China (Figure 2A), and the other is the 3,121 forest field survey samples31 in China (Figure 2B). Validation with the reference forest disturbance samples indicated that the mapped age of the disturbed forest had a small error of ±3.6 years (Figure 3A). Validation with the randomly selected 30% of forest field survey samples (samples with disturbances that occurred after the survey date were screened) showed that the mapped forest age had a relatively large error of ±8.4 years (Figure 3B), but still smaller than the reported errors of ±12 to ±48 years in mapping forest age from forest height data.23,27,32,33,34 These errors of forest age mapping would be used in NPP uncertainty analysis (see supplemental methods).
Figure 1.

Distribution of China’s forest age in 2019 at 30 m resolution
The histogram shows the statistics of the disturbed and undisturbed forest ages at an interval of 5 years. “Disturbed” means the age of forest where a disturbance occurred between 1986 and 2019 and “Undisturbed” means the age of forest where no disturbance occurred between 1986 and 2019.
Figure 2.

Maps of 3,907 reference forest disturbance samples and 3,121 forest field survey samples in China
(A) The reference forest disturbance samples are shown in different colors according to the frequency of forest disturbances that occurred between 1986 and 2021, and they were used to calibrate and validate the forest disturbance detection algorithm for mapping the age of forest with disturbance that occurred between 1986 and 2021. (B) The forest field survey samples are shown in different colors according to their forest cover types, and they are used to map the age of a forest with no disturbance that occurred between 1986 and 2021 and build the NPP-age curves. EBF, evergreen broad-leaved forests; ENF, evergreen needle-leaved forests; DBF, deciduous broad-leaved forests; DNF, deciduous needle-leaved forests; MF, mixed forests.
Figure 3.

Validation of mapped forest age with disturbance that occurred between 1986 and 2021 and with no disturbance
The mapped forest ages with disturbances (A) were validated using the interpreted reference disturbance samples (Figure 2A). The points far away from the 1:1 line are the over-detected and omitted forest disturbances by the COLD algorithm, which represent only a small percentage of the total. The age of the undisturbed forest (B) was validated using the randomly selected 30% of 3,121 forest field survey samples in China (Figure 2B). The mark size and color indicate the frequency of samples.
Forest growth curves across China
Forest growth curves (NPP-age relationships) for different forest types and regions in China (Figure 4) were fitted using a mathematical model35 based on data from a total of 3,121 forest field survey samples.25 Due to limitations in the available forest field survey samples, we merged regions for some forest types to build the NPP-age curves, resulting in only 10 derived curves; in general, the ages at which forest NPP peaks are affected by climate factors.22 Southern regions, with higher temperatures, show growth curves that reach their peak earlier and experience relatively more significant decreases at old ages compared with the northern regions, which have lower temperatures. An evergreen broad-leaved forest (EBF) reaches its peak NPP at 30 years in the northwest, north, northeast, east, and south of China, and at 42 years in the southwest of China, which are similar to the reported average peak age of EBF in China at 40 years36 An evergreen needle-leaved forest (ENF) reaches its peak NPP at 55 years in northern China and 34 years in southern China, consistent with the reported finding that the peak age in northern regions is 21 years older than in southern regions.13 Deciduous broad-leaved forest (DBF), primarily distributed in northern China, reaches its peak age at 47 years, which is slightly larger than 41 years in southern China. The speed of NPP decline after reaching its peak is much faster in southern China than that in northern China in DBFs. Deciduous needle-leaved forests (DNFs), most of which (60.2%) are located in north and northeast China, reach their peak growth age at 40 years, which is consistent with the reported value of 40 years in the same region obtained from the Logistic stand growth equation using the National Forest Inventory (NFI) data.13 The mixed forest reaches its peak NPP at 40 years in northern China and 39 years in southern China.
Figure 4.

Forest growth curves in China
The forest growth curves are indicated by NPP-age relationships for different forest cover types and regions in China.
Projected forest growth from 2022 to 2100
The variation in China’s forest NPP from 2002 to 2100 is shown in Figure 5A. The historical changes in China’s forest NPP from 2002 to 2021 were added as a comparison. From 2002 to 2021, NPP at the 30 m resolution was downscaled by MODIS NPP products, while from 2022 to 2100 it was predicted based on the current forest age only. A significant increasing trend of China’s total forest NPP, at 6.6 TgC year−1, was observed from 2002 to 2021, which was mainly attributed to the effects of CO2 fertilization5,37 and increased leaf area index,4 as well as young and mid-aged forests.38 China’s forest NPP would maintain near its maximum until about 2036, with a peak in 2027, and then start to decline thereafter. Compared with 2021, China’s forest NPP would decrease by 5.0% ± 1.4% in 2050, 8.4% ± 1.6% in 2060, and 16.6% ± 2.8% in 2100, assuming no climate changes and deforestation/afforestation. The forest growth curves, forest age, forest cover types, and reference NPP in 2021 contributed 52.3%, 36.1%, 6.7%, and 4.9% to the uncertainty on average. Due to the differences in climate, forest age, and forest type, forest NPP in different regions showed diverse temporal patterns. Figure 5B shows the projected variations of forest NPP from 2025 to 2100 relative to that in 2021 in the six regions. Except for northwest China with a decreasing trend in forest NPP, the other five regions presented an initial increasing and then decreasing trend in forest NPP. Eastern China even exhibited an increased forest NPP until 2047, and two provinces Jiangsu and Shandong (see Figure S3 for the province locations) mainly contributed to this increase. The forest NPP in Jiangsu and Shandong will increase by 26.1% and 19.8% in 2050, respectively, probably due to the young age of newly planted forests with a forest age smaller than 12 years. The forest cover in Jiangsu greatly increased from 7% in 1999 to 24% in 2021 (17% of newly planted forests since 1999), and the forest cover in Shandong increased from 12.7% in 1999 to 20.9% in 2021 (8.2% of newly planted forests since 1999).
Figure 5.

Projected forest growth from 2022 to 2100
(A) Changes in China’s forest NPP from 2022 to 2100 due to forest aging. The forest growth curves, forest age, forest cover types, and reference NPP in 2021 contributed 52.3%, 36.1%, 6.7%, and 4.9% to the uncertainty on average indicated by the light green area.
(B) Variations of forest NPP from 2025 to 2100 relative to that in 2021 in the six regions. Green indicates a higher NPP than that in 2021, while orange indicates a lower NPP than that in 2021.
Spatial distribution of the year with peak forest growth
The spatial distribution of the year when the forest reaches its peak growth is shown in Figure 6. In 2021, 64.6% of forests (red and yellow) had already reached their peak NPP, so the age effect on NPP was negative; Meanwhile, 35.4% of forests (green and blue) had not yet reached their peak NPP, and the predicted future NPP would first increase and then decrease. Different regions showed diverse patterns of the peak growth year, and the pixels with a first increasing and then decreasing trend of forest NPP occupied 51.0% of the north region, 50.6% of the east region, 40.2% of the south region, 30.3% of the northeast region, 24.1% of the northwest region, and 23.8% of the southwest regions. The forests that will experience increasing NPP in the near future are mainly distributed in the parts of Daxing’an mountains, Taihang mountains, Dabie mountains, Hengduan mountains, and the mountains in the east and south of China.
Figure 6.

Distribution and histograms of the peak forest growth years
The peak forest growth year means the year when forest reaches its peak NPP across China at 30 m spatial resolution. The green lines in the map are the parts of the mentioned mountain ranges downloaded from the National Tibetan Plateau/Third Pole Environment Data Center.58 Orange in the histograms represents the predicted decreasing trend of future forest NPP; green in the histograms represents the predicted future trend of forest NPP rising first and then decreasing. E, Northeast China; N, North China; NW, Northwest China; E, East China; S, South China; SW, Southwest China.
Maps of projected forest NPP for several key years
Maps of projected forest NPP in 2030, 2060, and 2100 across China, based on current forest age only, are shown in Figure 7. The forest NPP downscaled from MODIS NPP products in 2021 was included as a baseline for the comparison. The total forest NPP across China in 2030 decreased slightly compared with that in 2021, in which 16.5% of forest pixels had a decrease in NPP larger than 0.047 kgC m−2 year−1 (equal to 5% of China’s mean forest NPP in 2021) and 55.3% of forest pixels had a decrease in NPP less than 0.047 kgC m−2 year−1. In addition, 6.0% of forest pixels showed no changes, and 22.2% of forest pixels had an increase in NPP. The percentage of forest pixels with a decrease in NPP larger than 0.047 kgC m−2 year−1 rose to 65.9% in 2060 and 81.3% in 2100. The forest pixels with unchanged NPP (meaning that the NPP in a year was the same as that of the year 2021) declined to 1.9% in 2060 and 1.0% in 2100, and the forest pixels with an increased NPP dropped to 8.3% in 2060 and 3.2% in 2100. These pixels with unchanged or increased NPP had relatively low NPP values in 2021, and their NPP could still increase until reaching a peak value, and then started to decline, but were still equal to or larger than the value in 2021. The forests in parts of East China, South China, and Southwest China still maintain relatively high NPP in 2060 and 2100, which might be attributed to their young forest ages and forest growth characteristics.
Figure 7.

Comparison of projected forest NPPs to the year 2021
The upper four maps are the NPP maps, and the bottom three histograms are the differences between the projected forest NPP in 2030, 2060, and 2100 and the forest NPP in 2021. Orange represents a smaller forest NPP; blue represents an equal forest NPP; green represents a larger forest NPP.
Discussion
Role of forest age on carbon sink
The forest net carbon gain (NPP) increases rapidly at young ages, peaks at middle ages, and then decreases at old ages.15,16 The classical view of the mechanisms underlying the decline of NPP in aging forests is primarily due to the reduction in GPP as the forest ages, while Ra increases with age.39,40 However, this classical view was demonstrated to be incorrect.16 The mechanisms of the age-driven decline in NPP are mainly driven by the decrease in GPP and Ra with increasing age, where GPP declines faster compared with Ra.16,17,18,19,20 The decrease in forest carbon gain in aging forests may be explained by nutrient limitation and ecosystem succession. Nutrient availability in older forests is often lower due to long-term biomass production and nutrient consumption, leading to nutrient deficiency in some soils. This restricts plant growth and slows down the rate of forest carbon gain.41,42 Over time, dominant species gradually occupy the forest, while other species are reduced or excluded. These changes in species composition and structure may also lead to a slowdown in the rate of forest carbon gain.43,44 Despite the age-driven decline of net carbon gain, forests still accumulate carbon in old ages,45,46 but the magnitude of forest carbon sinks is controversial (1.6 ± 0.6 vs. 2.4 ± 0.8 MgC ha−1year−1).
There are also limitations related to forest age, NPP-age curves, and the predicted net carbon gain of forests. Firstly, disturbed forests may not regrow back in the next year after the disturbance, and considering this time difference is critical for future updates of the forest age map. Secondly, due to constraints in the available forest field samples, we had to merge samples over large areas for a region when building the NPP-age curve, and the built curve may not be optimal for some areas in the region or forest types. Future modifications should consider incorporating additional samples to construct separated NPP-age curves for smaller regions. Finally, our predictions did not consider changes in the forest age structure within plantations. In plantations, young trees can be planted after each harvest and the forest age structure can be changed significantly, and considering these age structure changes can be directions for future modifications.
Effects of climate change and atmospheric composition on future NPP
China’s forest carbon sinks have been reported to increase due to the fertilization effects of increased atmospheric CO2 and nitrogen deposition,5,25,37 as well as the effects of climate change47 such as longer growing seasons.48 Process-based diagnostic ecosystem modeling quantified that CO2 fertilization effect, nitrogen deposition, and climate change were responsible for 47.0%, 1.1%, and −28.6% of the global accumulated land sink from 1981 to 2016,4 respectively, and the remaining 65.5% was contributed by the legacy effects of changes in these drivers before 1981. Based on the same simulation,4 CO2 fertilization, nitrogen deposition, and climate change contributed 26.1%, 2.6%, and −14.0% of China’s accumulated land sink from 1981 to 2016, respectively. CO2 is the basis of photosynthesis, and its increase in the atmosphere will lead to an increase in the rate of photosynthesis. Plant respiration can also be enhanced by the increase in CO2 concentration, but its increased magnitude is smaller than that of photosynthesis, resulting in the CO2 fertilization effect on NPP.49 The increased nitrogen deposition from 1981 to 2016 led to a significant NPP enhancement in China.4 Climate change had overall positive effects on both GPP and ecosystem respiration, and the increase in ecosystem respiration was more than the increase in GPP, leading to a net reduction in accumulated terrestrial carbon sink.4 Assuming no future climate change, we predicted a declining NPP trend of China’s forests in the near future based solely on the current forest age structure. However, the legacy effects of past changes in climate and atmospheric composition would still impact the NPP trend in the near future. The predicted declining trend of future NPP will also be significantly modified by future climate change, but mitigated by the continuous increase in atmospheric CO2 concentration in the future, although the CO2 fertilization effect may be decreasing.5 The average growth curve shown in Figure 5A for China’s forests in the near future can serve as a baseline to evaluate the impacts of the aforementioned factors on China’s forest carbon sinks, and the projected decline of future NPP may be significantly mitigated by the combining effects of climate change, atmospheric composition, and future afforestation and reforestation programs.
Implication of NPP on forest carbon sinks
This study only focused on predicting the changes of future forest NPP in China, which includes biomass increment and soil organic carbon accumulation due to foliage and fine root turnovers. The biomass carbon increment over a specific period (named as biomass carbon sink here) is different from biomass carbon stock, which refers to the total amount of stored carbon and can still increase after the peak of NPP. When only the biomass carbon increment is considered in the building of forest growth curves (Figure S4), similar declining trends were projected for the future forest biomass carbon sink predictions. It is estimated that the average forest biomass carbon sink would decrease by 8.9% ± 1.0% in 2050, 13.1% ± 1.3% in 2060, and 23.1% ± 2.1% in 2100 compared with that in 2021 (see supplemental information, Figures S5 and S6 for details). It should be noted that this calculation employs the average forest biomass carbon sink instead of the total value, as the available reference biomass carbon increment data only cover 64.6% of China’s forest areas. A regional forest carbon sink is determined by not only carbon gain through NPP but also carbon loss through heterotrophic respiration and disturbance.50 However, NPP is the major carbon cycle component affecting the future carbon sink trend because heterotrophic respiration, consuming mostly new soil organic matter,51,52 is closely proportional to NPP,52 which is the source of new soil organic matter, while disturbances are caused by sporadic weather events and human activities that could induce variable trends. Reforestation and afforestation in the future could also mitigate the projected declining trend of forest net carbon gain shown in Figure 5A. The intent of this study is not to determine the future trend of forest carbon sinks in China, but to quantify the possible large impacts of forest age structure on the future trend, which are so far under-studied and under-appreciated and could have profound implications on policies for achieving carbon neutrality.
Implication of the urgent need for sustainable forest management
Maintaining high levels of forest carbon sequestration is critical to mitigate future climate change through sustainable forest management.14 China has undertaken many projects related to sustainable forest management, with reforestation, natural forest management, and fire management contributing 73% of carbon sink enhancement among nine natural climate solutions from 2000 to 2020.11 In this study, China’s forest carbon sink is projected to weaken significantly in the near future due to the aging of forests. Optimizing forest age structure,38 through selective logging53 and improved afforestation/plantation taking into account forest biodiversity54 and carbon uptake capacity,55 could be effective solutions to maintain high levels of forest carbon sinks without sacrificing biodiversity and ecosystem functions. The projected changes and maps in China’s future carbon sinks at the spatial resolution of 30 m are expected to be highly useful for sustainable forest management and national policy development to achieve carbon neutrality in China by 2060.
Conclusion
This study predicted China’s forest carbon-absorbing capability from 2022 to 2100 based on its current forest age structure. It projects that China’s forests can maintain high carbon-absorbing capability for about 15 years. But, as the forests grow older, their carbon-absorbing capabilities could decrease by 5.0% ± 1.4% in 2050, 8.4% ± 1.6% in 2060, and 16.6% ± 2.8% in 2100, indicating weakened carbon sinks in the near future. Incorporating optimization of forest age structure into sustainable forest management strategies is therefore suggested to enhance China’s future forest carbon sink capacity. This may be achieved through selective logging and implementing new or improved afforestation.
Materials and methods
Building forest growth curves
A total of 3,121 forest field survey plots31 were used to build the forest growth curves, i.e., NPP-age relationships. Each plot provided information on forest cover type, age, and aboveground and belowground biomass. The forest NPP-age relationships among different forest types in six regions were modeled using a semi-empirical mathematical (SEM) model35 as follows:
| (Equation 1) |
where y is the forest age, NPP(y) is the forest NPP (see supplemental methods, Figure S7 and Table S1 for the details of calculating NPP from the field survey plots) at the age y, and a, b, c, and d are model parameters to be determined from observations. Figure S8 shows the forest NPP-age curves constructed for different forest types and regions across China based on the forest field survey plots. Comparison with other mathematical models reveals that the SEM model exhibits the best performance in capturing forest growth curves.56
Predicting NPP based on forest growth curves0
China’s forest annual NPPs at a 30 m resolution from 2022 to 2100 were predicted based on the NPP-age curves, forest standing age in 2021, reference NPP in 2021, and the merged forest cover type data (Figure S9).
| (Equation 2) |
where is the year, and are the forest age at the year of and 2021, and are the normalized forest NPP predicted by the NPP-age curves, and is the reference NPP. The normalization of each NPP-age curve was achieved by dividing it by the maximum NPP values in the curve. The reference NPP in 2021 at the 30 m spatial resolution (Figure 7) was downscaled from the 500 m MODIS NPP product using the near-infrared reflectance of vegetation (NIRv) as it correlates well with GPP and NPP.36,57 To reduce uncertainty, the 500 m MODIS NPP was calculated as the mean value () of MOD17A3HGF and MYD17A3HGF.
| (Equation 3) |
where is the 30 m NIRv calculated from Landsat data, and is the 500 m NIRv derived from 30 m NIRv using the cubic spline sampling.
Uncertainty analysis
The uncertainty of the predicted total forest NPP was the sum of uncertainties caused by forest growth curves, forest age, and forest cover types.
| (Equation 4) |
where is the uncertainty of the predicted global forest NPP, is the uncertainty caused by the reference NPP in 2021, is the uncertainty caused by the forest growth curve, is the uncertainty caused by forest age, and is the uncertainty caused by the forest cover type (see supplemental methods for details on calculating the four uncertainties). The contributions of the three components to the final uncertainty were calculated as the ratio between the uncertainty of each component and the final uncertainty. The uncertainty of the downscaled NPP in 2021 was not included because our main focus was on analyzing the relative changes compared with 2021. The average uncertainties across China’s forests over the 2022–2100 period were used for the trend analysis of the predicted forest NPP based on the current forest age structure.
Acknowledgments
We are very grateful to all who participated in the data preparation, processing, and analyses for this study. This work was supported by the National Natural Science Foundation of China (grant nos. 42101367 to R.S. and 42201360 to M.X.), Natural Science Foundation of Fujian Province (grant no. 2021J05041 to R.S.), Fujian Forestry Science and Technology Key Project (grant no. 2022FKJ03 to R.S.), and Open Fund Project of the Academy of Carbon Neutrality of Fujian Normal University (grant no. TZH2022-02 to R.S.).
Author contributions
R.S. designed the study with inputs from J.M.C. R.S. performed the analysis and wrote the manuscript with input from J.M.C., M.X., and W.J. X.L., P.L., G.Y., N.H., L.X., P.G., and H.L. contributed to the input data.
Declaration of interests
The authors declare no competing interests.
Published Online: September 16, 2023
Footnotes
It can be found online at https://doi.org/10.1016/j.xinn.2023.100515.
Lead contact website
Jing M. Chen (http://www.stearlab.com).
Supplemental information
References
- 1.Mallapaty S. How China could be carbon neutral by mid-century. Nature. 2020;586:482–483. doi: 10.1038/d41586-020-02927-9. [DOI] [PubMed] [Google Scholar]
- 2.Liu Z., Deng Z., He G., et al. Challenges and opportunities for carbon neutrality in China. Nat. Rev. Earth Environ. 2021;3:141–155. [Google Scholar]
- 3.Chen J.M. Carbon neutrality: Toward a sustainable future. Innovation. 2021;2:100127. doi: 10.1016/j.xinn.2021.100127. [DOI] [PMC free article] [PubMed] [Google Scholar]
- 4.Chen J.M., Ju W., Ciais P., Viovy N., Liu R., Liu Y., Lu X. Vegetation structural change since 1981 significantly enhanced the terrestrial carbon sink. Nat. Commun. 2019;10:4259–4267. doi: 10.1038/s41467-019-12257-8. [DOI] [PMC free article] [PubMed] [Google Scholar]
- 5.Wang S., Zhang Y., Ju W., Chen J.M., Ciais P., Cescatti A., Sardans J., Janssens I.A., Wu M., Berry J.A., Campbell E., Fernández-Martínez M., Alkama R., Sitch S., Friedlingstein P., Smith W.K., Yuan W., He W., Lombardozzi D., Kautz M., Zhu D., Lienert S., Kato E., Poulter B., Sanders T.G.M., Krüger I., Wang R., Zeng N., Tian H., Vuichard N., Jain A.K., Wiltshire A., Haverd V., Goll D.S., Peñuelas J. Recent global decline of CO2 fertilization effects on vegetation photosynthesis. Science. 2020;370:1295–1300. doi: 10.1126/science.abb7772. [DOI] [PubMed] [Google Scholar]
- 6.Jiang F., Chen J.M., Zhou L., Ju W., Zhang H., Machida T., Ciais P., Peters W., Wang H., Chen B., Liu L., Zhang C., Matsueda H., Sawa Y. A comprehensive estimate of recent carbon sinks in China using both top-down and bottom-up approaches. Sci. Rep. 2016;6:22130. doi: 10.1038/srep22130. [DOI] [PMC free article] [PubMed] [Google Scholar]
- 7.Schuh A.E., Byrne B., Jacobson A.R., Crowell S.M.R., Deng F., Baker D.F., Johnson M.S., Philip S., Weir B. On the role of atmospheric model transport uncertainty in estimating the Chinese land carbon sink. Nature. 2022;603:E13–E14. doi: 10.1038/s41586-021-04258-9. [DOI] [PubMed] [Google Scholar]
- 8.Wang Y., Wang X., Wang K., Chevallier F., Zhu D., Lian J., He Y., Tian H., Li J., Zhu J., Jeong S., Canadell J.G. The size of the land carbon sink in China. Nature. 2022;603:E7–E9. doi: 10.1038/s41586-021-04255-y. [DOI] [PubMed] [Google Scholar]
- 9.Wang J., Feng L., Palmer P.I., Liu Y., Fang S., Bösch H., O'Dell C.W., Tang X., Yang D., Liu L., Xia C. Large Chinese land carbon sink estimated from atmospheric carbon dioxide data. Nature. 2020;586:720–723. doi: 10.1038/s41586-020-2849-9. [DOI] [PubMed] [Google Scholar]
- 10.Piao S., He Y., Wang X., et al. Estimation of China’s terrestrial ecosystem carbon sink: Methods, progress and prospects. Sci. China Earth Sci. 2022;65:641–651. [Google Scholar]
- 11.Lu N., Tian H., Fu B., Yu H., Piao S., Chen S., Li Y., Li X., Wang M., Li Z., Zhang L., Ciais P., Smith P. Biophysical and economic constraints on China’s natural climate solutions. Nat. Clim. Change. 2022;12:847–853. [Google Scholar]
- 12.Chen Y., Feng X., Tian H., Wu X., Gao Z., Feng Y., Piao S., Lv N., Pan N., Fu B. Accelerated increase in vegetation carbon sequestration in China after 2010: A turning point resulting from climate and human interaction. Global Change Biol. 2021;27:5848–5864. doi: 10.1111/gcb.15854. [DOI] [PubMed] [Google Scholar]
- 13.Xu B., Guo Z., Piao S., et al. Biomass carbon stocks in China's forests between 2000 and 2050: A prediction based on forest biomass-age relationships. Sci. China Life Sci. 2010;53:776–783. doi: 10.1007/s11427-010-4030-4. [DOI] [PubMed] [Google Scholar]
- 14.Huang Y., Sun W., Qin Z., Zhang W., Yu Y., Li T., Zhang Q., Wang G., Yu L., Wang Y., Ding F., Zhang P. The role of China's terrestrial carbon sequestration 2010–2060 in offsetting energy-related CO2 emissions. Natl. Sci. Rev. 2022;9:nwac057. doi: 10.1093/nsr/nwac057. [DOI] [PMC free article] [PubMed] [Google Scholar]
- 15.Pan Y., Luo T., Birdsey R., Hom J., Melillo J. New estimates of carbon storage and sequestration in China's forests: Effects of age-class and method on inventory-based carbon estimation. Clim. Change. 2004;67:211–236. [Google Scholar]
- 16.Tang J., Luyssaert S., Richardson A.D., Kutsch W., Janssens I.A. Steeper declines in forest photosynthesis than respiration explain age-driven decreases in forest growth. Proc. Natl. Acad. Sci. USA. 2014;111:8856–8860. doi: 10.1073/pnas.1320761111. [DOI] [PMC free article] [PubMed] [Google Scholar]
- 17.Ryan M.G., Binkley D., Fownes J.H. Age-related decline in forest productivity: pattern and process. Adv. Ecol. Res. 1997;27:213–262. [Google Scholar]
- 18.Ryan M.G., Binkley D., Fownes J.H., Giardina C.P., Senock R.S. An experimental test of the causes of forest growth decline with stand age. Ecol. Monogr. 2004;74:393–414. [Google Scholar]
- 19.Ryan M.G., Waring R.H. Maintenance respiration and stand development in a subalpine lodgepole pine forest. Ecology. 1992;73:2100–2108. [Google Scholar]
- 20.Drake J.E., Davis S.C., Raetz L.M., et al. Mechanisms of age-related changes in forest production: the influence of physiological and successional changes. Global Change Biol. 2011;17:1522–1535. [Google Scholar]
- 21.Bryan B.A., Gao L., Ye Y., Sun X., Connor J.D., Crossman N.D., Stafford-Smith M., Wu J., He C., Yu D., Liu Z., Li A., Huang Q., Ren H., Deng X., Zheng H., Niu J., Han G., Hou X. China’s response to a national land-system sustainability emergency. Nature. 2018;559:193–204. doi: 10.1038/s41586-018-0280-2. [DOI] [PubMed] [Google Scholar]
- 22.Zhang Y., Yao Y., Wang X., Liu Y., Piao S. Mapping spatial distribution of forest age in China. Earth Space Sci. 2017;4:108–116. [Google Scholar]
- 23.Zhang C., Ju W., Chen J.M., Li D., Wang X., Fan W., Li M., Zan M. Mapping forest stand age in China using remotely sensed forest height and observation data. J. Geophys. Res. Biogeosci. 2014;119:1163–1179. [Google Scholar]
- 24.Goulden M.L., Mcmillan A.M.S., Winston G.C., Rocha A.V., Manies K.L., Harden J.W., Bond-Lamberty B.P. Patterns of NPP, GPP, respiration, and NEP during boreal forest succession. Global Change Biol. 2011;17:855–871. [Google Scholar]
- 25.Yu G., Chen Z., Piao S., Peng C., Ciais P., Wang Q., Li X., Zhu X. High carbon dioxide uptake by subtropical forest ecosystems in the East Asian monsoon region. Proc. Natl. Acad. Sci. USA. 2014;111:4910–4915. doi: 10.1073/pnas.1317065111. [DOI] [PMC free article] [PubMed] [Google Scholar]
- 26.Sun L., Wang Q., Fan X. An Integrative Approach to Study How Driving Factors Control Biomass Carbon Density for Natural Mountain Forests China’s Loess Plateau. Forests. 2022;13:1114. [Google Scholar]
- 27.Besnard S., Koirala S., Santoro M., Weber U., Nelson J., Gütter J., Herault B., Kassi J., N'Guessan A., Neigh C., Poulter B., Zhang T., Carvalhais N. Mapping global forest age from forest inventories, biomass and climate data. Earth Syst. Sci. Data. 2021;13:4881–4896. [Google Scholar]
- 28.Zhu Z., Zhang J., Yang Z., Aljaddani A.H., Cohen W.B., Qiu S., Zhou C. Continuous monitoring of land disturbance based on Landsat time series. Remote Sens. Environ. 2020;238:111116. [Google Scholar]
- 29.Liu X., Su Y., Hu T., Yang Q., Liu B., Deng Y., Tang H., Tang Z., Fang J., Guo Q. Neural network guided interpolation for mapping canopy height of China's forests by integrating GEDI and ICESat-2 data. Remote Sens. Environ. 2022;269:112844. [Google Scholar]
- 30.Lin X., Shang R., Chen J.M., Zhao G., Zhang X., Huang Y., Yu G., He N., Xu L., Jiao W. High-resolution forest age mapping based on forest height maps derived from GEDI and ICESat-2 space-borne lidar data. Agric. For. Meteorol. 2023;339:109592. [Google Scholar]
- 31.Tang X., Zhao X., Bai Y., Tang Z., Wang W., Zhao Y., Wan H., Xie Z., Shi X., Wu B., Wang G., Yan J., Ma K., Du S., Li S., Han S., Ma Y., Hu H., He N., Yang Y., Han W., He H., Yu G., Fang J., Zhou G. Carbon pools in China's terrestrial ecosystems: New estimates based on an intensive field survey. Proc. Natl. Acad. Sci. USA. 2018;115:4021–4026. doi: 10.1073/pnas.1700291115. [DOI] [PMC free article] [PubMed] [Google Scholar]
- 32.Schumacher J., Hauglin M., Astrup R., et al. Mapping forest age using National Forest Inventory, airborne laser scanning, and Sentinel-2 data. For. Ecosyst. 2020;7:60. [Google Scholar]
- 33.Frate L., Carranza M.L., Garfì V., et al. Spatially explicit estimation of forest age by integrating remotely sensed data and inverse yield modeling techniques. iForest. 2016;9:63–71. [Google Scholar]
- 34.Maltman J.C., Hermosilla T., Wulder M.A., Coops N.C., White J.C. Estimating and mapping forest age across Canada's forested ecosystems. Remote Sens. Environ. 2023;290:113529. [Google Scholar]
- 35.He L., Chen J.M., Pan Y., Birdsey R., Kattge J. Relationships between net primary productivity and forest stand age in U.S. forests. Global Biogeochem. Cycles. 2012;26:GB3009. [Google Scholar]
- 36.Wang S., Zhang Y., Ju W., Qiu B., Zhang Z. Tracking the seasonal and inter-annual variations of global gross primary production during last four decades using satellite near-infrared reflectance data. Sci. Total Environ. 2021;755:142569. doi: 10.1016/j.scitotenv.2020.142569. [DOI] [PubMed] [Google Scholar]
- 37.Chen C., Riley W.J., Prentice I.C., et al. CO2 fertilization of terrestrial photosynthesis inferred from site to global scales. Proc. Natl. Acad. Sci. USA. 2022;119 doi: 10.1073/pnas.2115627119. e2115627119. [DOI] [PMC free article] [PubMed] [Google Scholar]
- 38.Zhu K., Song Y., Qin C. Forest age improves understanding of the global carbon sink. Proc. Natl. Acad. Sci. USA. 2019;116:3962–3964. doi: 10.1073/pnas.1900797116. [DOI] [PMC free article] [PubMed] [Google Scholar]
- 39.Odum E.P. The Strategy of Ecosystem Development: An understanding of ecological succession provides a basis for resolving man's conflict with nature. Science. 1969;164:262–270. doi: 10.1126/science.164.3877.262. [DOI] [PubMed] [Google Scholar]
- 40.Kira T., Shidei T. Primary production and turnover of organic matter in different forest ecosystems of the western Pacific. Jpn. J. Ecol. (Tokyo) 1967;17:70–87. [Google Scholar]
- 41.Camenzind T., Hättenschwiler S., Treseder K.K., Lehmann A., Rillig M.C. Nutrient limitation of soil microbial processes in tropical forests. Ecol. Monogr. 2018;88:4–21. [Google Scholar]
- 42.Fisher J.B., Badgley G., Blyth E. Global nutrient limitation in terrestrial vegetation. Global Biogeochem. Cycles. 2012;26:GB3007. [Google Scholar]
- 43.Gao B., Taylor A.R., Searle E.B., Kumar P., Ma Z., Hume A.M., Chen H.Y.H. Carbon storage declines in old boreal forests irrespective of succession pathway. Ecosystems. 2018;21:1168–1182. [Google Scholar]
- 44.Gough C.M., Vogel C.S., Schmid H.P., et al. Controls on annual forest carbon storage: lessons from the past and predictions for the future. Bioscience. 2008;58:609–622. [Google Scholar]
- 45.Luyssaert S., Schulze E.D., Börner A., Knohl A., Hessenmöller D., Law B.E., Ciais P., Grace J. Old-growth forests as global carbon sinks. Nature. 2008;455:213–215. doi: 10.1038/nature07276. [DOI] [PubMed] [Google Scholar]
- 46.Gundersen P., Thybring E.E., Nord-Larsen T., Vesterdal L., Nadelhoffer K.J., Johannsen V.K. Old-growth forest carbon sinks overestimated. Nature. 2021;591:E21–E23. doi: 10.1038/s41586-021-03266-z. [DOI] [PubMed] [Google Scholar]
- 47.Gao S., Zhou T., Zhao X., Wu D., Li Z., Wu H., Du L., Luo H. Age and climate contribution to observed forest carbon sinks in East Asia. Environ. Res. Lett. 2016;11:034021. [Google Scholar]
- 48.Piao S., Friedlingstein P., Ciais P., Viovy N., Demarty J. Growing season extension and its impact on terrestrial carbon cycle in the Northern Hemisphere over the past 2 decades. Global Biogeochem. Cycles. 2007;21:GB3018. [Google Scholar]
- 49.De Kauwe M.G., Keenan T.F., Medlyn B.E., Prentice I.C., Terrer C. Satellite based estimates underestimate the effect of CO2 fertilization on net primary productivity. Nat. Clim. Change. 2016;6:892–893. [Google Scholar]
- 50.Chen J.M., Ju W., Cihlar J., Price D., Liu J., Chen W., Pan J., Black A., Barr A. Spatial distribution of carbon sources and sinks in Canada's forests. Tellus Ser. B Chem. Phys. Meteorol. 2003;55:622–641. [Google Scholar]
- 51.Thompson M.V., Randerson J.T., Malmström C.M., et al. Change in net primary production and heterotrophic respiration: How much is necessary to sustain the terrestrial carbon sink? Global Biogeochem. Cycles. 1996;10:711–726. [Google Scholar]
- 52.Chapin F.S., III, Matson P.A., Mooney H.A. Springer Science & Business Media; 2002. Principles of Terrestrial Ecosystem Ecology. [Google Scholar]
- 53.Tobias J.A. Hidden impacts of logging. Nature. 2015;523:163–164. doi: 10.1038/523163a. [DOI] [PubMed] [Google Scholar]
- 54.Chen S., Wang W., Xu W., Wang Y., Wan H., Chen D., Tang Z., Tang X., Zhou G., Xie Z., et al. Plant diversity enhances productivity and soil carbon storage. Proc. Natl. Acad. Sci. USA. 2018;115:4027–4032. doi: 10.1073/pnas.1700298114. [DOI] [PMC free article] [PubMed] [Google Scholar]
- 55.Hulvey K.B., Hobbs R.J., Standish R.J., Lindenmayer D.B., Lach L., Perring M.P. Benefits of tree mixes in carbon plantings. Nat. Clim. Change. 2013;3:869–874. [Google Scholar]
- 56.Li P., Shang R., Chen J.M., et al. Evaluation of five models for constructing forest NPP-age relationships in China based on 3121 field survey samples. Biogeosci. Discuss. 2023;2023:1–22. [Google Scholar]
- 57.Badgley G., Anderegg L.D.L., Berry J.A., et al. Terrestrial gross primary production: Using NIRV to scale from site to globe. Global Change Biol. 2019;25:3731–3740. doi: 10.1111/gcb.14729. [DOI] [PubMed] [Google Scholar]
- 58.Nan X., Li A., Deng W. A Big Earth Data Platform for Three Poles. 2022. Data set of "Digital Mountain Map of China". [Google Scholar]
Associated Data
This section collects any data citations, data availability statements, or supplementary materials included in this article.