Abstract
Obsessive–compulsive disorder (OCD) is associated with multi-nodal abnormalities in brain networks, characterized by recurrent intrusive thoughts (obsessions) and repetitive behaviours or mental acts (compulsions), which might manifest as pathological low-frequency oscillations in the frontal EEG and low-frequency bursting firing patterns in the subthalamus nucleus (STN). Abnormalities in the cortical-striatal-thalamic-cortical (CSTC) loop, including dysregulation of serotonin, dopamine, and glutamate systems, are considered to contribute to certain types of OCD. Here, we extend a biophysical computational model to investigate the effect of orbitofronto-subcortical loop abnormalities on network oscillations. Particularly, the OCD lesion process is simulated by the loss of connectivity from striatal parvalbumin interneurons (PV) to medium spiny neurons (MSNs), excessive activation to the hyperdirect pathway, and high dopamine concentrations. By calculating low-frequency oscillation power in the STN, STN burst index, and average firing rates levels of the cortex and thalamus, we demonstrate that the model can explain the pathology of glutamatergic and dopamine system dysregulation, the effects of pathway imbalance, and neuropsychiatric treatment in OCD. In addition, results indicate the abnormal brain rhythms caused by the dysregulation of orbitofronto-subcortical loop may serve as a biomarker of OCD. Our studies can help to understand the cause of OCD, thereby facilitating the diagnosis of OCD and the development of new therapeutics.
Keywords: Obsessive–compulsive disorder, Oscillations, Striatum, The subthalamic nucleus, Deep brain stimulation
Introduction
Obsessive–compulsive disorder (OCD) is a chronic psychiatric systemic disorder that mainly clinically manifests intrusive obsessive thoughts and iterative compulsive behaviours. In OCD, converging clinical, biochemical, neuroimaging, and postmortem evidence indicate that serotonergic, dopaminergic, or glutamatergic dysfunction may contribute to the pathogenesis of the obsessive–compulsive disorder, which leads to the emergence of pathological hyperconnectivity in the ventromedial cortico-basal ganglia-thalamo-cortical neural loop and increase of theta synchronization in the ventral subthalamic nucleus (Welter et al. 2011; Wojtecki et al. 2017). However, little is known about the changes in the morphological properties in the relevant circuit during OCD, which makes the pathology of OCD unclear. It is currently thought to be the result of a combination of genetic, environmental, and other factors. Nowadays, the pathophysiology of OCD is considered to be the altered brain structure and overactivity of the frontal cortico-striatal-thalamocortical circuits (Menzies et al. 2008; Vaghi et al. 2017).
There is increased evidence that orbitofrontal cortex is a critical substrate. The orbitofrontal cortex (OFC) is consistently involved in reward learning, social tasks, and emotional processes (Frank and Claus 2006). In early PET studies, the hypermetabolism in the orbitofrontal cortex has repeatedly been present in patients with OCD compared to healthy controls, which could lead to impaired action-outcome monitoring (S. Saxena et al. 2002; van den Heuvel et al. 2016). Structurally, smaller OFC volumes are also reported in voxel-based morphometry (VBM) studies in OCD (Nakao et al. 2014; Rotge et al. 2009). Further evidence for OFC involvement in OCD comes from that repetitive optogenetic stimulation activating the OFC-ventromedial striatum pathway can produce repetitive behaviours (Ahmari et al. 2013), which is one of the symptoms of OCD patients (Burguière et al. 2013). These results provide strong support that the OFC plays a crucial role in the neuropathology of OCD and can cause OCD symptoms.
Though much translational work has focused on the abnormal structure and function of OFC, findings in basal ganglia and thalamus, particularly within the striatum, reveal that basal ganglia and thalamus dysfunction underlie the obsessive–compulsive disorder. Onset symptoms of OCD occur after injury to basal ganglia structures (Stein 2002). Imaging studies have demonstrated that the basal ganglia serve a gating function, which is consistent with the study that imbalanced basal ganglia activity can induce repetitive routines (Graybiel and Rauch 2000). The reduced striatal volumes and increased thalamic volumes have been reported in OCD which showed significant recovery in volumes after the successful treatment of serotonergic medications selective serotonin-reuptake inhibitors (SSRI) (van den Heuvel et al. 2016). The thalamus associated with relay and integrative ability shows higher activation in patients with OCD compared to healthy controls (Saxena et al. 1998). Meanwhile, elevated dopamine concentration in the striatum plays a vital role in the brain network dynamics dysfunctions that point to obsessive–compulsive disorder (De Haas et al. 2011; Denys et al. 2004b). Furthermore, the increased striatal medial spiny neurons activity and decreased number of the parvalbumin interneurons were observed in SAPAP3 knockout (SAPAP3-KO) grooming mice (the most widely used preclinical model in OCD research, and SAPAP3 is a gene candidate for OCD risks) (Monteiro and Feng 2016a, b; Xu et al. 2016).
A convergence of research points to the involvement of the cortical-striatal-thalamocortical circuit in OCD pathology. Current views of loop connections are that striatal output reaches the thalamus via a “direct” pathway and an “indirect” pathway (Smith et al. 1998). In primates, projections from the orbitofrontal cortex are concentrated at the level of the ventral striatum, which then directly projects to the dorsomedial part of the internal segment of the globus pallidus (GPi), and the rostral region of the substantia nigra pars reticulata (SNr), which is connected to the mediodorsal nucleus of the thalamus (MD). The pathway is known as the “direct” pathway. The “indirect” pathway involves subregions, such as the ventral pallidum and subthalamic nuclei with bi-directional recurrent projections. Striatal MSNs in the “direct” pathway express excitatory D1 dopamine receptors, and MSNs express D2 in the “indirect” pathway. Recent research concludes that the fibres projecting from the orbitofrontal cortex to the limbic STN are components of “hyperdirect” pathway (Janssen et al. 2017). Abnormal striatal and STN activities cause imbalances between the “direct” and “indirect” pathways in basal ganglia resulting in disruption of information processing, responding with dysfunctions of the cortex, especially the orbitofrontal cortex observed in OCD patients (Saxena et al. 1998). For a long, scientists only focused on the clinical aspects of OCD. However, the alteration of pathway balance in OCD seems to reflect the principle of the network rather than the lesion of a particular brain area. Based on lines of evidence mentioned above, we hypothesize that the imbalance of the frontal cortico-striatal-thalamocortical circuit results in obsession and compulsion.
In line with this hypothesis, in addition to circuitry abnormality, single-neuron and local field potential recordings in patients are providing insight into the cellular and synaptic dysfunction of OCD. Previous intraoperative recordings of STN neurons have found burst and oscillation occurred predominantly in the low-frequency band in OCD patients (Welter et al. 2011). In that study, the severity and clinical improvements of deep brain stimulation were associated with the STN neuronal activity. Especially, patients with higher intra-burst frequency had the best clinical outcome. The same study also suggests that STN neurons display less frequent but longer bursts, increased burst activity in OCD, which possibly cause an inability in decision making, finally result in obsession and compulsion. Compared to Parkinson's patients, Rappel also reported enhanced theta activity in ventromedial STN in OCD patients, related to cognitive functions (Rappel et al. 2018).
Based on a recent consensus guideline on neurosurgery in psychiatry, deep brain stimulation was proposed as a therapeutic option to treat refractory obsessive–compulsive disorder. Although less is known about the mechanisms in the effect of DBS, potential explanations may include neuronal effects and disruption of electrical pathological oscillation and synaptic plasticity as well. The STN is a well-known target for Parkinson’s disease, similarly as an exciting target for patients of OCD. A considerable amount of double-blind studies of STN-DBS performed that DBS recovered the imbalance between the direct and indirect pathways, marked reduction in theta synchronization and alleviated symptoms of OCD patients, but its pathophysiological mechanism is limited (De Koning et al. 2011; Figee et al. 2014; Parolari et al. 2020; Schwabe et al. 2021; Welter et al. 2011).
The wealth of aggregated evidence indicates that computational modelling can integrate various types of data pointed to special mechanisms, test the dynamic hypothesis, provide a new perspective on OCD pathogenesis based on model-derived hypothesis. Here we present a biophysical frontal cortico-striatal-thalamocortical computational model based on realistic network connectivity and dynamics and investigate the impact of striatal connectivity, hyperdirect pathway, and dopamine concentration, as well as the treatment of deep brain stimulation. A combination of neurophysiological (DBS), animal models (genetic technologies and optogenetics) and neuroimaging (diffusion tensor imaging [DTI] and functional magnetic resonance imaging [fMRI]) approaches may be capable of distinguishing neural circuit abnormalities in OCD patients that differ from normal individuals, contributing to the diagnosis and treatment of OCD and the development of new therapies.
Materials and methods
To test our hypothesis, we propose a simplified, deterministic frontal cortico-striatal-thalamocortical model (Fig. 1), which consists of the orbitofrontal cortex (OFC), the ventral striatum D1 medium spiny neuron (STR-D1), the ventral striatum D2 medium spiny neuron (STR-D2), the ventral striatum parvalbumin fast-spiking interneuron (PV-FSI), the substantia nigra pars reticulata (SNR), the ventral pallidum (VP), the anterior subthalamic nucleus (STN), and dorsomedial thalamus (MDTH) interconnected with model synapses. Studies have shown that these nuclei are connected and serve an essential role in OCD. To better understand the biophysical firing patterns and connections, a brief summary can be obtained in Table 1.
Fig. 1.
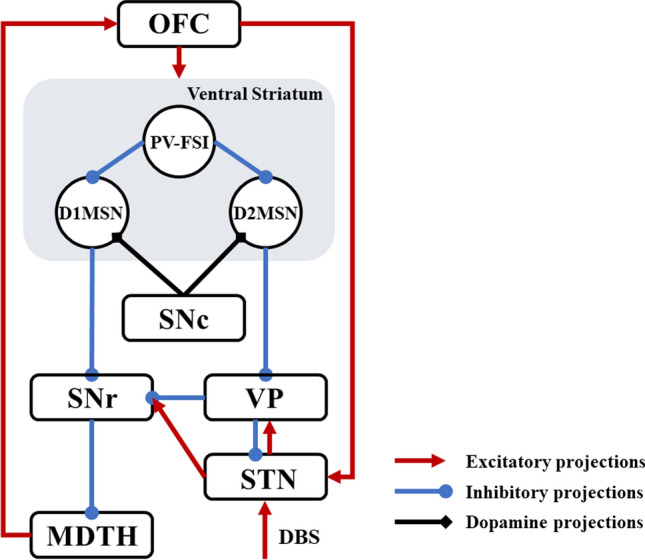
A simplified architecture of the frontal cortico-striatal-thalamocortical model with OFC, PV-FSI, STR-D1, STR-D2, SNr, VP, STN and MDTH. The inhibitory connections are represented by the blue lines with rounds, the excitatory connections by red lines with arrows. The black diamonds lines show the modulatory effect of dopamine
Table 1.
The biophysical firing rates and connections of nuclei of the network
| Nucleus | Firing rate (s−1) | Biophysical connections | References |
|---|---|---|---|
| TH | 10–20 | TH → OFC | Haber and Calzavara (2009) |
| STN | 15–30 | STN → VP, STN → SNr | Parolari et al. (2020) |
| VP | 40–70 | VP → SNr, VP → STN | Grabli et al. (2004), Wu et al. (2015) |
| SNr | 50–70 | SNr → TH | Smith et al. (1998) |
| D1MSN | 4–7 | STR-D1 → SNr | Bouchekioua et al. (2018) |
| D2MSN | 4–7 | STR-D2 → VP | Humphries and Prescott (2010) |
| PV-FSI | 20–70 |
PV-FSI → STR-D1 PV-FSI → STR-D2 |
Monteiro and Feng (2016a, b), Pisansky et al. (2019) Gittis et al. (2010), Pisansky et al. (2019), Wu et al. (2017) |
| PY | 5–20 |
PY → IN PY → STN PY → PV-FSI PY → STR-D1 PY → STR-D2 |
Mccracken and Grace (2007) Péron et al. (2013) Burguière et al. (2013) Ahmari et al. (2013) Rauch (2013) |
| IN | 20–60 | IN → PY | Izhikevich and Edelman (2008), Mccracken and Grace (2007) |
Each compartment contains 100 Izhikevich hybrid neurons, and their membrane potentials are as follows:
| 1 |
| 2 |
with the after-spike resetting equation being as:
| 3 |
where is the membrane voltage is the recovery variable, is the incoming synaptic currents, is the external input current; is a recovery time constant, while , and represent the sensitivity of recovery variable , the voltage reset and the after-spike membrane recovery variable reset, respectively; Different types of neurons could be defined by different values of , , and (Izhikevich 2004). Parameters for each nucleus were given in Table 2.
Table 2.
Izhikevich parameters of network neurons
| Nucleus | a | b | c | d | Iext |
|---|---|---|---|---|---|
| TH | 0.005 | 0.23 | − 65 | 0.45 | 7 |
| STN | 0.005 | 0.265 | − 65 | 2 | 7 |
| VP | 0.005 | 0.585 | − 65 | 4 | 12 |
| SNr | 0.005 | 0.32 | − 65 | 2 | 1 |
| STR-D1 | 0.02 | 0.2 | − 65 | 8 | − 18 |
| STR-D2 | 0.02 | 0.2 | − 65 | 8 | − 2 |
| PV-FSI | 0.1 | 0.2 | − 65 | 8 | 4 |
| PY | 0.02 | 0.2 | − 65 | 8 | 1 |
| IN | 0.1 | 0.2 | − 65 | 2 | 4 |
Orbitofrontal cortex model neuron
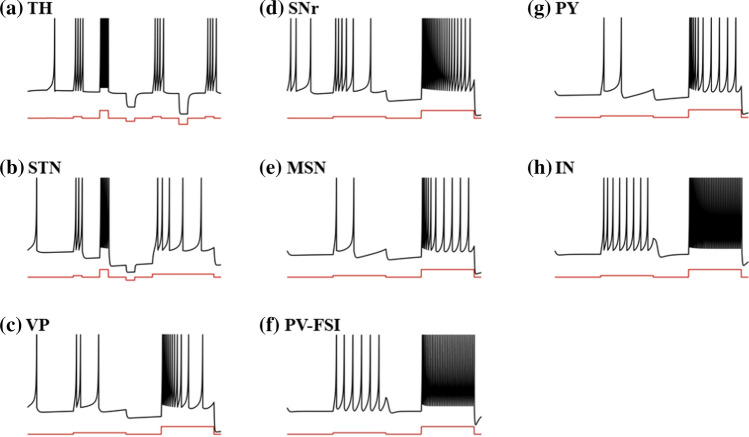
The cortical network comprises reciprocally connected pyramidal regular spiking excitatory neurons (Fig. 2g), which we called OFC neurons in our study, and fast-spiking inhibitory interneurons (Fig. 2h). The denotes the network connectivity between the thalamus and excitatory neurons in the orbitofrontal cortex. Also, excitatory neurons receive projections from adjacent OFC regular spiking excitatory neurons and fast-spiking inhibitory interneurons . The fast-spiking interneurons in the OFC are not only excited by regular spiking neurons , but also inhibited by other OFC interneurons (Humphries et al. 2009; Konstantoudaki et al. 2014). represents the external input. Each neuron in two OFC populations obeys the following equations:
| 4 |
| 5 |
Fig. 2.
Single neuronal firing characteristics of the model. a Thalamus neuron. b Subthalamic nucleus neuron. c Ventral pallidum neuron. d Substantia nigra pars reticulata neuron. e Medium spiny neuron in Striatum. f Parvalbumin fast-spiking interneuron in Striatum. g Pyramidal neuron in the orbitofrontal cortex. h Interneuron in the orbitofrontal cortex. The black line represents the neuronal membrane potential, and the red line represents the applied input
Striatum model neuron
The striatum is divided into three populations: D1-medium spiny neurons (D1-MSNs), D2- medium spiny neurons (D2-MSNs), parvalbumin fast-spiking interneurons (PV-FSIs). MSN is split into two clusters modulated by different major dopamine receptor types, which express D1 receptors in the direct pathway and D2 receptors in the indirect pathway (Gittis et al. 2010). In the model, we distinguish between D1-MSNs and D2-MSNs by different current coupling and dopamine modulation, which is consistent with D2-MSNs being more excitable in the experiment (Gruber et al. 2003; Humphries et al. 2009). In order for the balance between the direct pathway and the indirect pathway, D1-MSNs and cortical neurons should have stronger coupling to receive higher excitatory inputs (Bahuguna et al. 2015; Gertler et al. 2008). Besides, some parvalbumin neurons in the striatum showed fast-firing patterns based on data from several mammalian species (Xu et al. 2016). The MSNs receive not only cortical excitatory effects but also inhibitory effects , from the PV-FSIs and other neurons in the same cluster. As for PV-FSIs, they respond not only to cortical excitability but also electrical synapses from other PV-FSIs expressed in the equation as , (Wu et al. 2017). The MSN increases the response under the depolarization input (Fig. 2e). At the same time, PV-FSI exhibits rapid firing (Fig. 2f). The membrane potentials , , of D1-MSNs, D2-MSNs and PV-FSIs are calculated as follows:
| 6 |
| 7 |
| 8 |
Ventral pallidum model neuron
The ventral pallidum neuron receives excitatory projections from the ventral STN and axonal lateral branching inhibitory projections from other ventral pallidum neurons . Most inhibitory projections are from striatal D2-MSNs , accounting for 80–90% of the projections in the ventral pallidum. VP model is initially active and has a reduced hyperpolarization response (Fig. 2c). The membrane potential of ventral pallidum neurons is calculated as:
| 9 |
Subthalamic nucleus model neuron
The subthalamic nucleus was modelled previously as an irregular firing model with firing rates around 20 Hz, consistent with what was observed in vivo (van Albada and Robinson 2009; Yu et al. 2021). The STN received VP inhibition and STN excitation (Ebert et al. 2014; Gillies and Willshaw 1998; Shen and Johnson 2006). It also receives excitatory projections from the orbitofrontal cortex , often referred to as the hyperdirect pathway. represented the input of deep brain stimulation, in the form of an additional current, which will be mentioned later in detail. The response of the STN model after continuous depolarization is high-frequency tonic firing and a rest period when a depolarization current is applied. In addition, the model will trigger a rebound burst with a sufficient hyperpolarization reaction (Fig. 2b). The membrane potential of subthalamic nucleus neurons is calculated as:
| 10 |
Substantia nigra pars reticulata model neuron
Substantia nigra pars reticulata is the central output nucleus of the limbic basal ganglia. , , , are the synaptic input from ventral pallidum, striatal D1-MSNs, subthalamic nucleus, and substantia nigra pars reticulata, respectively, where D1-MSNs to SNr is a strong projection. Figure 2d shows the dynamics of a single neuron of SNr, similar to VP neuron, but with a higher rate of firing. The membrane potential of substantia nigra pars reticulata neurons is calculated as:
| 11 |
Thalamus model neuron
Each thalamus neuron receives inhibitions from substantia nigra pars reticulata and excitatory interactions from other neurons in the thalamus population. In tonic mode, the firing rate of the Thalamus neuron increases with the larger depolarization current. In burst mode, when subjected to a continuous hyperpolarization input, the response of the model neurons is a bursting period, depending on the intensity and duration of the current applied (Fig. 2a). The membrane potential of thalamus neurons is calculated as follows:
| 12 |
Loop model
The network has sparse and deterministic connectivity. As shown in Fig. 3, each TH neuron receives inhibitory inputs from five SNr neurons and excitatory inputs from the nearest two TH neurons. Each STN neuron receives two GPe inhibitory projections. At the same time, each GPe neuron receives inhibitory inputs from two immediate neighbouring GPe neurons and five D2-MSN neurons, in addition to excitatory inputs from two STN neurons. Furthermore, each SNr neuron receives inhibitory inputs from not only two GPe neurons and five D1-MSN neurons but also excitatory inputs from two STN neurons, in addition to suppression inputs from the nearest two SNr neurons. Actually, striatum PV fast-spiking neurons have greater connectivity with D1-MSNs (Monteiro and Feng 2016a, b), so in our model, each D1-MSN neuron receives two inhibitory inputs from two striatal FSI neurons, with half of them projecting to D2-MSN. Striatum neurons also perform inhibitory projections to the nearest two neurons. Finally, OFC consists of regular spiking excitatory neurons and fast-spiking inhibitory interneurons. Each OFC neuron sends excitatory projects to two STN, D1-MSN, D2-MSN, PV-FSI, OFC interneurons, and three OFC neurons, while receiving the inhibitory signal from two OFC interneurons. The closed-loop circuit is designed by setting up excitatory projections from two TH neurons to each OFC neuron (Table 3).
Fig. 3.
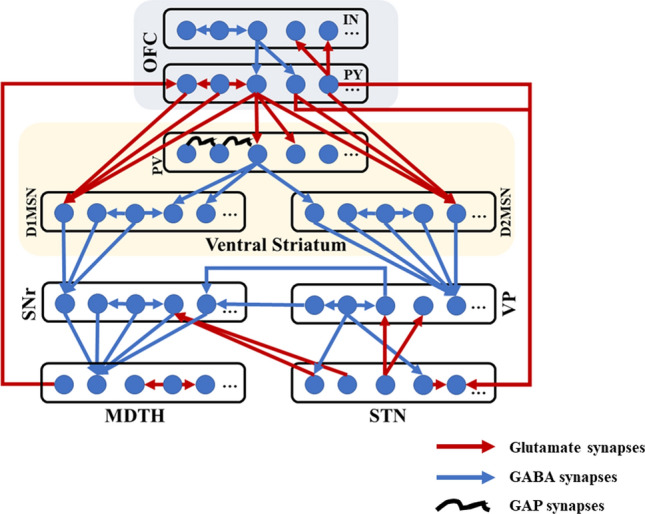
Structure of the frontal cortico-striatal-thalamocortical model with sparse connections. The network comprises nine nuclei with 100 cells in each population, of which only five are shown in the figure. Excitatory glutamate and inhibitory GABA synaptic connections within the network are represented as red arrows and blue arrows. The black curves show the modulatory effect of gap synapses
Table 3.
Connections between nucleus
| From → to connections | From → to connections |
|---|---|
| 1 PY → 2 IN | 1 PY → 3 STR-D1 |
| 1 PY → 2 FSI | 1 PY → 3 STR-D2 |
| 2 PY → 1 STN | 1 PY → 2 PY |
| 1 TH → 1 PY | 1 IN → 2 PY |
| 1 IN → 2 IN | 1 FSI → 2 FSI |
| 1 FSI → 2 STR-D1 | 1 FSI → 1 STR-D2 |
| 1 STR-D1 → 2 STR-D1 | 1 STR-D2 → 2 STR-D2 |
| 3 STR-D1 → 1 SNr | 5 STR-D2 → 1 VP |
| 1 SNr → 2 SNr | 5 SNr → 1 TH |
| 2 VP → 1 SNr | 2 STN → 1 SNr |
| 1 VP → 2 VP | 1 STN → 2 VP |
| 1 STN → 1 STN | 1 VP → 2 STN |
| 1 TH → 2 TH |
Neurons are connected to the nearest neuron according to the topography
Synaptic inputs
In this network, the total synaptic currents are given by three chemical synapses by using different exponents: fast excitatory AMPA, slow excitatory NMDA, and fast inhibitory GABA.
| 13 |
| 14 |
where , , are the current of AMPA-, NMDA-, GABA-type synapses, and is the equilibrium concentration of magnesium ions.
The chemical synaptic current from the neuron to the neuron could be expressed as:
| 15 |
where describes the strength of synaptic connectivity from neuron to neuron, and represents the reversal potentials, with mV for excitatory synapses and mV for inhibitory synapses. For the sake of simplicity, we use to represent the sum of synaptic activity of all presynaptic neurons. The variable is used to model the synaptic dynamics, which obeys the equation:
| 16 |
where is the synaptic time constant, and is the number of presynaptic peaks of all neurons at time .
The electrical synaptic current from the neuron to the neuron that only models the connections between striatal PV-FSIs, could be expressed as:
| 17 |
where is the connection strength and represents the membrane potential of the neuron. Phase lag is present in the FSI model for each pair of gap connections, here we use to describe.
Dopamine effect
Dopamine receptors have different impacts on synaptic ion channels. We expressed the relative levels of dopamine receptor occupancy by parameters (D1) and (D2), and added D1 receptor-dependent NMDA-induced excitatory postsynaptic potentials (EPSP) enhancement and D2 receptor-induced AMPA-dependent (Moyer et al. 2007) attenuation by the following equations:
| 18 |
| 19 |
where and are scaling factors that determine the relationship between dopamine receptor occupancy and effect magnitude. The connection and dopamine parameters for each nucleus are given in Table 4.
Table 4.
Synaptic and dopamine parameters values in the proposed model
| Parameter | Value | Parameter | Value |
|---|---|---|---|
| 0.25 | 0.05 | ||
| 0.1429 | 1 | ||
| 0.05 | 0.982 | ||
| 0.1429 | 0.982 | ||
| 1 | 0.5 | ||
| 0.05 | 0.982 | ||
| 0.1429 | 0.982 | ||
| 0.5 | 0.225 | ||
| 0.1 | 0.982 | ||
| 0.6 | 2 | ||
| 0.1 | 0.1429 | ||
| 0.1 | 0.1 | ||
| 0.125 | 6 | ||
| 160 | 4 | ||
| 11 | 0.5 | ||
| 3.75 | 0.5 | ||
| 0.156 |
Deep brain stimulation
To explore the effect of deep brain stimulation, the DBS was implemented by an exogenous intracellular control to the STN neurons. The DBS current could be considered as a series of periodic cathodic rectangular pulses, which can be described by the following equation:
| 20 |
where is the DBS current, is the Heaviside function, is the stimulation amplitude, is the stimulation period, is the duration of each impulse, with , , .
Stimulation
All simulations are performed using the Euler method using a 0.1 ms time step based on the MATLAB environment. With the progressive nature of OCD, the connectivity of PV-FSIs and MSNs are degenerating, with striatum dopamine concentrations and the strength of hyperdirect pathway changing. Thus, to simulate a progression in pathological OCD state, the synaptic conductance of the FSI-MSN is decreased in steps of 2% ranging from 100 to 0%, in addition to an increase in the synaptic conductance of hyperdirect pathway in steps of 2%. In the dopamine experiment, the striatum dopamine input was increased through dopaminergic currents by 2% per step. In each case, only one-parameter variation is considered.
For each experiment, the network has the same initial conditions so that the membrane potentials for all the neurons are replicated. So, the baseline state is the same in each experiment, and different initial conditions have the same result pattern. The network is simulated for 5 s, and the activity in the previous 3–4 s is analyzed.
Analysis methods
We characterize our model by (1) D1-MSNs average firing rate, (2) thalamus average firing rate, (3) STN burst index, (4) the relatively low-frequency (3–10 Hz) power of the STN population. Excitability is measured by the average firing rate of all cells for each population. Furthermore, interspike intervals (ISI) are used to quantify the STN burst index (BI), given as:
| 21 |
where ‘mode ISI’ is to calculate the most frequent ISI and a smaller BI value means a more regular spiking pattern (Luo et al. 2018). In the model, we define that there has no burst if BI < 1.2. To calculate oscillation power, we use a fast Fourier transform through STN local field potentials (LFP) to compute oscillation power. The STN LFP is estimated as the summation of extracellular potential across the STN population, representing the averaged synaptic activity (Buzsáki 2004; Rubchinsky et al. 2012). The LFP is described as:
| 22 |
where represents the total number of STN population, is the STN synaptic dynamics.
Results
Baseline healthy state and OCD state
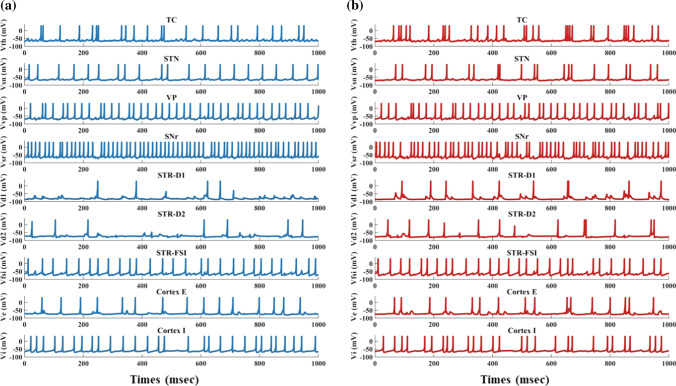
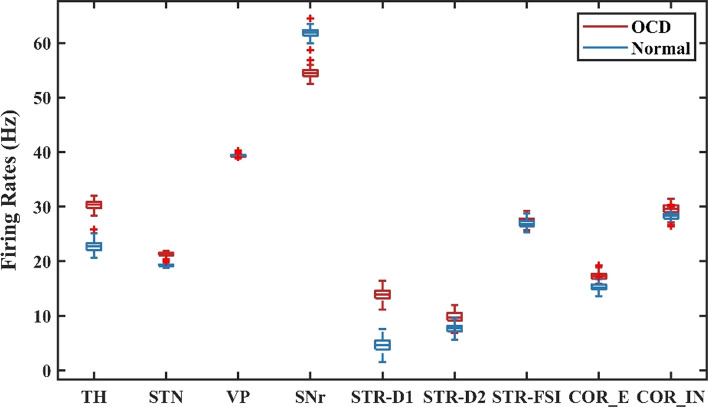
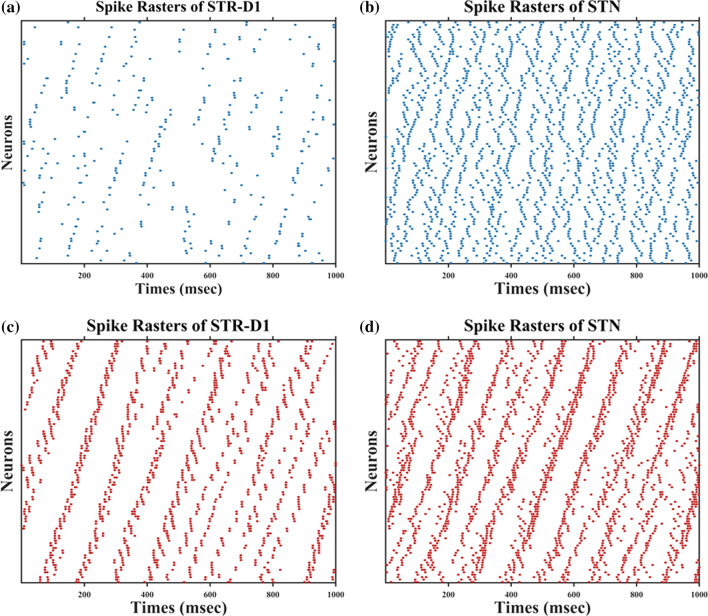
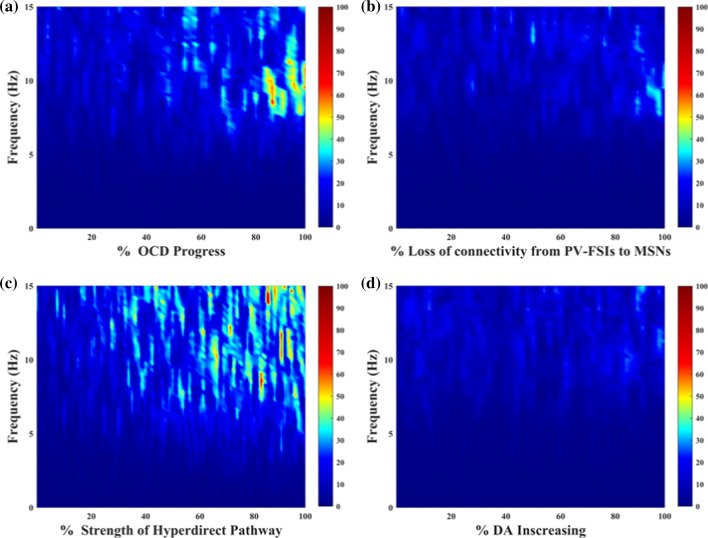
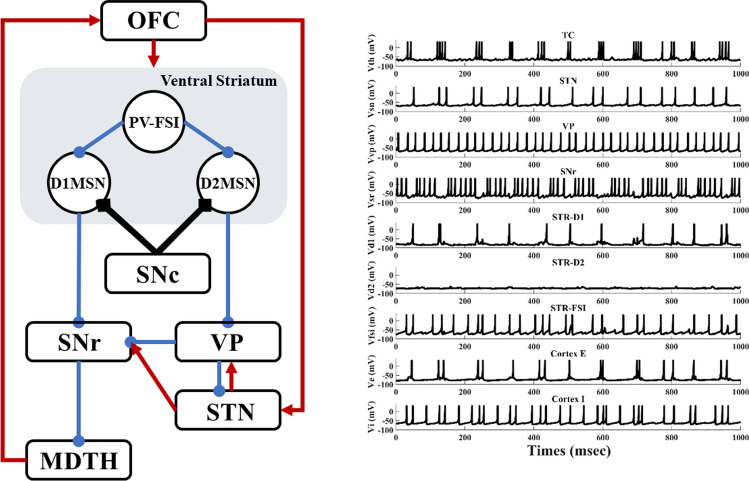
By degenerating the connectivity of PV-interneurons and MSNs and increasing the strength of hyperdirect pathway, we simulated situations of severe OCD state. The membrane potentials of individual neurons in the normal and OCD state are shown in Fig. 4, , , , , , , , , are the membrane potentials of the dorsomedial thalamus, the anterior subthalamic nucleus, the ventral pallidum, the substantia nigra pars reticulata, the ventral striatum D1 medium spiny neurons, the ventral striatum D2 medium spiny neurons, the ventral striatum fast-spiking interneurons, orbitofrontal cortex regular spiking neurons and interneurons respectively. It could be seen from Fig. 4 that, in the normal or “healthy” state, the loop displays irregular firing patterns at nearly constant frequencies. A key factor of normal state is no bursting pattern in STN and the balance of “direct” and “indirect” pathways. Then we test the hypothesis by deleting the connectivity from striatum PV-FSIs to MSNs and increasing hyperdirect pathway strength. In OCD state, D1-MSNs, OFC and thalamus exhibit higher spiking rates, while the SNr displays a lower firing rate (Fig. 5). Furthermore, in addition to the changes in firing rates, the STN and D1-MSN neurons alter firing patterns where low-frequency bursting occurs that visually we could get from spike raster maps of D1-MSNs and STN in normal and OCD states (Fig. 6). And by calculating the BI index, we find that the BI index in OCD states is significantly higher than the normal state and greater than the threshold we defined (BI = 1.2), which indicates that the D1-MSNs and STN have bursting firing patterns in OCD states. Each figure is a firing raster map of 100 neurons during the 3000–4000 ms analysis window. In OCD states, both D1-MSNs and the STN evolve into higher synchronized oscillations. Additionally, synchronization in the low-frequency (3–10 Hz) range is elevated, due to the fact that BI index increases from 1.16 to 3.24 and low frequency power increases from 11 to 56. The progressive nature of OCD generates low-frequency oscillation in STN, which is characterized by high synchronization and burst proportion (Figs. 6, 7).
Fig. 4.
Time evolutions of membrane voltages (mV) for individual network neurons in a window of 3000–4000 ms. a In normal states, all neurons of the network exhibit random irregular firing patterns (BI = 1.16). b In OCD pathological states (decreasing the synaptic conductance of the FSI-MSN by 50% and increasing hyperdirect pathway strength by 50%, same in Fig. 5, 6, 7a, 15), firing patterns change significantly (BI = 3.24). The firing rate of the D1-MSN increases and burst patterns occur in STN, TC, and COR-E neurons
Fig. 5.
The average firing rates for each nucleus in normal and the OCD states. Compared to the normal state, the firing rates of TH, STR-D1, STN and COR-E increase in the OCD state, and the firing rate of the SNr decreases significantly. The firing rate of STR-D2 increases slightly
Fig. 6.
Spatiotemporal patterns of STR-D1 and STN under normal and OCD conditions. a Spike rasters of STR-D1 in normal states (BI = 0.81). b Spike rasters of STN in normal states (BI = 1.16). c Spike rasters of STR-D1 in OCD states (BI = 1.35). d Spike rasters of STN in OCD states (BI = 3.24). From normal to OCD conditions, random distributions of STR-D1 and STN change into bursting synchrony
Fig. 7.
The STN response in low-frequency power of four conditions. a–d represent the effect of OCD progress, the loss of connectivity from PV-FSIs to MSNs, the strength of hyperdirect pathway and the dopamine concentration. The degree of morbidity increases as a percentage from left to right, while the left side of the axes indicates a normal state
Loss of the connectivity from the striatum PV-FSIs to MSNs
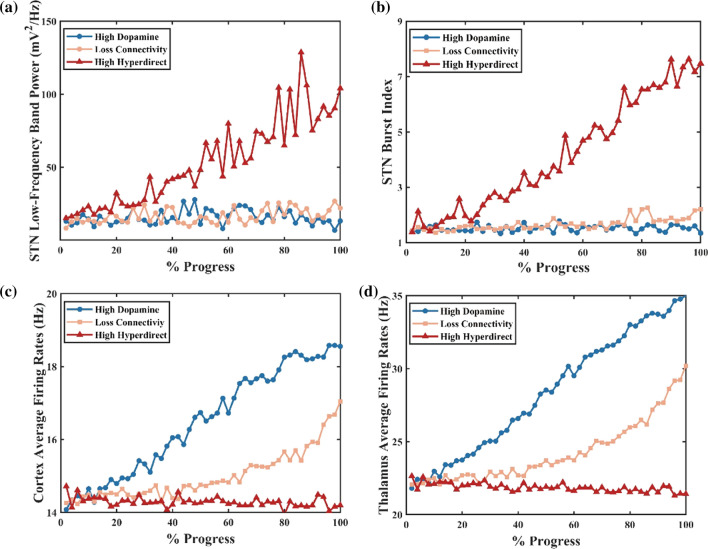
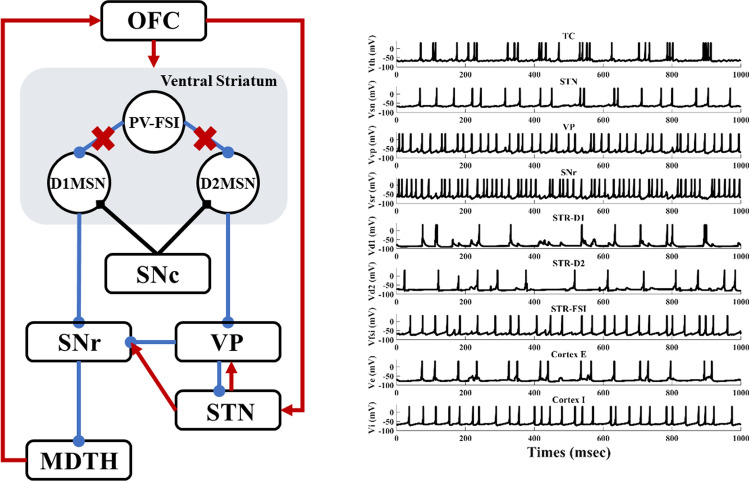
Multiple studies pointed at the frontal-striatum pathway as the critical channel that drove the pathology of OCD. Ablation of fast-spiking interneurons in the striatum produced anxiety and elevated grooming (Xu et al. 2016). Moreover, NL3-KO mice studies reported impaired D1-MSNs inhibitory inputs associated with boost repetitive behaviours (Sheean 2013). Here we test the loss of connectivity from the ventral striatal parvalbumin fast-spiking interneurons to MSNs. Little change is found in STN low-frequency power across all network models (Fig. 8a). As shown in Fig. 9b, the indirect pathway has a slight overactivity, which is negligible compared to the change of the direct pathway (both D1-MSNs' and D2-MSNs' spikes increases, but the increase is even greater for D1-MSNs). Here we calculate the low-frequency power and the percentage of low-frequency power in total 1–50 Hz power. As shown in Fig. 8a, the power remains approximately 10, and the portion is about 2% (the percentage of low-frequency power in total 1–50 Hz power). In this situation, the PV-FSIs are insufficient to alter STN low-frequency dynamics (Fig. 8b). In the experiment, the loss of connectivity makes the cortex and thalamus more excited (Fig. 8c, d), which leads to the firing pattern alteration in the network and suppression of the excitability of the SNr. Furthermore, the altered firing rate is higher for D1-MSNs than for D2-MSNs (Fig. 9). This is also confirmed by calculating the average firing rates of the D1-MSNs and D2-MSNs population (, ). The cause of this difference is that D2-MSNs receive less inhibition from striatal PV-FSIs than D1-MSNs since PV-FSIs synapses connect both two MSN subtypes but are more likely to target direct pathway MSNs (Burguière et al. 2015). As illustrated in Fig. 9, the loss of connectivity induces depolarization of D1-MSNs, thus preventing normal activation of the SNr.
Fig. 8.
Effect of the OCD progress on STN low-frequency band power (a), the STN burst activity (b), the cortex (c) and thalamus firing rates (d). A high STN burst index indicates more irregular spiking patterns
Fig. 9.
Schematic diagram of the altered structure and time evolutions of membrane voltages (mV) for individual network neurons in loss connectivity from PV-FSIs to MSNs states (decreasing the synaptic conductance of the FSI-MSN by 50%). In this condition, neurons in the striatum show a high-frequency discharge. TC, STN and Cortex E neurons represent burst patterns. Red cross indicates reduced connections
In summary, the progress of loss connectivity generates hyperactivated frontal cortico-striatal-thalamocortical neuronal loop in different degrees, so that causes the imbalance between “direct” and “indirect” pathways.
Strength of hyperdirect pathway
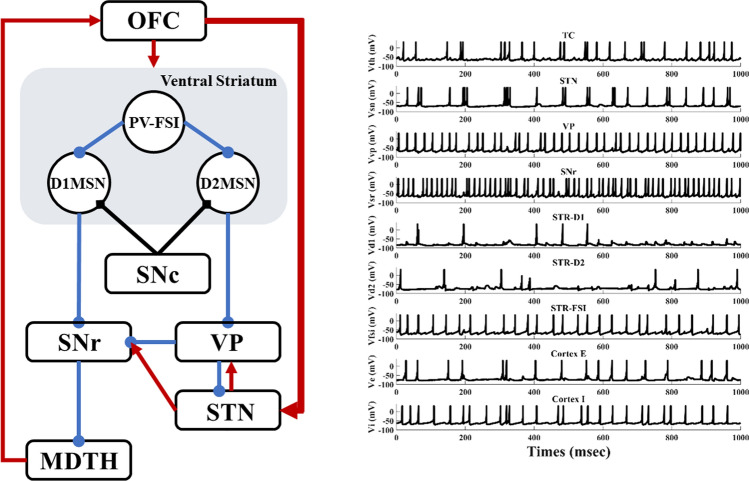
Hyperdirect pathway between the OFC and STN plays a critical role in medial STN overactivity. Abnormal high degree connectivity of orbitofrontal cortex and STN has been reported in clinical OCD patients (Beucke et al. 2013). To gain further insight into the effects of the hyperdirect pathway on low-frequency oscillation, we stimulate the network with increasing hyperdirect pathway strength (steps of 2%). As previously, we use the firing rates, bursting index and the relatively low-frequency power of the STN population to test the hyperdirect pathway. We observe that the impact is not significant at firing rates of the cortex and thalamus, even though the information flow from the cortex towards the STN strengthened considerably (Fig. 8c, d). In fact, the alteration increases the low-frequency band power by changing the irregular firing pattern into a bursting pattern (Figs. 8b, 10). Figure 8a shows that the power of the STN low-frequency band has increased from 20 to 100, with a low-frequency power’s proportion changing from 2 to 8% as the enhancement of the cortex-STN hyperdirect pathway. The abnormal low-frequency bursting activity may reflect OCD pathological action selection and highlight a dysfunction of associative-limbic circuitry, which could be translated into an over-stabilization of thoughts and behaviours as found from human clinical experiments. A closer examination of the effect of hyperdirect pathway reveals that by increasing the strength of this channel, the existence of the low-frequency band disappears (Fig. 11). The emergence of low-frequency band oscillation is dependent on the cortical input trains, confirming that this effect is unique to a particular cortical firing frequency.
Fig. 10.
Schematic diagram of the altered structure and time evolutions of membrane voltages (mV) for individual neurons of the network in high hyperdirect pathway states (increasing hyperdirect pathway strength by 50%). Increased bursting occurred in the STN and TC neurons. The thickened red line indicates connection enhancement
Fig. 11.
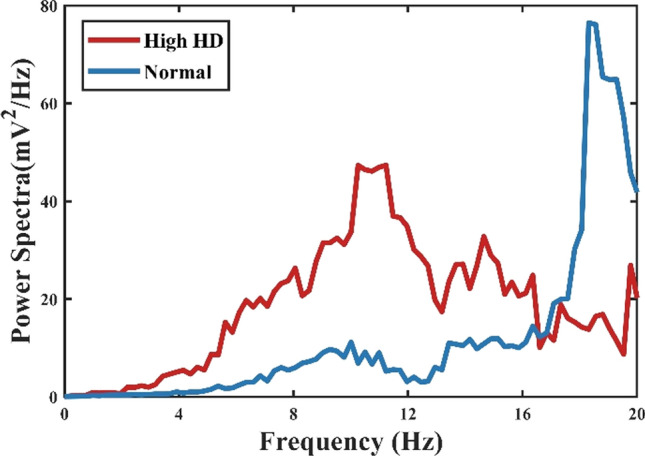
Power spectral density of STN firing times in normal and high hyperdirect pathway states (increasing hyperdirect pathway strength by 50%). Higher low-frequency power was observed in the high hyperdirect pathway pathological state, while the peak occurred at 18 Hz in normal conditions
Dopamine effects
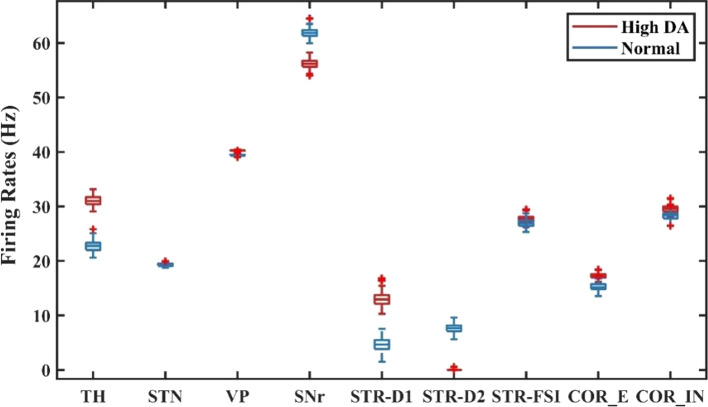
We test the hypothesis that high dopamine in the ventral striatum is a causal mediator of OCD symptoms. We simulate the effect of dopamine on the normal network by modelling the impact as a glutamic input to MSNs. D1 activation only enhances NMDA-induced excitatory post-synaptic potentials, while D2 activation only attenuated AMPA-induced excitatory post-synaptic potentials. The alteration of dopamine concentration is implemented by changing the relative level of dopamine receptor occupancy. Compared to losing connectivity from the striatum PV-FSIs to MSNs and increasing the strength of hyperdirect pathway, changing the dopamine concentration results in a different pattern of effects on the network activity. In the situation of 100% increased dopamine dose, D1-MSNs maintain high aberrant activity when D2-MSNs are suppressed (Fig. 12). The SNr became inhibited by D1-MSNs, and it is unable to suppress the thalamus, resulting in hyperactivity of the thalamus and OFC (Fig. 12). Then we progressively increase the dose of dopamine to find out the mechanism behind dopamine dysregulation. The low-frequency power of the STN and the firing rate of the ventral pallidum show a slight alteration, and the indirect pathway still remains in the original state (Figs. 8a, b, 13). Interestingly, the direct pathway synaptic imbalance induced by D1-MSNs overactivity results in the thalamus and cortex high-rate firing state (Fig. 8c, d). In contrast, the SNr is suppressed as the dopamine increases, consistent with the studies that reported striatonigral direct pathway activation was sufficient to induce OCD-like behaviours and neuronal activation in the ventral striatum correlated with obsession (Bouchekioua et al. 2018).
Fig. 12.
Schematic diagram of the altered structure and time evolutions of membrane voltages (mV) for individual neurons of the network in high dopamine states (increasing the striatum dopamine input by 50%). There is a significant burst firing pattern of TC and COR-E. STR-D1 is discharging quickly, while high dopamine is suppressing STR-D2 entirely. The thickened black line indicates increased dopamine
Fig. 13.
The average firing rates for each nucleus in normal and high dopamine states. In the high dopamine state, TH, STR-D1 and COR-E firing rates increase significantly. The SNr and STR-D2 are suppressed considerably
Effect of DBS treatment
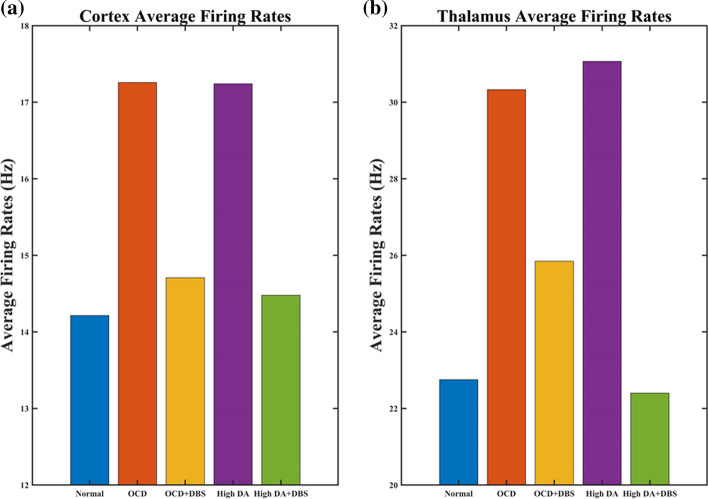
To model the response of the frontal cortico-striatal-thalamocortical network to the deep brain stimulation in cellular and circuit properties, we also simulate the acute effects of DBS in OCD and high dopamine conditions, respectively. With DBS ON, the STN will exhibit a high-frequency firing pattern that synchronizes the DBS pulses, thus losing the original low-frequency bursting activity (Fig. 14). The cortical and thalamus firing rates match well the observations of where the excitatory neuronal activity of the orbitofrontal cortex and thalamus is suppressed by high-frequency deep brain stimulation (Fig. 15). Thus, DBS compensates for the imbalance between direct and indirect pathways through the activation of the STN, resulting in stronger excitatory input to the SNr, which recovers hyperactivity of the cortex and thalamus in both OCD and high dopamine conditions. In addition, to gain additional insight into dynamical changes of STN neurons caused by DBS, the firing patterns before and after DBS are shown in Figs. 4b and 14. In summary, the results represented DBS treatment both disrupts abnormal bursting patterns in non-motor STN and elevates the activity of the ‘indirect’ pathway, which generates the activity of the SNr and leads to the suppression of the OFC and thalamus.
Fig. 14.
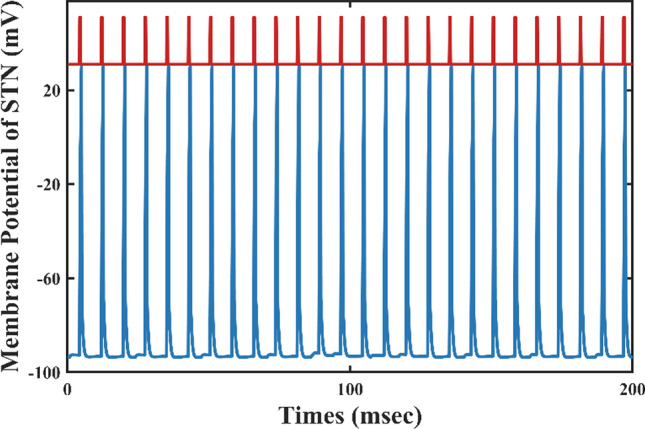
Time evolutions of membrane voltages (mV) for a single STN neuron with DBS added directly to the STN. The red curve represents a pulse of deep brain stimulation, and the blue curve shows a single STN neuronal membrane potential time series. As can be seen in the figure, each spike of STN corresponds to a DBS pulse
Fig. 15.
Comparisons of the average firing rates of the thalamus and cortex of five types of stimuli. a Effect of DBS on the average firing rate of the cortex. b Effect of DBS on the average firing rate of the thalamus. In the OCD and high dopamine states, DBS significantly reduces the discharge rate of the cortex and thalamus, bringing it closer to normal
Conclusion and discussion
In sum, we have proposed a biophysical model for frontal cortico-striatal-thalamocortical dysfunction in obsessive–compulsive disorder. The model articulated a vital role of the orbitofrontal cortex and subcortex brain areas in pathological activities mechanistically. The model could explain how the loss of striatal FSI-MSN connectivity, the enhancement of hyperdirect pathway, the elevated dopamine concentration disrupted the synaptic balance, caused the imbalance between “direct” and “indirect” pathway, leading to hyperactivity of the orbitofrontal cortex and thalamus, and generated the low-frequency bursting pattern of the STN. All three causes could be related to the progressive nature of OCD in agreement with previous neuroimaging reports. Based on the results we inferred that the phenomenon of OCD may be produced by a synergistic effect of the three causes mentioned above. The deep brain stimulation could also be simulated and turn off the hypoactivity of the SNr, resulting in the normalization of the orbitofrontal cortex and thalamus, which recovered the network close to the normal state. The OCD-like dynamics were distinguished by the elevated STN low-frequency band power and cortex-thalamus firing rates.
The model integrated several lines of evidence in electrophysiology, neuroimaging, post—mortem, neurochemistry, clinical trials of obsessive–compulsive disorder. The model provides a theoretical explanation of the relationship between abnormal neuronal firing and loops as well as representations and symptoms, and the relationship between possible biomarkers and treatments.
A picture of pathological microcircuitry abnormality in OCD is emerging through the development of genetic technologies and optogenetics. We portray the aberrant connections in animal models by simulating the loss of connectivity of striatal PV-FSIs with MSNs (Sheean 2013), and the increase in the strength of the hyperdirect pathway (Parolari et al. 2020), resulting in altered activity of specific pathways that produce the physiological phenomenon corresponding to OCD and obsessive–compulsive disorder. Simulating pathological microcircuit abnormalities in computational models has broad implications for understanding the neural basis of OCD and elucidating the neural circuitry of OCD.
We herein establish a hypothesis for the relationship between dopamine and OCD pathology, which consists with animal experiments (Aldridge 2008; Goodman et al. 1992; Manning et al. 2021) and clinical settings (Denys et al. 2004a; Evans et al. 2006). But the mechanisms involved have been unclear. The present model verifies the hypothesis that a high dopamine state causes an imbalance between direct and indirect pathways, resulting in cortico-thalamic hyperactivity and an obsessive–compulsive condition. This, in turn, provides a viable option for clinical treatment: the use of dopamine antagonist drugs for OCD. In addition, we have presented the excessive dopamine in the ventral striatum, which occurs in schizophrenia as well (Zinkstok et al. 2008). 20–30% of patients with schizophrenia have co-morbidity with OCD, and such high co-morbidity may be attributed to overlapping portions of brain function and neurotransmitter dysfunction in both disorders (Meier et al. 2014; Schirmbeck and Zink 2013; Tibbo and Warneke 1999). The model has potential in finding the pathogenesis of OCD and schizophrenia co-morbidities.
The dynamics of DBS for OCD in the model are associated with clinical treatment. We simulated the effect of STN-DBS on the pathological network under different aberrant conditions. Although scientists previously found that decreased obsession and compulsion were related to the normalization of the neural network after DBS, the mechanism remains puzzling. DBS might affect the target structure itself and work distally (Kohl and Baldermann 2018; Park et al. 2019), producing a network effect that mediates clinical outcomes. STN-DBS may be achieved by disrupting the burst state and activating indirect channels. Patients with the best clinical outcome show STN neurons exhibit higher average firing, bursts, and lower burst intervals (Welter et al. 2011). According to our model, DBS disrupts the bursting pattern of STN and causes a regular high-frequency discharge with enhanced indirect pathway activity, normalizing the imbalance between the ‘direct’ and ‘indirect’ pathways. Biomarkers with different degrees of sensitivity are available for DBS with varying mechanisms of action. For example, the conditions simulated in this paper may suggest that the burst state of STN may serve as a biomarker for both onset and amelioration. More research is needed in this area to unravel the possible electrophysiological biomarkers of DBS response in OCD.
This study is subject to several limitations as follows. The model was not attempting to stimulate all heterogeneous types of OCD in terms of symptom clusters, medication use and comorbidities with environmental, genetic, and psychological influences. Furthermore, we did not account for the transmission delay of the signal between model nuclei clusters. The dynamics of our model were elementary and could not integrate all the elements while we attempted to make the model as close as possible to published observations. We simply pointed at the neuroanatomical, neurochemical, circuit functional and electrophysical details that directly impacted our hypothesis. Furthermore, it was essential to explore plasticity mechanisms since the chronic treatment had different effects compared to acute stimulation (Ahmari et al. 2013; Bourne et al. 2012; Morris et al. 2017; Parolari et al. 2020). An additional limitation was that pathological frontal cortico-striatal-thalamocortical circuits involved multiple open parallel and interconnected loops that connected cortex and subcortex areas in the view of the fact that most of the OCD patients have not limited to one class of symptoms like emotional, cognitive, and motor symptoms (van den Heuvel et al. 2016). Extension of this model should pay more attention to symptom diversity and other brain areas which involve the pathology of OCD. On account of the fact that dopaminergic D2/3 receptors have an impact on reinforcement learning and cognitive flexibility in obsessive compulsive disorder (Kanen et al. 2019), further work should therefore include the reward/punishment-driven learning through D2/3 receptors.
Few computational models have been used to study psychiatric disorders, with some research on depression (Ramirez-Mahaluf et al. 2017) and schizophrenia (Thurnham 2007). Still, the OCD network developed in this paper is the first spiking model, which pays attention to the changes of firing patterns and highlights the potential of computational models to study obsessive–compulsive disorders. Computational modelling studies allow testing the effects of different drugs and psychotherapies on OCD pathologies, which are difficult to measure in human experiments. Moreover, modelling can also help bridge the gaps between the exact abnormal neuronal loop and animal models of a certain aspect of OCD.
To test the effect of a particular neural circuit abnormality and the treatment plays a significant part in computational neuro-dynamics. This paper explored a frontal cortico-striatal-thalamocortical network representing altered dynamics from normal to pathological OCD, based on an integrated broad range of evidence. We suggest that low-frequency bursting activity at the non-motor STN and elevated firing rates of the orbitofrontal cortex and thalamus might be used as a biomarker for OCD. Furthermore, the exploration of dopamine and deep brain stimulation can contribute to new drug development and support DBS's clinical potential in treating OCD.
Acknowledgements
This research was supported by the National Natural Science Foundation of China (Grants Nos. 11932003 and 11972115).
Author contributions
All authors designed, performed the research and analyzed the data as well as wrote the paper.
Data availability
The data that support the findings of this study are available from the corresponding author upon reasonable request.
Declarations
Conflict of interest
The authors declare that the research was conducted in the absence of any commercial or financial relationships that could be construed as a potential conflict of interest.
Footnotes
Publisher's Note
Springer Nature remains neutral with regard to jurisdictional claims in published maps and institutional affiliations.
Contributor Information
Fang Han, Email: yadiahan@dhu.edu.cn.
Qingyun Wang, Email: nmqingyun@163.com.
References
- Ahmari SE, Spellman T, Douglass NL, Kheirbek MA, Simpson HB, Deisseroth K, Gordon JA, Hen R. Repeated cortico-striatal stimulation generates persistent OCD-like behavior. Science. 2013;340(6137):1234–1239. doi: 10.1126/science.1234733. [DOI] [PMC free article] [PubMed] [Google Scholar]
- Aldridge JTRB. Dopamine receptor modulation of repetitive grooming actions in the rat: potential relevance for Tourette syndrome. Bone. 2008;23(1):1–7. doi: 10.1016/j.brainres.2010.01.052.Dopamine. [DOI] [PMC free article] [PubMed] [Google Scholar]
- Bahuguna J, Aertsen A, Kumar A. Existence and control of Go/No-Go decision transition threshold in the striatum. PLoS Comput Biol. 2015;11(4):1–35. doi: 10.1371/journal.pcbi.1004233. [DOI] [PMC free article] [PubMed] [Google Scholar]
- Beucke JC, Sepulcre J, Talukdar T, Linnman C, Zschenderlein K, Endrass T, Kaufmann C, Kathmann N. Abnormally high degree connectivity of the orbitofrontal cortex in obsessive–compulsive disorder. JAMA Psychiat. 2013;70(6):619–629. doi: 10.1001/jamapsychiatry.2013.173. [DOI] [PubMed] [Google Scholar]
- Bouchekioua Y, Tsutsui-Kimura I, Sano H, Koizumi M, Tanaka KF, Yoshida K, Kosaki Y, Watanabe S, Mimura M. Striatonigral direct pathway activation is sufficient to induce repetitive behaviors. Neurosci Res. 2018;132:53–57. doi: 10.1016/j.neures.2017.09.007. [DOI] [PubMed] [Google Scholar]
- Bourne SK, Eckhardt CA, Sheth SA, Eskandar EN. Mechanisms of deep brain stimulation for obsessive compulsive disorder: effects upon cells and circuits. Front Integr Neurosci. 2012 doi: 10.3389/fnint.2012.00029. [DOI] [PMC free article] [PubMed] [Google Scholar]
- Burguière E, Monteiro P, Feng G, Graybiel AM. Optogenetic stimulation of lateral orbitofronto-striatal pathway suppresses compulsive behaviors. Science. 2013;340(6137):1243–1246. doi: 10.1126/science.1232380. [DOI] [PMC free article] [PubMed] [Google Scholar]
- Burguière E, Monteiro P, Mallet L, Feng G, Graybiel AM. Striatal circuits, habits, and implications for obsessive–compulsive disorder. Curr Opin Neurobiol. 2015;30:59–65. doi: 10.1016/j.conb.2014.08.008. [DOI] [PMC free article] [PubMed] [Google Scholar]
- Buzsáki G. Large-scale recording of neuronal ensembles. Nat Neurosci. 2004;7(5):446–451. doi: 10.1038/nn1233. [DOI] [PubMed] [Google Scholar]
- De Haas R, Nijdam A, Westra TA, Kas MJH, Westenberg HGM. Behavioral pattern analysis and dopamine release in quinpirole-induced repetitive behavior in rats. J Psychopharmacol. 2011;25(12):1712–1719. doi: 10.1177/0269881110389093. [DOI] [PubMed] [Google Scholar]
- De Koning PP, Figee M, Van Den Munckhof P, Schuurman PR, Denys D. Current status of deep brain stimulation for obsessive–compulsive disorder: a clinical review of different targets. Curr Psychiatry Rep. 2011;13(4):274–282. doi: 10.1007/s11920-011-0200-8. [DOI] [PubMed] [Google Scholar]
- Denys D, Fluitman S, Kavelaars A, Heijnen C, Westenberg H. Decreased TNF-α and NK activity in obsessive–compulsive disorder. Psychoneuroendocrinology. 2004;29(7):945–952. doi: 10.1016/j.psyneuen.2003.08.008. [DOI] [PubMed] [Google Scholar]
- Denys D, Zohar J, Westenberg HGM. The role of dopamine in obsessive–compulsive disorder: preclinical and clinical evidence. J Clin Psychiatry. 2004;65(SUPPL. 14):11–17. [PubMed] [Google Scholar]
- Ebert M, Hauptmann C, Tass PA. Coordinated reset stimulation in a large-scale model of the STN-GPE circuit. Front Comput Neurosci. 2014;8(NOV):1–20. doi: 10.3389/fncom.2014.00154. [DOI] [PMC free article] [PubMed] [Google Scholar]
- Evans AH, Pavese N, Lawrence AD, Tai YF, Appel S, Doder M, Brooks DJ, Lees AJ, Piccini P. Compulsive drug use linked to sensitized ventral striatal dopamine transmission. Ann Neurol. 2006;59(5):852–858. doi: 10.1002/ana.20822. [DOI] [PubMed] [Google Scholar]
- Figee M, De Koning P, Klaassen S, Vulink N, Mantione M, Van Den Munckhof P, Schuurman R, Van Wingen G, Van Amelsvoort T, Booij J, Denys D. Deep brain stimulation induces striatal dopamine release in obsessive–compulsive disorder. Biol Psychiat. 2014;75(8):647–652. doi: 10.1016/j.biopsych.2013.06.021. [DOI] [PubMed] [Google Scholar]
- Frank MJ, Claus ED. Anatomy of a decision: Striato-orbitofrontal interactions in reinforcement learning, decision making, and reversal. Psychol Rev. 2006;113(2):300–326. doi: 10.1037/0033-295X.113.2.300. [DOI] [PubMed] [Google Scholar]
- Gertler TS, Chan CS, Surmeier DJ. Dichotomous anatomical properties of adult striatal medium spiny neurons. J Neurosci. 2008;28(43):10814–10824. doi: 10.1523/JNEUROSCI.2660-08.2008. [DOI] [PMC free article] [PubMed] [Google Scholar]
- Gillies AJ, Willshaw DJ. A massively connected subthalamic nucleus leads to the generation of widespread pulses. Proc R Soc B Biol Sci. 1998;265(1410):2101–2109. doi: 10.1098/rspb.1998.0546. [DOI] [PMC free article] [PubMed] [Google Scholar]
- Gittis AH, Nelson AB, Thwin MT, Palop JJ, Kreitzer AC. Distinct roles of GABAergic interneurons in the regulation of striatal output pathways. J Neurosci. 2010;30(6):2223–2234. doi: 10.1523/JNEUROSCI.4870-09.2010. [DOI] [PMC free article] [PubMed] [Google Scholar]
- Goodman WK, McDougle CJ, Price LH. The role of serotonin and dopamine in the pathophysiology of obsessive compulsive disorder. Int Clin Psychopharmacol. 1992;7:35–38. doi: 10.1097/00004850-199206001-00009. [DOI] [PubMed] [Google Scholar]
- Grabli D, McCairn K, Hirsch EC, Agid Y, Féger J, Fraņois C, Tremblay L. Behavioural disorders induced by external globus pallidus dysfunction in primates: I. Behavioural study. Brain. 2004;127(9):2039–2054. doi: 10.1093/brain/awh220. [DOI] [PubMed] [Google Scholar]
- Graybiel AM, Rauch SL. Toward a neurobiology review of obsessive–compulsive disorder dysfunction of the basal ganglia and associated cor. Neuron. 2000;28(4):343–347. doi: 10.1016/S0896-6273(00)00113-6. [DOI] [PubMed] [Google Scholar]
- Gruber AJ, Solla SA, Surmeier DJ, Houk JC. Modulation of striatal single units by expected reward: a spiny neuron model displaying dopamine-induced bistability. J Neurophysiol. 2003;90(2):1095–1114. doi: 10.1152/jn.00618.2002. [DOI] [PubMed] [Google Scholar]
- Haber SN, Calzavara R. The cortico-basal ganglia integrative network: the role of the thalamus. Brain Res Bull. 2009;78(2–3):69–74. doi: 10.1016/j.brainresbull.2008.09.013. [DOI] [PMC free article] [PubMed] [Google Scholar]
- Humphries MD, Prescott TJ. The ventral basal ganglia, a selection mechanism at the crossroads of space, strategy, and reward. Prog Neurobiol. 2010;90(4):385–417. doi: 10.1016/j.pneurobio.2009.11.003. [DOI] [PubMed] [Google Scholar]
- Humphries MD, Wood R, Gurney K. Dopamine-modulated dynamic cell assemblies generated by the GABAergic striatal microcircuit. Neural Netw. 2009;22(8):1174–1188. doi: 10.1016/j.neunet.2009.07.018. [DOI] [PubMed] [Google Scholar]
- Izhikevich EM. Which model to use for cortical spiking neurons? IEEE Trans Neural Netw. 2004;15(5):1063–1070. doi: 10.1109/TNN.2004.832719. [DOI] [PubMed] [Google Scholar]
- Izhikevich EM, Edelman GM. Large-scale model of mammalian thalamocortical systems. Proc Natl Acad Sci. 2008;105(9):3593–3598. doi: 10.1073/pnas.0712231105. [DOI] [PMC free article] [PubMed] [Google Scholar]
- Janssen MLF, Temel Y, Delaville C, Zwartjes DGM, Heida T, De Deurwaerdère P, Visser-Vandewalle V, Benazzouz A. Cortico-subthalamic inputs from the motor, limbic, and associative areas in normal and dopamine-depleted rats are not fully segregated. Brain Struct Funct. 2017;222(6):2473–2485. doi: 10.1007/s00429-016-1351-5. [DOI] [PubMed] [Google Scholar]
- Kanen JW, Ersche KD, Fineberg NA, Robbins TW, Cardinal RN. Computational modelling reveals contrasting effects on reinforcement learning and cognitive flexibility in stimulant use disorder and obsessive–compulsive disorder: remediating effects of dopaminergic D2/3 receptor agents. Psychopharmacology. 2019;236(8):2337–2358. doi: 10.1007/s00213-019-05325-w. [DOI] [PMC free article] [PubMed] [Google Scholar]
- Kohl S, Baldermann JC. Progress and challenges in deep brain stimulation for obsessive–compulsive disorder. Pharmacol Ther. 2018;186:168–175. doi: 10.1016/j.pharmthera.2018.01.011. [DOI] [PubMed] [Google Scholar]
- Konstantoudaki X, Papoutsi A, Chalkiadaki K, Poirazi P, Sidiropoulou K. Modulatory effects of inhibition on persistent activity in a cortical microcircuit model. Front Neural Circuits. 2014;8(JAN):1–15. doi: 10.3389/fncir.2014.00007. [DOI] [PMC free article] [PubMed] [Google Scholar]
- Luo F, Kim LH, Magown P, Sohail Noor M, Kiss ZHT. Long-lasting electrophysiological after-effects of high-frequency stimulation in the globus pallidus: human and rodent slice studies. J Neurosci. 2018;38(50):10734–10746. doi: 10.1523/JNEUROSCI.0785-18.2018. [DOI] [PMC free article] [PubMed] [Google Scholar]
- Manning EE, Wang AY, Saikali LM, Winner AS, Ahmari SE. Disruption of prepulse inhibition is associated with compulsive behavior severity and nucleus accumbens dopamine receptor changes in Sapap3 knockout mice. Sci Rep. 2021;11(1):1–11. doi: 10.1038/s41598-021-88769-5. [DOI] [PMC free article] [PubMed] [Google Scholar]
- Mccracken CB, Grace AA. High-frequency deep brain stimulation of the nucleus accumbens region suppresses neuronal activity and selectively modulates afferent drive in rat orbitofrontal cortex in vivo. Neurobiol Dis. 2007;27(46):12601–12610. doi: 10.1523/JNEUROSCI.3750-07.2007. [DOI] [PMC free article] [PubMed] [Google Scholar]
- Meier SM, Petersen L, Pedersen MG, Arendt MCB, Nielsen PR, Mattheisen M, Mors O, Mortensen PB. Obsessive–compulsive disorder as a risk factor for schizophrenia: a nationwide study. JAMA Psychiat. 2014;71(11):1215–1221. doi: 10.1001/jamapsychiatry.2014.1011. [DOI] [PubMed] [Google Scholar]
- Menzies L, Chamberlain SR, Laird AR, Thelen SM, Sahakian BJ, Bullmore ET. Integrating evidence from neuroimaging and neuropsychological studies of obsessive–compulsive disorder: the orbitofronto-striatal model revisited. Neurosci Biobehav Rev. 2008;32(3):525–549. doi: 10.1016/j.neubiorev.2007.09.005. [DOI] [PMC free article] [PubMed] [Google Scholar]
- Monteiro P, Feng G. Learning from animal models of obsessive–compulsive disorder. Biol Psychiatry. 2016;79(1):7–16. doi: 10.1016/j.biopsych.2015.04.020. [DOI] [PMC free article] [PubMed] [Google Scholar]
- Morris LS, Baek K, Voon V. Distinct cortico-striatal connections with subthalamic nucleus underlie facets of compulsivity. Cortex. 2017;88:143–150. doi: 10.1016/j.cortex.2016.12.018. [DOI] [PMC free article] [PubMed] [Google Scholar]
- Moyer JT, Wolf JA, Finkel LH. Effects of dopaminergic modulation on the integrative properties of the ventral striatal medium spiny neuron. J Neurophysiol. 2007;98(6):3731–3748. doi: 10.1152/jn.00335.2007. [DOI] [PubMed] [Google Scholar]
- Nakao T, Okada K, Kanba S. Neurobiological model of obsessive–compulsive disorder: evidence from recent neuropsychological and neuroimaging findings. Psychiatry Clin Neurosci. 2014;68(8):587–605. doi: 10.1111/pcn.12195. [DOI] [PubMed] [Google Scholar]
- Park HR, Kim IH, Kang H, McCairn KW, Lee DS, Kim BN, Kim DG, Paek SH. Electrophysiological and imaging evidence of sustained inhibition in limbic and frontal networks following deep brain stimulation for treatment refractory obsessive compulsive disorder. PLoS ONE. 2019;14(7):1–19. doi: 10.1371/journal.pone.0219578. [DOI] [PMC free article] [PubMed] [Google Scholar]
- Parolari L, Schneeberger M, Heintz N, Friedman JM. Functional analysis of distinct populations of subthalamic nucleus neurons on Parkinson’s Disease and OCD-like behaviors in mice. BioRxiv. 2020 doi: 10.1101/2020.06.10.137679. [DOI] [PubMed] [Google Scholar]
- Monteiro P, Feng G. Learning from animal models of obsessive–compulsive disorder. Physiol Behav. 2016;176(12):139–148. doi: 10.1016/j.biopsych.2015.04.020.Learning. [DOI] [PMC free article] [PubMed] [Google Scholar]
- Péron J, Frühholz S, Vérin M, Grandjean D. Subthalamic nucleus: a key structure for emotional component synchronization in humans. Neurosci Biobehav Rev. 2013;37(3):358–373. doi: 10.1016/j.neubiorev.2013.01.001. [DOI] [PubMed] [Google Scholar]
- Pisansky MT, Lefevre EM, Retzlaff CL, Trieu BH, Leipold DW, Rothwell PE. Nucleus accumbens fast-spiking interneurons constrain impulsive action. Biol Psychiatry. 2019;86(11):836–847. doi: 10.1016/j.biopsych.2019.07.002. [DOI] [PMC free article] [PubMed] [Google Scholar]
- Ramirez-Mahaluf JP, Roxin A, Mayberg HS, Compte A. A computational model of major depression: the role of glutamate dysfunction on cingulo-frontal network dynamics. Cereb Cortex. 2017;27(1):660–679. doi: 10.1093/cercor/bhv249. [DOI] [PMC free article] [PubMed] [Google Scholar]
- Rappel P, Marmor O, Bick AS, Arkadir D, Linetsky E, Castrioto A, Tamir I, Freedman SA, Mevorach T, Gilad M, Bergman H, Israel Z, Eitan R. Subthalamic theta activity: a novel human subcortical biomarker for obsessive compulsive disorder. Transl Psychiatry. 2018 doi: 10.1038/s41398-018-0165-z. [DOI] [PMC free article] [PubMed] [Google Scholar]
- Rotge JY, Guehl D, Dilharreguy B, Tignol J, Bioulac B, Allard M, Burbaud P, Aouizerate B. Meta-analysis of brain volume changes in obsessive–compulsive disorder. Biol Psychiatry. 2009;65(1):75–83. doi: 10.1016/j.biopsych.2008.06.019. [DOI] [PubMed] [Google Scholar]
- Rubchinsky LL, Park C, Worth RM. Intermittent neural synchronization in Parkinson’s disease. Nonlinear Dyn. 2012;68(3):329–346. doi: 10.1007/s11071-011-0223-z. [DOI] [PMC free article] [PubMed] [Google Scholar]
- Saxena S, Brody AL, Schwartz JM, Baxter LR. Neuroimaging and frontal-subcortical circuitry in obsessive–compulsive disorder. Br J Psychiatry. 1998;173(SUPPL. 35):26–37. doi: 10.1192/s0007125000297870. [DOI] [PubMed] [Google Scholar]
- Saxena S, Brody AL, Ho ML, Alborzian S, Maidment KM, Zohrabi N, Ho MK, Huang SC, Wu HM, Baxter LR. Differential cerebral metabolic changes with paroxetine treatment of obsessive–compulsive disorder vs major depression. Arch Gen Psychiatry. 2002;59(3):250–261. doi: 10.1001/archpsyc.59.3.250. [DOI] [PubMed] [Google Scholar]
- Schirmbeck F, Zink M. Comorbid obsessive–compulsive symptoms in schizophrenia: contributions of pharmacological and genetic factors. Front Pharmacol. 2013;4(August):1–14. doi: 10.3389/fphar.2013.00099. [DOI] [PMC free article] [PubMed] [Google Scholar]
- Schwabe K, Alam M, Saryyeva A, Lütjens G, Heissler HE, Winter L, Heitland I, Krauss JK, Kahl KG. Oscillatory activity in the BNST/ALIC and the frontal cortex in OCD: acute effects of DBS. J Neural Transm. 2021;128(2):215–224. doi: 10.1007/s00702-020-02297-6. [DOI] [PubMed] [Google Scholar]
- Rauch SL. Neuroscience. Illuminating the neural circuitry of compulsive behaviors. Physiol Behav. 2013;176(12):139–148. doi: 10.1016/j.physbeh.2017.03.040. [DOI] [PMC free article] [PubMed] [Google Scholar]
- Sheean. Autism-associated neuroligin-3 mutations commonly impair striatal circuits to boost repetitive behaviors. Bone. 2013;23(1):1–7. doi: 10.1016/j.cell.2014.04.045.Autism-Associated. [DOI] [PMC free article] [PubMed] [Google Scholar]
- Shen KZ, Johnson SW. Subthalamic stimulation evokes complex EPSCs in the rat substantia nigra pars reticulata in vitro. J Physiol. 2006;573(3):697–709. doi: 10.1113/jphysiol.2006.110031. [DOI] [PMC free article] [PubMed] [Google Scholar]
- Smith Y, Bevan MD, Shink E, Bolam JP. Microcircuitry of the direct and indirect pathways of the basal ganglia. Neuroscience. 1998;86(2):353–387. doi: 10.1016/S0306-4522(98)00004-9. [DOI] [PubMed] [Google Scholar]
- Stein DJ. Obsessive–compulsive disorder. Lancet. 2002;360:397–405. doi: 10.1016/S0140-6736(02)09620-4. [DOI] [PubMed] [Google Scholar]
- Thurnham AJ (2007) Computational modelling of the neural systems involved in schizophrenia. November. http://uhra.herts.ac.uk/handle/2299/1842%5Cnhttp://uhra.herts.ac.uk/bitstream/handle/2299/1842/AngelaThurnham’sfinalsubmission.pdf?sequence=1
- Tibbo P, Warneke L. Obsessive–compulsive disorder in schizophrenia: epidemiologic and biologic overlap. J Psychiatry Neurosci. 1999;24(1):15–24. [PMC free article] [PubMed] [Google Scholar]
- Vaghi MM, Vértes PE, Kitzbichler MG, Apergis-Schoute AM, van der Flier FE, Fineberg NA, Sule A, Zaman R, Voon V, Kundu P, Bullmore ET, Robbins TW. Specific frontostriatal circuits for impaired cognitive flexibility and goal-directed planning in obsessive–compulsive disorder: evidence from resting-state functional connectivity. Biol Psychiatry. 2017;81(8):708–717. doi: 10.1016/j.biopsych.2016.08.009. [DOI] [PMC free article] [PubMed] [Google Scholar]
- van Albada SJ, Robinson PA. Mean-field modeling of the basal ganglia-thalamocortical system. I. Firing rates in healthy and parkinsonian states. J Theor Biol. 2009;257(4):642–663. doi: 10.1016/j.jtbi.2008.12.018. [DOI] [PubMed] [Google Scholar]
- van den Heuvel OA, van Wingen G, Soriano-Mas C, Alonso P, Chamberlain SR, Nakamae T, Denys D, Goudriaan AE, Veltman DJ. Brain circuitry of compulsivity. Eur Neuropsychopharmacol. 2016;26(5):810–827. doi: 10.1016/j.euroneuro.2015.12.005. [DOI] [PubMed] [Google Scholar]
- Welter ML, Burbaud P, Fernandez-Vidal S, Bardinet E, Coste J, Piallat B, Borg M, Besnard S, Sauleau P, Devaux B, Pidoux B, Chaynes P, Tézenas Du Montcel S, Bastian A, Langbour N, Teillant A, Haynes W, Yelnik J, Karachi C, Mallet L. Basal ganglia dysfunction in OCD: subthalamic neuronal activity correlates with symptoms severity and predicts high-frequency stimulation efficacy. Transl Psychiatry. 2011;1(April):1–10. doi: 10.1038/tp.2011.5. [DOI] [PMC free article] [PubMed] [Google Scholar]
- Wojtecki L, Hirschmann J, Elben S, Boschheidgen M, Trenado C, Vesper J, Schnitzler A. Oscillatory coupling of the subthalamic nucleus in obsessive compulsive disorder. Brain. 2017;140(9):1–3. doi: 10.1093/brain/awx164. [DOI] [PubMed] [Google Scholar]
- Wu HG, Miyamoto YR, Nicolas L, Castro G, Smith MA, Biology E. Temporal structure of motor variability is dynamically regulated and predicts motor learning ability. Nat Neurosci. 2015;17(2):312–321. doi: 10.1038/nn.3616.Temporal. [DOI] [PMC free article] [PubMed] [Google Scholar]
- Wu Z, Guo A, Fu X. Generation of low-gamma oscillations in a GABAergic network model of the striatum. Neural Netw. 2017;95:72–90. doi: 10.1016/j.neunet.2017.08.004. [DOI] [PubMed] [Google Scholar]
- Xu M, Li L, Pittenger C. Ablation of fast-spiking interneurons in the dorsal striatum, recapitulating abnormalities seen post-mortem in Tourette syndrome, produces anxiety and elevated grooming. Neuroscience. 2016;324:321–329. doi: 10.1016/j.neuroscience.2016.02.074. [DOI] [PMC free article] [PubMed] [Google Scholar]
- Yu Y, Sanabria DE, Wang J, Hendrix CM, Zhang J, Nebeck SD, Amundson AM, Busby ZB, Bauer DL, Johnson MD, Johnson LA, Vitek JL. Parkinsonism alters beta burst dynamics across the basal ganglia-motor cortical network. J Neurosci. 2021;41(10):2274–2286. doi: 10.1523/JNEUROSCI.1591-20.2021. [DOI] [PMC free article] [PubMed] [Google Scholar]
- Zinkstok J, van Nimwegen L, van Amelsvoort T, de Haan L, Yusuf MA, Baas F, Linszen D. Catechol-O-methyltransferase gene and obsessive–compulsive symptoms in patients with recent-onset schizophrenia: preliminary results. Psychiatry Res. 2008;157(1–3):1–8. doi: 10.1016/j.psychres.2007.02.001. [DOI] [PubMed] [Google Scholar]
Associated Data
This section collects any data citations, data availability statements, or supplementary materials included in this article.
Data Availability Statement
The data that support the findings of this study are available from the corresponding author upon reasonable request.


