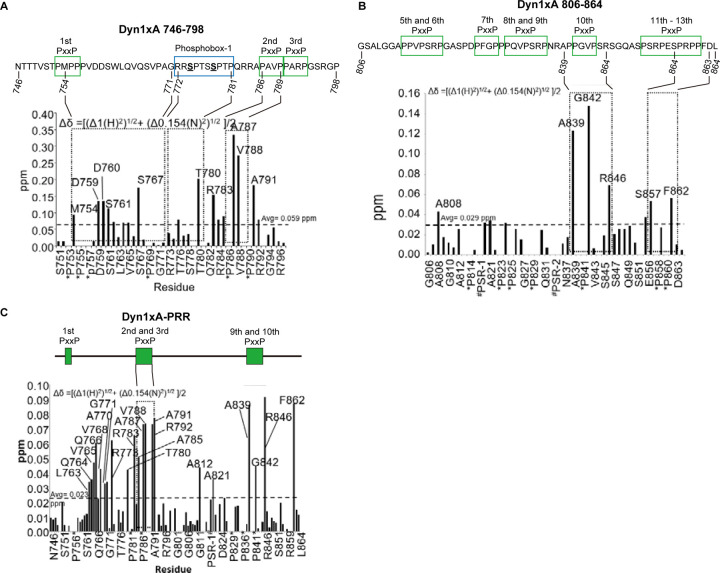
Figure 2. NMR titrations identify two distinct binding sites for Endophilin A1 SH3 on Dynamin.
(A-B) Summary of backbone amide chemical shift perturbations (Δδ in ppm) titration of Endophilin A1 SH3 into a solution of 15N-labelled Dyn1xA 746–798 (panel A) or Dyn1xA 806–864 (in B) calculated from the NMR experiments and plotted as a bar graph.
(C) Summary of the backbone amide chemical shift perturbations (Δδ in ppm) titration of Endophilin A1 SH3 into a solution of 15N-labelled GST-tagged Dyn1xA-PRR.
PxxP motifs are outlined as green boxes. Phosphobox-1 is outlined as a blue box.

