

Abstract
Oxidative stress is a predisposing factor in Chronic Obstructive Pulmonary Disease (COPD). Specifically, pulmonary epithelial (PE) cells reduce antioxidant capacity during COPD because of the continuous production of reactive oxygen species (ROS). However, the molecular pathogenesis that governs such ROS activity is unclear. Here we show that the dysregulation of intracellular calcium concentration ([Ca2+]i) in PE cells from COPD patients, compared to the healthy PE cells, is associated with the robust functional expressions of Transient Receptor Potential Canonical (TRPC)1 and TRPC3 channels, and Ca2+ entry (SOCE) components, Stromal Interaction Molecule 1 (STIM1) and ORAI1 channels. Additionally, the elevated expression levels of fibrotic, inflammatory, oxidative, and apoptotic markers in cells from COPD patients suggest detrimental pathway activation, thereby reducing the ability of lung remodeling. To further delineate the mechanism, we used human lung epithelial cell line, A549, since the behavior of SOCE and the expression patterns of TRPC1/C3, STIM1, and ORAI1 were much like PE cells. Notably, the knockdown of TRPC1/C3 in A549 cells substantially reduced the SOCE-induced [Ca2+]i rise, and reversed the ROS-mediated oxidative, fibrotic, inflammatory, and apoptotic responses, thus confirming the role of TRPC1/C3 in SOCE driven COPD-like condition. Higher TRPC1/C3, STIM1, and ORAI1 expressions, along with a greater Ca2+ entry, via SOCE in ROS-induced A549 cells, led to the rise in oxidative, fibrotic, inflammatory, and apoptotic gene expression, specifically through the extracellular signal-regulated kinase (ERK) pathway. Abatement of TRPC1 and/or TRPC3 reduced the mobilization of [Ca2+]i and reversed apoptotic gene expression and ERK activation, signifying the involvement of TRPC1/C3. Together these data suggest that TRPC1/C3 and SOCE facilitate the COPD condition through ROS-mediated cell death, thus implicating their likely roles as potential therapeutic targets for COPD.
Keywords: Calcium, ROS, Cellular signaling, lung disease, TRPC channel, pulmonary epithelial cells, Ca2+ signaling, oxidative stress, lung disease
Summary:
Alterations in Ca2+ signaling modalities in normal pulmonary epithelial cells exhibit COPD through oxidative stress and cellular injury, compromising repair, which was alleviated through inhibition of store-operated calcium entry.
Graphical Abstract
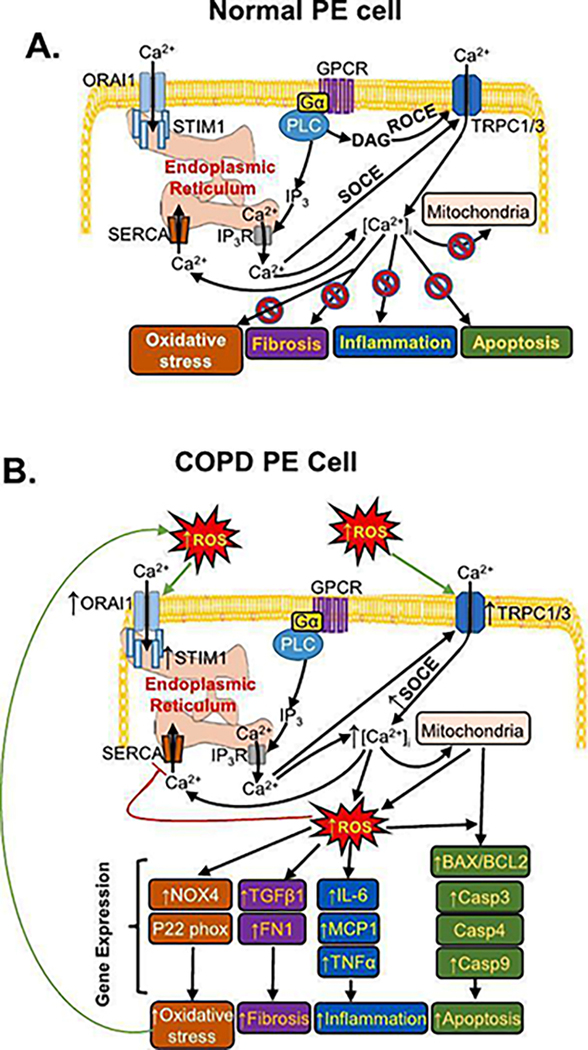
Schematic representation of the proposed mechanism in developing chronic obstructive pulmonary disease (COPD) condition in pulmonary epithelial (PE) cells causing injury via in PE cell involving intracellular calcium ([Ca2+]i) mobilization. A. Ca2+ entry in normal PE cells is activated through the GPCR-PLC pathway which yields diacylglycerol (DAG) to activate receptor-operated Ca2+ entry (ROCE), or IP3 to cause store-operated Ca2+ entry (SOCE). SOCE involves Transient Receptor Potential Canonical 1 (TRPC1) and TRPC3, through IP3 receptor (IP3-R) and by the activation of ORAI1 channels by STIM1. B. In COPD PE cells a greater and prolonged rise in [Ca2+]i, due to SOCE activation caused by the robust functional expressions of Transient Receptor Potential Canonical 1 (TRPC1), TRPC3, and the store-operated Ca2+ entry (SOCE) components, STIM1 and ORAI1. Antioxidant capacity in COPD PE cells is substantially reduced due to continuous production of ROS with the robust expressions of fibrotic, inflammatory, oxidative stress, and apoptotic marker. Functional interaction of TRPC1/C3 and TRPC1/C3-STIM1-Orai1 towards operating SOCE could potentially provide a novel mechanism for the development of COPD condition by compromising the repair and remodeling process. GPCR: G-protein coupled receptor; Gα: G-protein; PLC: Phospholipase C; DAG: diacylglycerol; IP3: Inositol trisphosphate; SERCA: sarco/endoplasmic reticulum Ca2+-ATPase; NOX4: Nicotinamide-adenine dinucleotide phosphate oxidases 4; transforming growth factor beta 1: TGF-β1; Fibronectin: FN1; IL-6: interleukin-6; MCP1: monocyte chemoattractant protein 1; BAX1: BCL2-associated X protein 1; BCL2: B-cell lymphoma 2.
1. Introduction:
Baseline reactive oxygen species (ROS) levels act as an integral component of cellular function. However, during certain conditions, such as drug metabolism or ischemia-reperfusion, ROS generation can overwhelm cellular antioxidant defenses that can lead to oxidative stress [1]. Although, it has been established that an increase in cytosolic [Ca2+] is critical for ROS generation [2,3], the mechanism of Ca2+ entry remains unclear. ROS-induced intracellular Ca2+ [(Ca2+)i] overload due to Ca2+ channel activation is critical for cell death in cardiomyocytes [4]. Interestingly, Ca2+ channel antagonists have been shown to inhibit oxidative stress in heart cells, which was mediated via the ROS-scavenging enzymes [5].
Oxidants were known to impose growth control on airway epithelial cells through the upstream modulation of receptor functions, leading to Ca2+ influx [6,7]. However, the regulation of cytosolic [Ca2+] in those epithelial cells remain elusive. The depletion of (Ca2+)i stores that induces Ca2+ entry has been shown to trigger agonist-mediated bronchial constriction and dysfunction of smooth muscle cells [8,9]. Thus, a rise in [Ca2+]i may serve as a shared signaling element towards promoting constriction and thickening of bronchial wall in diseased states such as asthma and chronic obstructive pulmonary disease (COPD).
Both internal and external sources of Ca2+ have been shown to generate Ca2+ signals in different cell types [10]. Specifically, activation of G-protein coupled receptors (GPCR), such as muscarinic or α–adrenergic receptors, acts as an initiator of the phosphoinositol metabolism resulting in the production of inositol 1,4,5-trisphosphate (IP3) and diacylglycerol (DAG) [11]. IP3 further releases Ca2+ from internal stores by binding to the IP3 receptor (IP3R), which activates Ca2+ channels of the plasma membrane to initiate store-operated Ca2+ entry (SOCE), causing the rise in cytosolic [Ca2+]i [10,12]. DAG, on the other hand, can directly activate plasma membrane’s Ca2+ channels, known as receptor-operated Ca2+ entry (ROCE; [13]). We have shown the role of the transient receptor potential canonical (TRPC) subfamily of channels in regulating Ca2+ entry in various epithelial cell types [14–17]. While TRPC3 and TRPC6 appear to be activated by phosphatidylinositol 4,5-bisphosphate (PIP2) hydrolysis, TRPC1 seems to induce store-depletion and in turn induce Ca2+ entry [18–20]. Interestingly, in salivary epithelial cells GPCR activated Ca2+-signaling was shown to induce both TRPC1 and TRPC3 channels through heteromeric interaction [21], however, such function in native cells remains unknown. Although Ca2+ entry via TRPCs is required for inherent cellular functions [22], the sustained elevation of cytosolic [Ca2+]i, we found during oxidative stress in renal epithelial cells [23], could also be deleterious to pulmonary epithelial (PE) cells.
Activation of mammalian TRPC channels can enhance oxidative stress [24]. Our recent study supports this idea of linking GPCR-induced prolonged rise in [Ca2+]i, and subsequent ROS generation, which leads to renal epithelial cell damage [25]. Furthermore, we have shown that the upregulation of two endoplasmic reticular (ER) SOCE components, STIM1 and STIM2, and SOCE channel, ORAI3, during ER stress, evoked ROS production and contributed to oxidative stress-induced cell death [26]. However, the impact of these SOCE players and their role(s) in such detrimental Ca2+ signaling/oxidative stress in PE cells remain unknown. Here we show for the first time that targeting TRPC1/C3 or STIM1/ORAI1 can hinder ROS-induced deleterious responses in COPD-PE cells, which implicates the possible roles of TRPC1/C3, and STIM1-ORAI1 complex in store-operated Ca2+ influx. Our data provide insight into the molecular mechanisms of (Ca2+)i dysregulation, ROS generation, ER stress, and cell death in PE cells during COPD, and thus, could have a translational role by providing potential novel therapeutic targets for the treatment of COPD. Taken together, modulation of Ca2+ signaling can be used as a tool to reverse the pathological consequences of COPD condition.
2. Methods and Materials
2.1. Reagents and chemicals
NPS-2143 and SKF-96365 were purchased from Tocris Bioscience (Minneapolis, MN). Bis-chloroethylnitrosourea (BCNU), carbachol (CCh), Pyr3, Pyr6, Pyr10, 2-Aminoethoxydiphenyl borate (2-APB), thapsigargin (Tg), 1-oleoyl-2-acetyl-sn-glycerol (OAG) and ionomycin were obtained from Sigma-Aldrich (St Louis, MO). Pico1,4,5 and Synta66 were purchased from MedChemExpress (Monmouth Junction, NJ). GSK2833503A and GSK1702934A were purchased from BioTechne (Minneapolis, MN). We procured F-12K medium, Fetal Bovine Serum (FBS), penicillin, streptomycin, and Fura-2-acetoxymethyl ester (Fura-2-AM) from Invitrogen (Carlsbad, CA). SAGM SingleQuot kit and SABM basal medium were purchased from Lonza (Walkersville, MD). All chemicals utilized are of analytical grade.
2.2. Cell culture
Small airway epithelial cells (cc-2547) and D-SAEC-COPD small airway epithelial cells (cc-2934) were purchased from Lonza (Walkersville, MD) and were cultured in SAGM medium that was prepared with SAGM SingleQuots Kit and the SABM Basal Medium, according to manufacturer’s instructions, at 37°C in 5% CO2 [27]. A549 cells (CCL-185) were obtained from ATCC (Manassas, VA), and seeded in culture using F-12K medium, supplemented with 10% FBS, 2mM glutamine and 1% penicillin/streptomycin at 37°C in 5% CO2 [28]. All experiments with PE and COPD cells were performed on the 2nd and 3rd passages and we followed the same for using A549 cells to minimize the variation between the passages and preserve the optimal cellular functions.
2.3. ROS induction in cells
Cells were placed in F-12K complete culture media and grown to 80% confluency until they were subcultured or used for experiments. For BCNU treatments, appropriate amounts (50–100μM) were added in serum-free media and incubated for several time points (6, 12, 18, or 24 h) under standard humidified conditions at 37 °C in 5% CO2.
2.4. Transfection of siRNA
A549 cells were transfected with (10 nM) targeted siRNA(s) against TRPC1 (Santa Cruz Biotechnology, Santa Cruz CA; sc-42664), TRPC3 (Santa Cruz Biotechnology, Santa Cruz CA; sc-42666), ORAI1 (Santa Cruz Biotechnology, Santa Cruz CA; sc-76001), STIM1 (Santa Cruz Biotechnology, Santa Cruz CA; sc-76589) and nontarget (scrambled) siRNA-A (Santa Cruz Biotechnology, Santa Cruz CA; sc-37007) as negative control. An average of 1×10⁶ cells per well were seeded in a 6-well plate or glass-bottom dish as required for the experimental setup. Transfection was performed using Lipofectamine-2000 Reagent (ThermoFisher Scientific, Waltham, MA) according to manufacturer’s instructions. The efficiency of siRNA-mediated gene silencing was evaluated by RT-PCR analysis as previously described [25].
2.5. [Ca2+]i Fura-2 measurements by time-lapse fluorescence
[Ca2+]i measurements were conducted on Fura-2-AM loaded cells as previously described [25,29]. Experiments were performed within humidified microincubator with gaseous mixture of 95% air and 5% CO2 set to 37°C. Fluorescence was recorded at emission peak absorbance of 500 nm wavelength with an excitation peak absorbance that continuously shifted 340 nm and 380 nm wavelengths. Real-time recordings were set to different points of time (300–500 s) at 1 s intervals and were measured at an average of 50–150 cells. Fluorescence absorbance was analyzed offline using Slidebook™ software. Statistical analysis and graph plotting was performed using Origin 6.1.
2.6. Electrophysiology
Whole-cell patch clamp was performed as described previously [25,29]. Cells were bathed in external solution containing (in mM): 140 NaCl, 4 KCl, 1 MgCl2, 2 CaCl2, 5 D-glucose, and 10 HEPES (NaOH, pH 7.4). The intracellular solution contained (in mM): 50 CsCl, 10 NaCl, 60 CsF, 20 EGTA, and 10 HEPES (CsOH, pH 7.2). I-V were recorded and measured every 3 s by applying voltage ramps (300 ms) from −100 mV to +100 mV at a holding potential of −80 mV. Before establishing the whole-cell configuration, the membrane resistance was >500 MΩ. All experiments were conducted at room temperature (25 °C).
2.7. H2O2 release measurement
H2O2 release from cells was assessed using an H2O2 Cell-Based Assay Kit (Cayman Chemicals, Ann Arbor, MI) according to the manufacturer’s instructions. H2O2 release was calculated by subtracting the background wavelength (540 nm) from the emission wavelength (590 nm).
2.8. Lactate dehydrogenase (LDH) release measurement
LDH release from A549 cells treated with BCNU was measured using a Pierce LDH Cytotoxicity Assay kit (ThermoFisher Scientific) according to manufacturer’s instructions. LDH release reaction in external media was assessed by the subtraction of the absorbance at 680 nm (background) from the absorbance at 490 nm.
2.9. DAPI (4′,6-diamidino-2-phenylindole) staining
DAPI staining was used to detect apoptotic nuclei as previously described [25]. Cells were fixed with 3% paraformaldehyde and permeabilized with 0.01% Triton X-100 in 0.1% BSA for 2 min. Cells were then washed with 1× PBS once and incubated with DAPI (1 μg/ml in 1× PBS pH 7.4) in 500 μl in dark conditions. DAPI solution was then removed, and cells were washed twice with 1× PBS and visualized under fluorescence microscopy (Axiovision, Carl Zeiss). Cell death percentage was calculated: # of cells indicative of cell death/the total # of cells x 100.
2.10. Detection of ROS using 2′,7′-dichlorodihydrofluorescein diacetate (H2DCFDA)
Carboxy-H2DCFDA reagent was oxidized in the presence of ROS and developed green fluorescence. Intracellular fluorescent ROS measurements were performed using a cell-permeable probe, H2DCFDA [30]. Cells were incubated with H2DCFDA (10 μM) in a colorless HBSS (Invitrogen) medium for 30 min at 37°C in dark conditions. Subsequently the media were removed, and the cells were rinsed (1 × PBS) for visualization and measurement of fluorescence under a Zeiss LSM710 laser-scan fluorescence microscope (Carl Zeiss).
2.11. Annexin V apoptosis assay
Small airway epithelial cells or COPD small airway epithelial cells undergoing apoptosis were detected with the Alexa Fluor 488 Annexin V/Dead Cell Apoptosis Kit (ThermoFisher Scientific, Waltham, MA; [31]). Cells were washed with 1× binding buffer and incubated with Annexin V for 15 min at room temperature as described by the manufacturer’s protocol. Cells were then washed again with 1 × binding buffer twice. Fluorescent images were obtained using a Zeiss LSM710 laser-scan fluorescence microscope (Carl Zeiss).
2.12. Cell viability assay
BCNU-treated cells were lifted-off using trypsin and were stained with trypan blue 0.4% w/v in 1 × PBS). Both living and dead cells were counted using a hemocytometer. Percentage cell viability was calculated by dividing the number of live cells by the total number of cells and multiplying by 100.
2.13. Gene expression analyses
Total RNA was extracted with Trizol reagent (Invitrogen, CA, USA) as previously described [25]. Subsequently, DNase treatment has been performed, and RNA concentration was measured using a nanodrop spectrophotometer. Afterwards, a cDNA synthesis kit (Promega, Madison, WI) was used to produce cDNA by reverse transcription of RNA. The cDNA was amplified using gene specific primers (Table 1) from either Invitrogen or Integrated DNA Technologies (Coralville, IA), along with a master mix PCR amplification reagent (Promega). With a T100 Thermocycler (Bio-Rad, Hercules, CA), the following PCR conditions were used: one initial cycle at 95 °C for 3 min; 30–35 cycles of denaturation at 95 °C for 30 s, annealing at 55 °C for 30 s, elongation at 72 °C for 45 s; an additional 5 min at 72 °C; and a final hold at 4 °C.
Table 1:
Primer information
| Primer | Sequence (sense, antisense) | Expected Band Size (dp) |
|---|---|---|
| hBAX1 | 5’ – ATG GAC GGG TCC GGG GAG – 3’ 5’ – ATC CAG CCC AAC AGC CGC – 3’ |
455 |
| hBCL2 | 5’ – AAG CCG GCG ACG ACT TCT – 3’ 5’ – GGT GCC GGT TCA GGT ACT CA – 3’ |
258 |
| hCasp3 | 5’ – TTA ATA AAG GTA TCC ATG GAG AAC ACT – 3’ 5’ – TTA GTG ATA AAA ATA GAG TTC TTT TGT GAG – 3’ |
849 |
| hCasp4 | 5’ – GCT GTT TAC AAG ACC CAC GTG – 3’ 5’ – GTG GCT TCC ATT TTC AAT TGC – 3’ |
280 |
| hCasp9 | 5’ – GAG TCA GGC TCT TCC TTT G – 3’ 5’ – CCT CAA ACT CTC AAG AGC AC – 3’ |
241 |
| hCLDN 1 | 5’ – GGT GCA GAA GAT GAG GAT GGC TG -3’ 5’ – AGC CAG TGA AGA GAG CCT GAC G -3’ |
170 |
| hERN1 | 5’ -AGA GAA GCA GAC TTT GTC -3’ 5’-GTT TTG GTG TCG TAC ATG GTG A -3’ |
108 |
| hFN-1 | 5’ – AGC AGA CCC AGC TTA GAG TT – 3’ 5 ’ – GCA GAA GTG TTT GGG TGA CT – 3’ |
310 |
| hGAPDH | 5’ – TCC CTG AGC TGA ACG GGA AG -3’ 5 ’ – GGA GGA GTG GGT GTC GCT GT-3’ |
218 |
| hGRP78 | 5’-GGA TCA TCA ACG AGC CTA CG -3’ 5’-CAC CCA GGT CAA ACA CCA G -3’ |
90 |
| hIL-6 | 5’ – ATG AAC TCC TTC TCC ACA AG – 3’ 5’ – AGA GCC CTC AGG CTG GAC TG – 3’ |
626 |
| hMCP-1 | 5’ – GAT CTC AGT GCA CAG GCT CG – 3’ 5’ – TTT GCT TGT CCA GGT GGT CC – 3’ |
155 |
| hNFκB | 5’ – GTG GAG GCA TGT TCG GTA GT – 3’ 5’ – AGC TGC AGA GCC TTC TCA AG – 3’ |
373 |
| hNOX4 | 5’ – CCG GCT GCA TCA GTC TTA ACC – 3’ 5’ – TCG GCA CAG TAC AGG CAC AA – 3’ |
220 |
| hOrai 1 | 5’-AGC AAC GTG CAC AAA TCT CAA -3’ 5’-GTC TAT GGC TAA CCA GTG A -3’ |
344 |
| hOrai2 | 5’–CGG CCA TAA GGG CAT GGA TT -3’ 5’ -TTG TGG ATG TTG CTC ACG GC -3’ |
333 |
| hOrai3 | 5’ – CTC TTC CTT GCT GAA GTT GT -3’ 5’ – CGA TTC AGT TCC TCT AGT TC -3’ |
380 |
| hP22 Phox |
5’ -ATG GGG CAG ATC GAG TGG GCC ATG – 3’ 5’ – TCACACGACCTCATCTGTCACTGG – 3’ |
588 |
| hSMα | 5’ – TGT GGC TAT CCA GGC GGT GC – 3’ 5’ – TCT CGG CCA GCC AGA TCC AGA C – 3’ |
153 |
| hSTIM1 | 5’-TGT GGA GCT GCC TCA GTA TG -3’ 5’-AAG AGA GGA GGC CCA AAG AG -3’ |
183 |
| hSTIM2 | 5’-TGT CAC TGA GTC CAC CAT GC -3’ 5 – GGG CGT GTT AGA GGT CCA AA -3’ |
469 |
| hTGFβ-1 | 5’ – ACT ACT ACG CCA AGG AGG TCA C – 3’ 5’ – GAG AGC AAC ACG GGT TCA GG – 3’ |
148 |
| hTNFα | 5’ – GGC GTG GAG CTG AGA GAT AAC – 3’ 5’ – GGT GTG GGT GAG GAG CAC AT – 3’ |
120 |
| hTRPC1 | 5’ – CTA TGG AGA AGA ACT GCA GTC – 3’ 5’ – GGA AGT CAA GTA ACG ATG CAC – 3’ |
400 |
| hTRPC3 | 5’ – TGT TCA ATG CCT CAG ACA GG – 3’ 5’ – AGT GTC ACT TCA CTG AGG TC – 3’ |
343 |
| hTRPC4 | 5’ – TGG AAC AAT AGG GAG GCG AG – 3’ 5’ – TCT CTC AAG TGG TCC TGC AG – 3’ |
580 |
| hTRPC5 | 5’ – ACC AGA GCT ATC GAT GAG CC – 3’ 5’ – ACT GGG TTC AGA CAT ATG ACC – 3’ |
951 |
| hTRPC6 | 5’ – CTT TTG CTG AAG GCA AGA GG – 3’ 5’ – CTG CAC AGA TCA AGG AGT CC – 3’ |
457 |
| hTRPC7 | 5’ – CTG CAC AAT GTC TCG CTT C – 3’ 5’ – TGA GGC ACA TCT TGA TTC TC – 3’ |
655 |
| hβ-actin | 5’ – ATC GTG GGG CGC CCC AGG CAC – 3’ 5’ – CTC CTT AAT GTC ACG CAC GAT TTC – 3’ |
543 |
2.14. Protein expression analyses
Proteins were extracted from cells and analyzed using SDS-PAGE (using 4–12% gels; Invitrogen) and subsequently transferred onto an Immobilon-PSQ transfer membrane (Millipore Corp, Bedford, MA) at room temperature as previously described [15]. Equal amount of protein (20 μg) from each sample was loaded into gel for Western blot analyses. Antibody labeling was detected via enhanced chemiluminescence (ECL) using primary antibodies as described in Table 2. Anti-mouse secondary antibodies from Sigma-Aldrich and ECL kit from Pierce (Invitrogen) were used.
Table 2:
Antibody information
| Primary Antibody | Protein | Dilution | Company |
|---|---|---|---|
| Mouse monoclonal antibody | TRPC1 | 1:500 | Santa Cruz Biotechnology |
| Mouse monoclonal antibody | TRPC3 | 1:500 | Santa Cruz Biotechnology |
| Mouse monoclonal antibody | STIM1 | 1:500 | Sigma Chemicals |
| Rabbit polyclonal antibody | ORAI1 | 1:500 | Sigma Chemicals |
| Mouse monoclonal antibody | BAX1 | 1:1000 | Santa Cruz Biotechnology |
| Mouse monoclonal antibody | BCL2 | 1:1000 | Santa Cruz Biotechnology |
| Mouse monoclonal antibody | Casp3 | 1:1000 | Santa Cruz Biotechnology |
| Mouse monoclonal antibody | ERK | 1:1000 | Santa Cruz Biotechnology |
| Mouse monoclonal antibody | p-ERK | 1:1000 | Santa Cruz Biotechnology |
| Mouse monoclonal antibody | β-actin | 1:2000 | Santa Cruz Biotechnology |
| Mouse monoclonal antibody | GAPDH | 1:2500 | Santa Cruz Biotechnology |
2.15. Statistical analysis
Statistical comparisons were performed using Student’s unpaired t-test (two-tailed) in Origin 6.1 or one-way ANOVA with post-hoc Tukey’s test in PSPP 1.4 (GNU), as appropriate. Statistically significant comparisons were accepted at P < 0.05 (*) or P < 0.01 (**).
3. Results
3.1. COPD drives SOCE function and channel protein expression mediated by TRPC1 and TRPC3
We initially assessed SOCE in healthy human PE and COPD cells. Application of Tg (0.5 μM), a non-competitive inhibitor of the sarco/endoplasmic reticulum Ca2+-ATPase pump that induces [Ca2+]i rise and can activate SOCE [32], resulted in an expected rise in [Ca2+]i in these PE cells due to [Ca2+]i release from the ER stores (Figure 1A). A subsequent application of 2 mM extracellular Ca2+ ([Ca2+]o) further mobilized [Ca2+]i, indicating a Ca2+ entry through a Ca2+ channel (Figure 1A). Next, we analyzed the presence of a functional TRPC channel by using SKF-96365, as a TRPC channel inhibitor [33]. Our data showed a significant reduction in Ca2+ response by SKF-96365, suggesting that a TRPC channel was working in tandem to induce SOCE (Figure 1A). Moreover, addition of 2-APB, a known membrane permeable intracellular IP3-R and SOCE inhibitor [34], significantly diminished [Ca2+]i mobilization after the application of 2 mM [Ca2+]o in PE cells (Figure 1A). In both PE and diseased (COPD) cells, Tg induced a steep rise in Ca2+ release and a prolonged return to baseline (Figure 1A–B). PE cells exhibited a slight decrease in Ca2+ release upon 2-APB application, while there were no changes in COPD cells (Figure 1A–B). However, replenishing the cell bath with 2.0 mM Ca2+ elicited a sharp and greater Ca2+ rise followed by a prolonged Ca2+ entry in COPD cells (Figure 1B). Inhibition with SKF-96365 in COPD cells blocked Ca2+ entry by nearly 60% and 2-APB completely inhibited the Ca2+ entry, proportionally like those of the PE cells (Figure 1A–B), which may suggest that the SOCE is activated with the same receptor components.
Figure 1. Store-operated Ca2+ entry activation involves TRPC channel in PE or COPD cells.
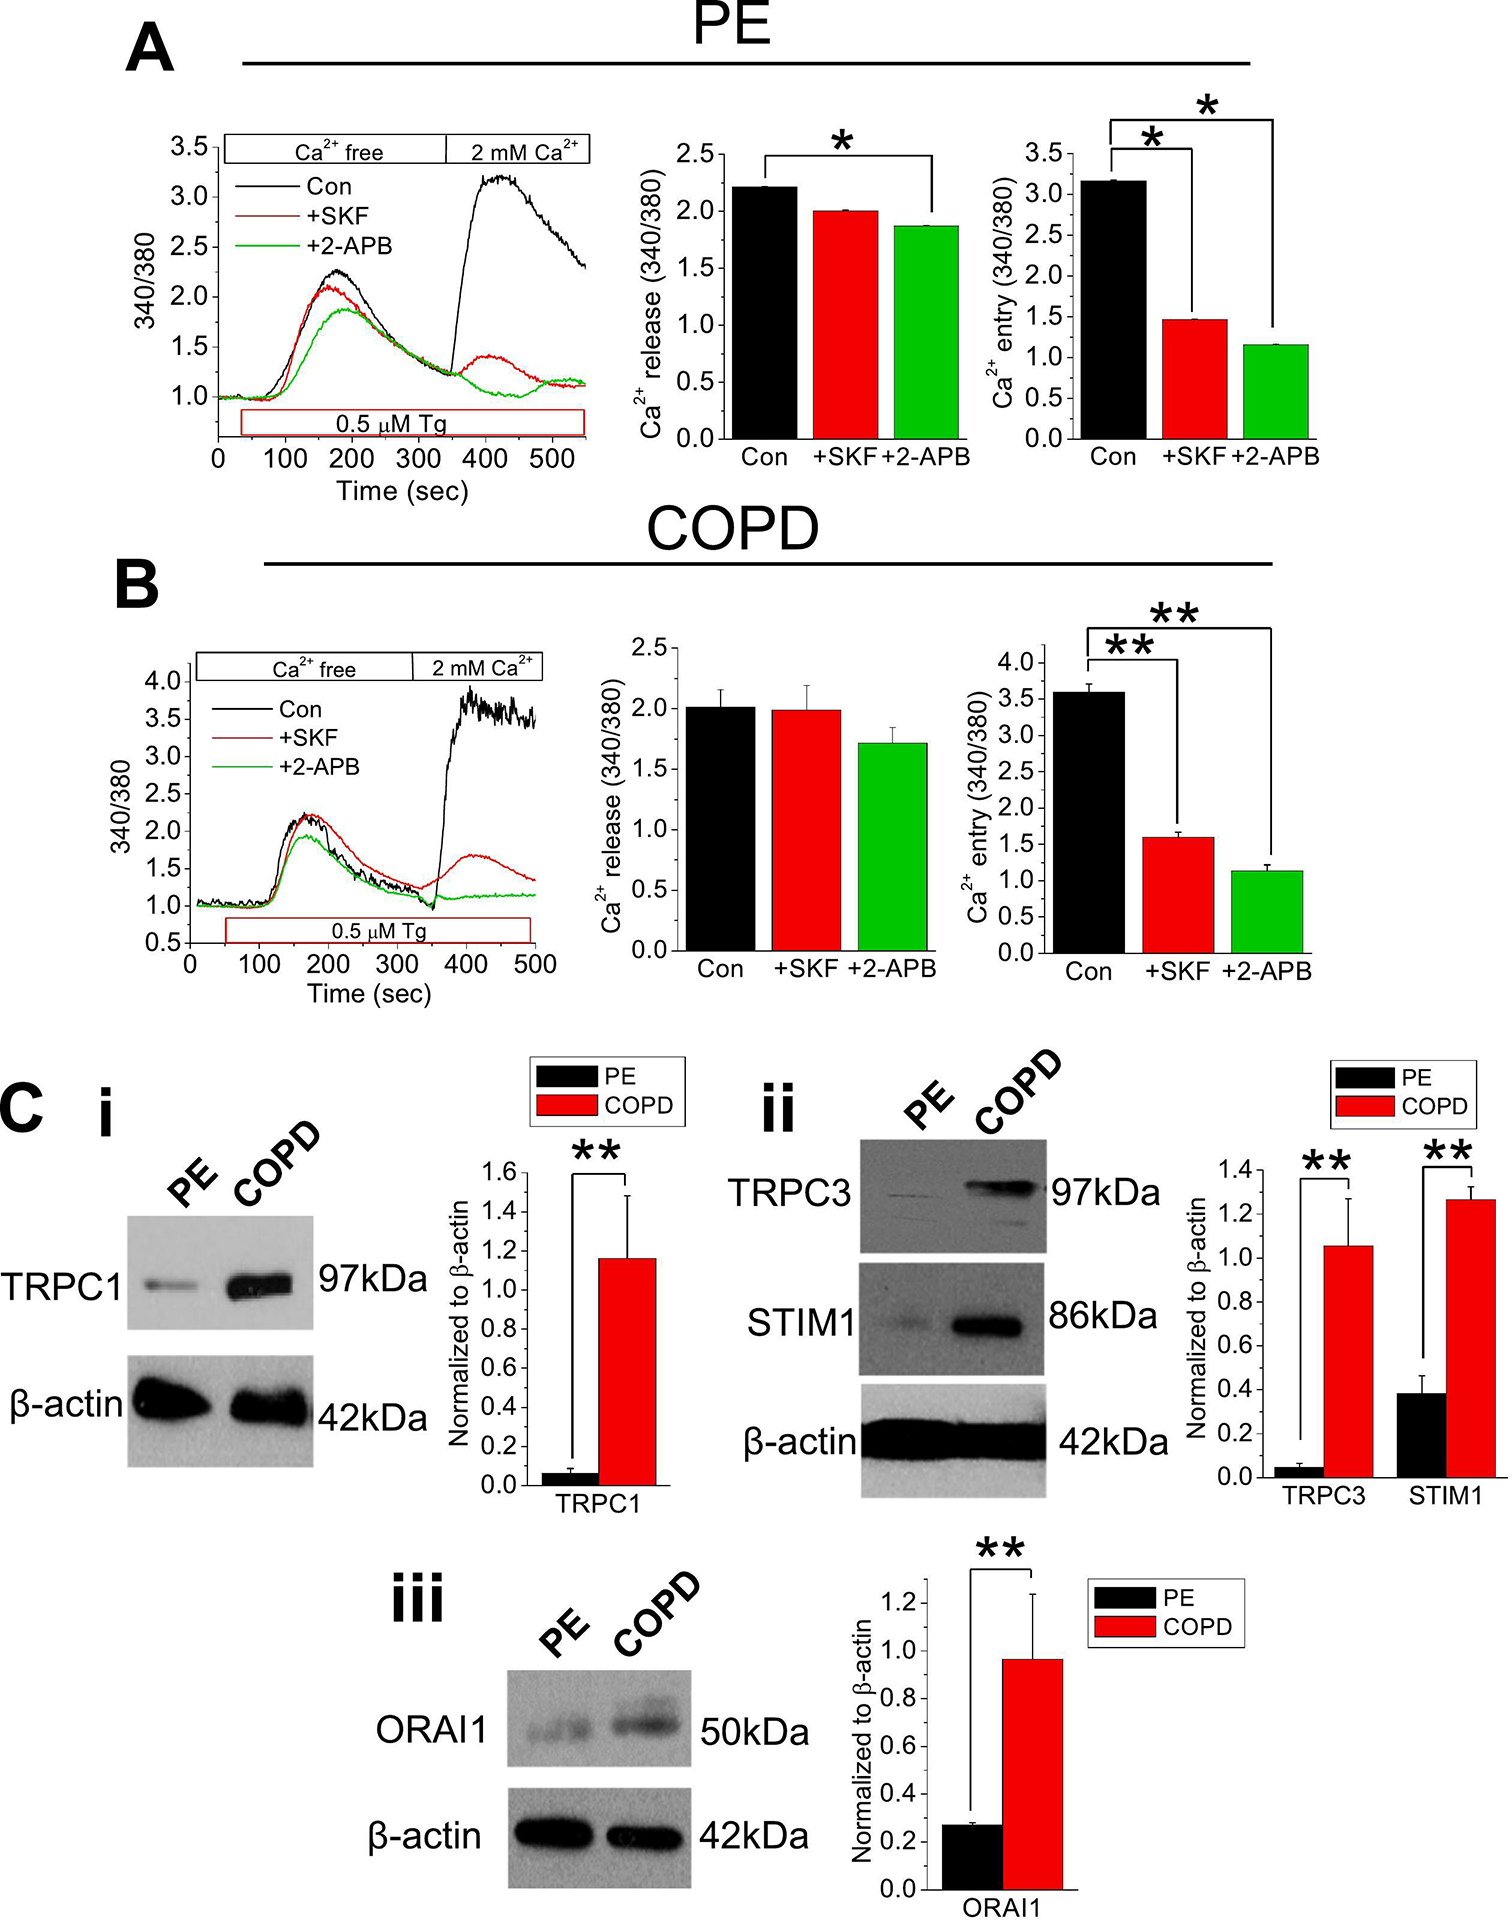
Fura-2 ratiometric (340/380) [Ca2+]i measurements were retrieved from (A) PE or (B) COPD cells in Ca2+-free cell bath. Thapsigargin (Tg; 0.5 μM) was applied to cells with: no inhibitor (control; Con), 10 μM SKF-96365 (SKF), or 12 μM 2-APB, then the cell bath was replenished with 2.0 mM Ca2+. Quantitated bar diagrams (A, B) are depicting Ca2+ release or Ca2+ peaks. (C) Western blots showing expression of (i) TRPC1, (ii) TRPC3 and STIM1, or (iii) ORAI1 proteins in normal PE and COPD cells. Relative expressions normalized to β-actin are shown in bar diagrams. All bar diagrams are presents as mean + SEM. *, P < 0.05; **, P < 0.01. Experiments were performed n = 3 times. Student’s two-tailed t-test was performed to evaluate statistical significance between control (Con or PE) and experimental groups (+SKF, +2-APB, or COPD).
Having established the involvement of TRPC channel(s) in SOCE in normal PE and COPD epithelial cells, we next sought to measure TRPC channel expression. Here we assessed the full complement of TRPC channels and identified transcript expressions of TRPC channels C1 and C3 in both PE and COPD cells (Figure S1A). Of note, TRPC1 and TRPC3 channel expressions were much enhanced in COPD cells compared to normal epithelial cells (Figure 1Ci–ii). We also assessed the transcripts of SOCE-molecular components, STIM and ORAI, in normal PE and COPD cells, which depicted prominent expressions of STIM1 and ORAI1 (Figure S1B). Interestingly, expressions of STIM1 and ORAI1 were much enhanced in COPD compared to PE cells, which may point to greater utilization of the SOCE pathway in COPD (Figure 1Cii–iii).
3.2. COPD amplifies SOCE-induced current mediated by TRPC3
Since our findings revealed prolonged dysregulated Ca2+ entry in COPD epithelial cells and enhanced expressions of STIM1, ORAI1, TRPC1, and TRPC3 channels, we sought to further examine the SOCE activity using whole cell patch clamp experiments. Here, we examined the electrophysiological characteristics of both PE and COPD cells by i) blocking IP3-induced SOCE (2-APB) pathway; ii) using an inhibitor of TRPC channel, SKF-96365; and iii) application of Pyr3, a TRPC3 inhibitor [35]. Current was evoked by either Tg or CCh, a muscarinic receptor agonist [36]. The I-V curves for both normal and COPD cells revealed an outwardly rectified current, commonly found in TRPC channels [35]. The applied Tg activated the current and the subsequent application of 2-APB blocked the activated current by approximately half (Figure 2A). Interestingly, the application of Tg in COPD cells resulted in greater current activation, approximately twice more compared to PE cells, indicating greater SOCE response (Figure 2A–B). Moreover, application of 2-APB in these cells completely inhibited the activated Tg current to baseline, confirming that the activated current was IP3-R induced SOCE (Figure 2B). When CCh was applied to the healthy PE cells, the current at +100 mV was activated significantly (Figure 2C). Again, a current was evoked to a greater extent in COPD cells compared to that of its healthy counterpart (Figure 2C–D). Application of SKF-96365 inhibited ~75% of the CCh current in both healthy and COPD lung cells, suggesting that TRPC channels mediate the CCh-elicited responses for the PE cells (Figure 2C–D). Next, we utilized Pyr3 in COPD cells which inhibited nearly all the current activity induced by CCh (100 μM), suggesting that most of the muscarinic activation is mediated through TRPC3 (Figure 2E–F). It should also be noted, however, that Pyr3 can also inhibit the ORAI1-mediated Ca2+ entry, which can also work in SOCE with TRPC3 channels [37].
Figure 2. Enhanced Tg-induced SOCE current in COPD cells.
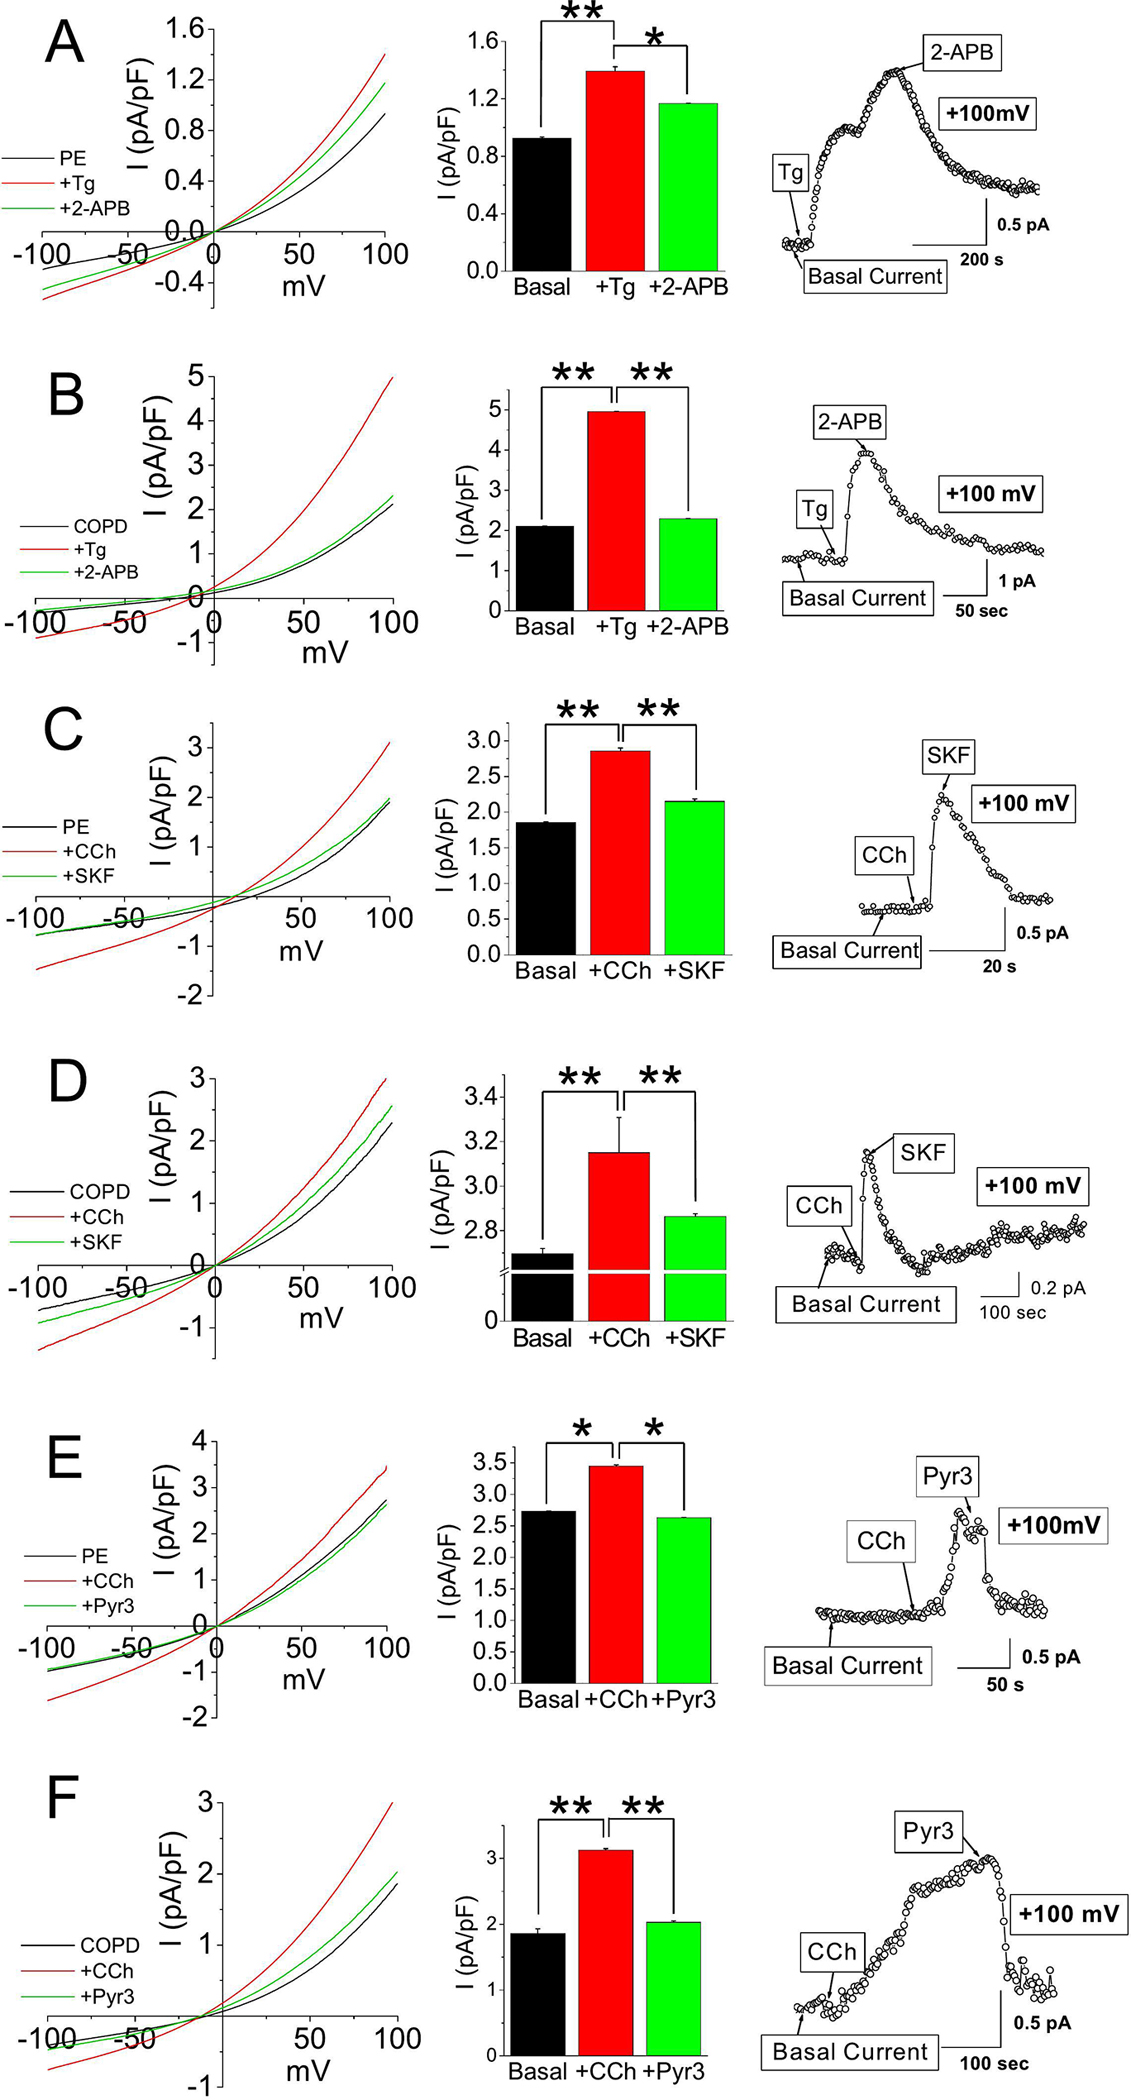
Current densities of voltage ramps from −100 to +100 mV were collected from PE or COPD cells and quantitated into I-V curves (A-F). After receiving baseline measurements from the cells, (A-B) Tg (0.5 μM) or (C-F) CCh (100 μM) was applied as an agonist, and then 2-APB (12 μM), SKF-96365 (SKF; 10 μM), or Pyr3 (3 μM) was applied as an inhibitor to the induced current. Bar graphs in A-F show average current densities at +100 mV in mean + SEM. *, P < 0.05; ** P < 0.01. Experiments were performed n=3 times. Student’s two-tailed t-test was performed to assess statistical significance between basal and activated/inhibited current densities of PE or COPD cells with agonist (CCh or Tg; A-F), and inhibitor (SKF-96365, 2-APB, or Pyr3; A-F).
3.3. COPD mediated by ROS-forming oxidases enhances fibrosis, inflammation, and apoptosis
Nicotinamide-adenine dinucleotide phosphate (NADPH) oxidases (NOXs) have been recognized as an important source of ROS in COPD [38]. We measured the transcript levels of NOX4 and P22 phox, regulatory subunits of NOX, and found that NOX4 was consistently augmented in COPD compared to normal PE cells (Figure 3A). Furthermore, the expression of transforming growth factor beta 1 (TGFβ1), a multifunctional cytokine, was also elevated in COPD cells compared to normal PE cells, which may have contributed to the increase in NOX4 expression, as well as the elevated expression of fibronectin (FN1), an indicator of lung remodeling ([39,40]; Figure 3B). Expressions of interleukin (IL)-6, monocyte chemoattractant protein 1 (MCP1), Tumour Necrosis Factor α (TNFα) [inflammatory markers; Figure 3C)]; BAX/BCL2 ratio (apoptosis), Caspase (Casp) 3 and Casp9, with exception of Casp4 (executors of apoptosis; Figure 3D) were also elevated. These findings characterized COPD-PE cells revealing a profile of challenged lung capacity [41], inflammation, and apoptosis compared to normal PE cells. With evidence of enhanced apoptosis in COPD-PE cells compared to normal cells, and earlier established involvement of TRPC channel and SOCE in Ca2+ regulation, both cells were treated with Tg to elicit the depletion of stored Ca2+ and affected Ca2+ entry with either TRPC channel inhibitor, SKF-96365 or SOCE inhibitor, 2-APB. The inhibition of the TRPC channel and IP3-R protected against intracellular ROS production and cell death in COPD cells, unraveling a potential role for TRPC channel in cell death/protection (Figure 3E–G, S2).
Figure 3. COPD induces oxidative stress leading to upregulation of inflammation, fibrosis, and apoptosis.
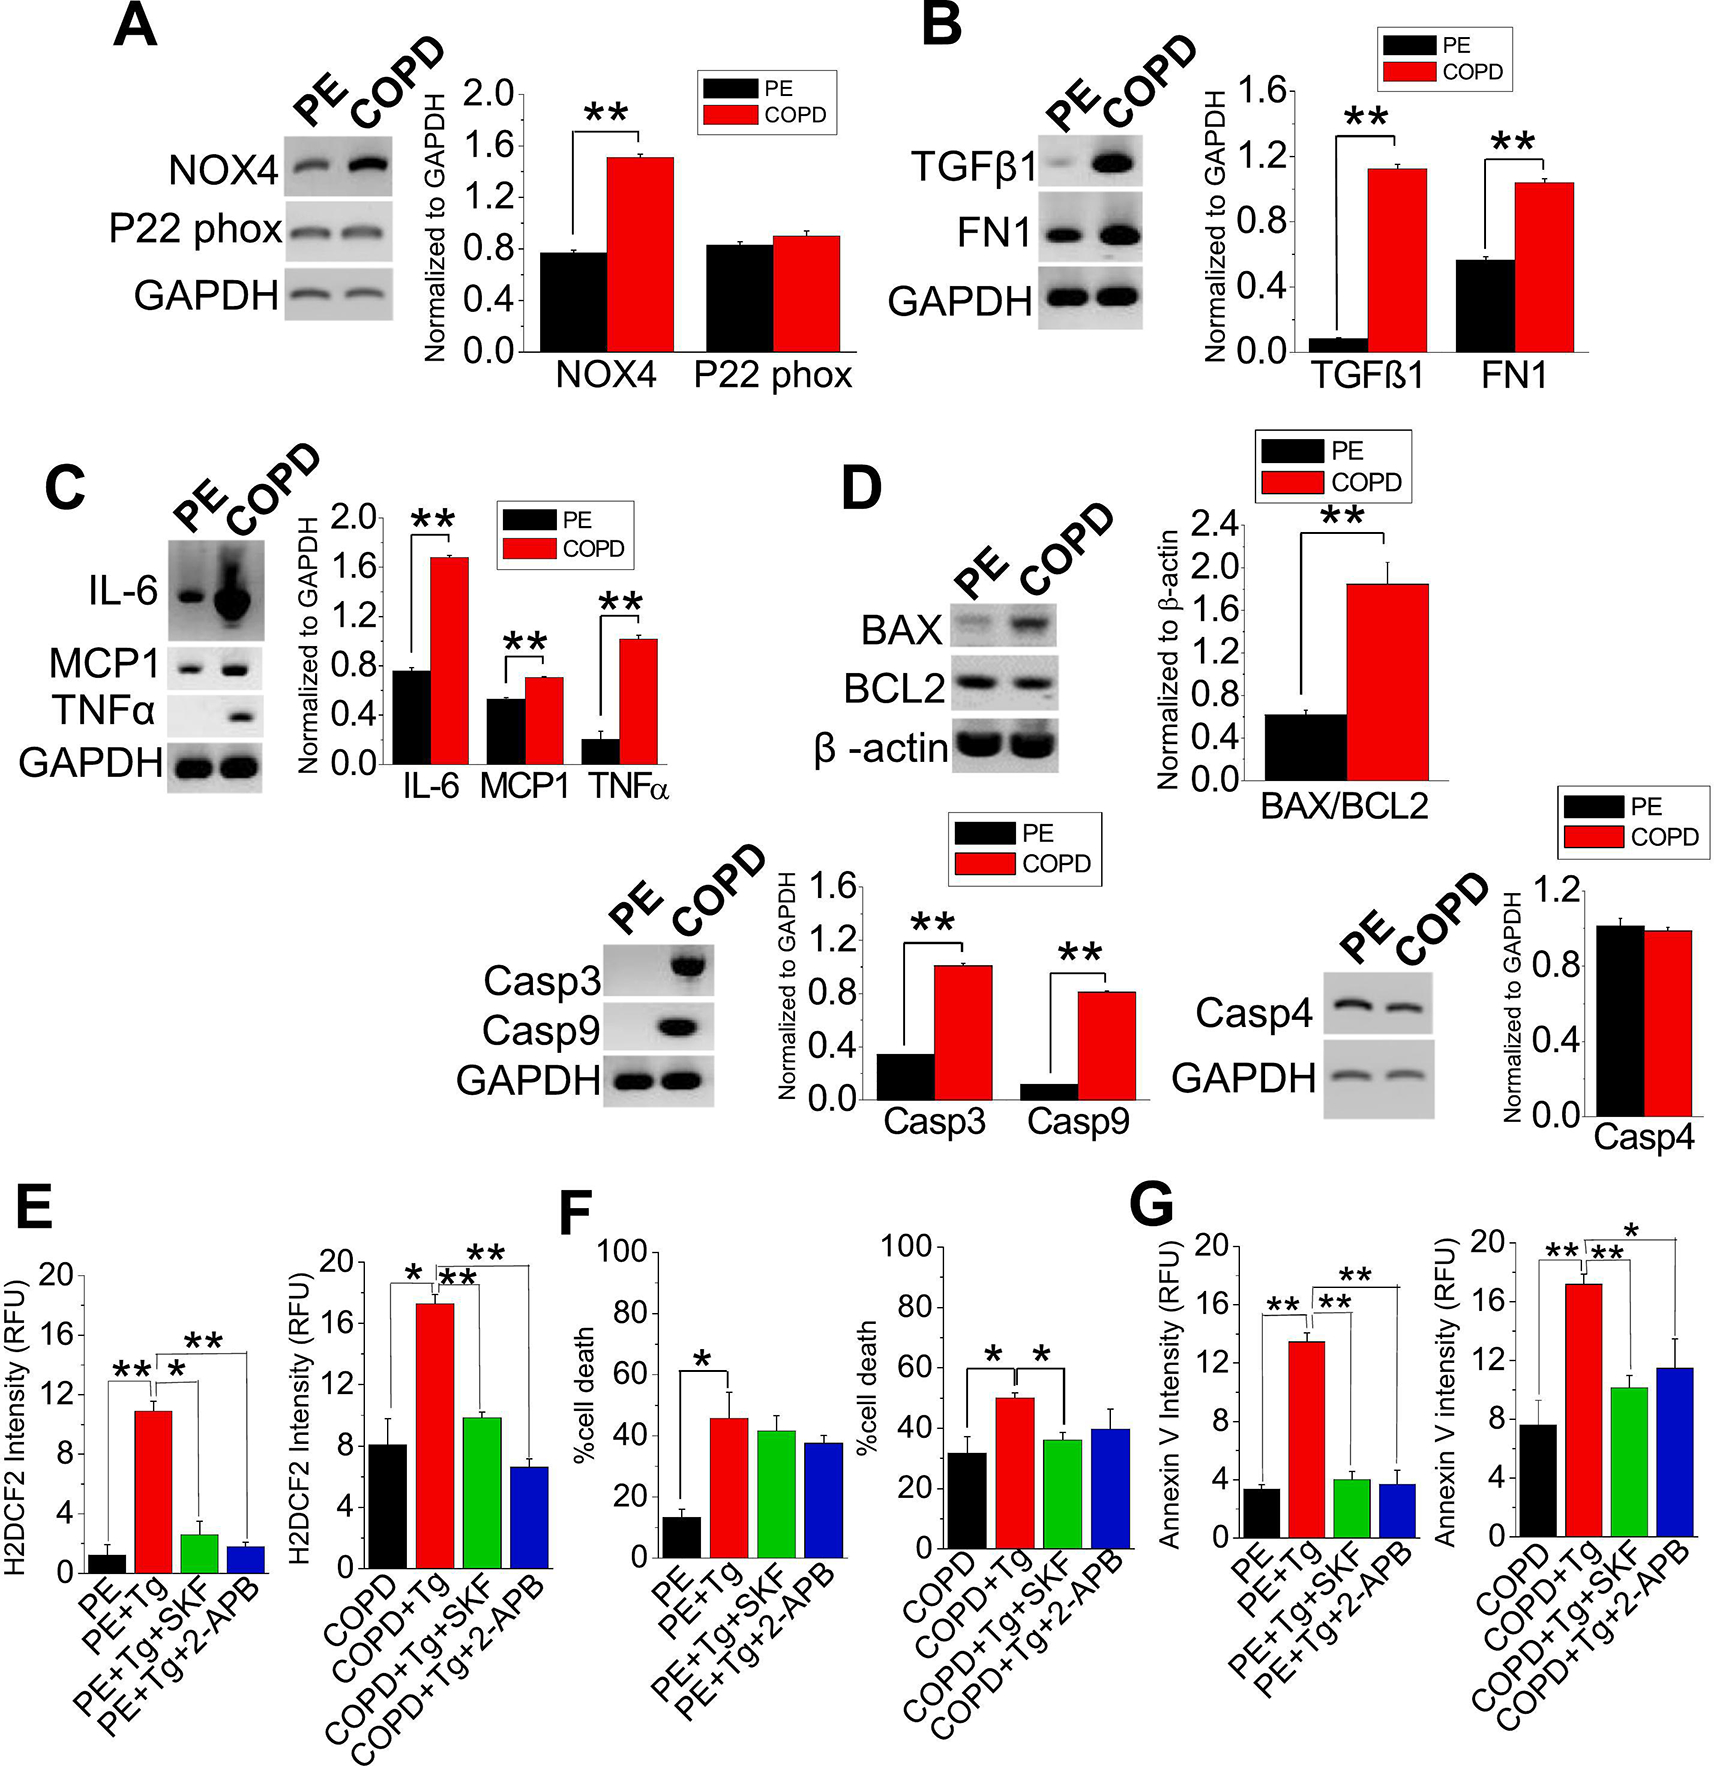
Comparative gene expression analysis of PE cells and COPD cells depicts (A) oxidative stress (P22 Phox and NOX4), (B) fibrosis (TGFβ1 and FN1), (C) inflammation (IL-6, MCP1, and TNFα) or (D) apoptosis [BAX, BCL-2, Caspase (Casp) 3, Casp9, and Casp4]. (E) H2DCF2, (F) DAPI, and (G) Annexin V stainings were performed on PE and COPD cells with no treatment, Tg (1 μM) only, Tg+SKF-96365 (SKF; 10 μM), or Tg+2-APB (12 μM). Fluorescence intensity and percentage cell death were quantitated into bar graphs. Experiments were performed n=3 times. Bar graphs are in means ± SEM. *, p < 0.05; **, p < 0.01. Student’s two-tailed t-test was performed to establish statistical significance between the two groups. All gene (mRNA) expressions are normalized to GAPDH or β-actin.
3.4. Characterization of Ca2+ influx in A549 cells for mechanistic study
Next, we used A549 cells as a PE cell line, to elucidate the mechanism of ROS induced Ca2+ signaling. First, we examined the expression of TRPC channel and SOCE components STIM and ORAI channel proteins in A549 cells and found expression profiles close to PE cells (Figure S1, S3). Therefore, we used both Tg (SOCE-inducer) and OAG (ROCE activator) to confirm the Ca2+ entry via TRPC1 and TRPC3. First, we used Tg to induce the store release of Ca2+, followed by Ca2+ entry, both of which were blocked by a selective TRPC1 inhibitor, Pico1,4,5 [42], and an SOCE inhibitor, Synta66 [43], suggesting that TRPC1 is involved in SOCE in A549 cells (Figure S4A–B). To confirm the involvement of TRPC3, we used OAG (activator of TRPC3), which elicited a Ca2+ entry response, that was blocked by both, and GSK2833503A (TRPC3 inhibitor) [44,45] and Pyr10 (ROCE inhibitor and TRPC3 blocker) [46] (Figure S4C–D). Replenishing the cell bath with 2.0 mM Ca2+ in these cells elicited a sharp Ca2+ rise followed by an entry phase (Figure 4A). To investigate the role of TRPC channels in SOCE, we treated cells with SKF-96365. Interestingly, TRPC channel inhibition resulted in 50% decrease in Ca2+ release (Figure 4A). To further examine the Ca2+ entry pathway, we treated A549 cells with 2-APB. Significantly, IP3-R and SOCE inhibition resulted in nearly complete blockade of Ca2+ release, confirming the ER Ca2+ release by the induction of Tg (Figure 4A). Next, we sought to delineate TRPC channel involvement in the Ca2+ entry pathway. Since TRPC1 and TRPC3 channel transcript and protein expressions were assessed in both normal and diseased epithelial cells, we further evaluated the Ca2+ signaling entry pathway of A549 cells to delineate the Ca2+ entry pathway. We treated cells with either Pyr6, a STIM1/ORAI1 inhibitor or Pyr10 [46]. While the Ca2+ release did not change between the control and treated groups, application of Pyr6 inhibited the Ca2+ entry by 50% (Figure 4B). These data suggest that TRPC3 may play a lesser role in SOCE in the Ca2+ entry pathway of A549 cells. These results have been corroborated using a selective Ca2+ ionophore, ionomycin [47], that is similar to Tg, which substantially elicited both Ca2+ release and entry (Figure S5A); however, ionomycin triggered a sustained [Ca2+]i rise due to global Ca2+ induction (Figure S5A). Such ionomycin-evoked Ca2+ response was markedly blocked by Pyr6 compared to Pyr10 (Figure S5B–E). To verify our findings distinguishing the involvement of STIM and ORAI receptors, and TRPC channels in the SOCE entry pathway, we assessed the current induced by CCh using a whole cell patch clamp, and with Pyr6 (Figure 4C) or Pyr10 (Figure 4D). Interestingly, our established basal current resembled an outwardly rectifying current typical of TRPC channels [35]. After establishing the basal current, 100 μM CCh was applied, and the amplitude was doubled upon activation. Application of Pyr10 blunted the current by ~80%, thereby reducing the amplitude towards baseline reading (Figure 4C), while application of Pyr6 inhibited the activated current to a much less extent by ~40 % (Figure 4E). Interestingly, inhibition by Pico1,4,5 significantly decreased the activated current, while Synta66 did not affect the CCh-induction of muscarinic receptor activated current (Figure S6A–B), which suggests that TRPC1 may also be involved in ROCE. Implementing GSK1702934A, a direct TRPC3 activator [44,45], has evoked the current, which was blocked by GSK2833503A (Figure S6C), thus confirming the role of TRPC3. These results corroborate with our Ca2+ imaging findings, suggesting that in SOCE, both TRPC1 and TRPC3 play crucial roles in mediating its response, while CCh-induced responses are mostly mediated by ROCE in A549 cells.
Figure 4. Differential Ca2+ response in A549 cells after exposure to CCh and Tg.

Fura-2 traces of ratiometric (340/380) [Ca2+]i measurements were retrieved from A549 cells in a Ca2+free cell bath. 0.5 μM Tg was applied to A549 cells with no inhibitor (Con), (A) 10 μM SKF-96365 (SKF) or 12 μM 2-APB, and (B) Pyr6 (3 μM) or Pyr10 (3 μM) inhibitors to delineate the Ca2+ entry after replenishing the cell bath with 2.0 mM Ca2+. Current densities of voltage ramps from −100 to +100 mV were collected from A549 cells and quantitated into I-V curves. After obtaining the basal current measurement, CCh (100 μM) was applied as the agonist, then (C) Pyr6 or (D) Pyr10 was applied as an inhibitor. Bar graphs in A-E show the average current densities at +100 mV after applying CCh and Pyr6 or Pyr10 in mean + SEM. Percentage Pyr6 or Pyr10 inhibitions of CCh-induced current were quantified into bar diagrams in mean + SEM. *, P < 0.05; **, P < 0.01. Experiments were performed n = 3 times. Student’s two-tailed t-test was performed to evaluate statistical significance between control and experimental groups.
3.5. Similar to PE cells, SOCE in A549 cells mediates through TRPC1 and TRPC3
Since TRPC1 and TRPC3 were likely play a crucial role in SOCE pathway, forming connections with ORAI1 and STIM1 in A549 cells, we sought to investigate the contributions of those TRPC channels in SOCE pathway (Figure S7A–F). We sequentially knocked down the expressions of TRPC1, TRPC3, TRPC1 + TRPC3, ORAI1, or STIM1 siRNA(s) in A549 cells (all siRNA knockdowns were confirmed by gene expression analysis; Figure S7G). Indeed, TRPC1, TRPC3, ORAI1 and STIM1 gene expressions were decreased but GAPDH expression was not as affected (Figure S7G). While the Ca2+ release was unchanged after the application of each siRNA(s) stated above (Figure S7A–F, H), the Ca2+ entry has decreased in each of the transfected cells, with the exception of ORAI1 (Figure S7A–F, I). In particular, the cells with TRPC1 + TRPC3 siRNAs have exhibited the most decline in Ca2+ entry, indicating that both TRPC1 and TRPC3 contribute to most of the [Ca2+]i increase in A549 cells. Since STIM1 and ORAI1 genes were found to be expressed in A549 cells (Figure S7), we also investigated the extent to which the knockdown of known SOCE pathway receptors STIM1 or ORAI1 may directly impede the flux of Ca2+ into the cell. We blocked SOCE and TRPC3 channel using Pyr6 and Pyr10 to delineate the Ca2+ entry pathway. Pyr6 application suppressed more Ca2+ release responses in TRPC1 and TRPC1 + TRPC3 siRNA transfected cells compared to the sham (Figure 5A, B), whereas Ca2+ entry was only reduced in cells with TRPC3 or STIM1 siRNA, though not to the extent with TRPC3 or TRPC1 + TRPC3 siRNA (Figure 5A, B), suggesting that STIM1 works in conjunction with TRPC1 and TRPC3 in mediating Tg-induced [Ca2+]i increase and subsequent [Ca2+]i entry response in A549 cells. Interestingly, Pyr10 application decreased the Ca2+ release of cells with TRPC1, TRPC1 + TRPC3, ORAI1, or STIM1 siRNA, except TRPC3 siRNA (Figure 5A, D). As expected, cells with TRPC1 and/or TRPC3, STIM1 siRNAs exhibited nearly complete inhibition of Ca2+ entry after Pyr10 application while ORAI1 siRNA treated cells experienced a slight decrease compared to the sham cells (Figure 5A, E), further corroborating with our results for cells treated with siRNA only (Figure S7A–F, I).
Figure 5. Silencing TRPC1 and TRPC3 in A549 cells diminishes the SOCE pathway.

Ratiometric (340/380) Fura-2 traces of [Ca2+]i measurements were retrieved from A549 cells in a Ca2+-free cell bath. 0.5 μM thapsigargin (Tg) were applied to A549 cells with (i) no siRNA, (ii) TRPC1 siRNA, (iii) TRPC3 siRNA, (iv) TRPC1+TRPC3 siRNAs, (v) ORAI siRNA, or (vi) STIM1 siRNA, then cell bath was replenished with 2.0 mM Ca2+. Inhibitors Pyr6 or Pyr10 were utilized in i-vi. Quantitated bar diagrams depicting Ca2+release or Ca2+ peak for experimental groups with (B-C) Pyr6 or (D-E) Pyr10 inhibitors are in mean + SEM. *, P < 0.05; ** P < 0.01. Experiments were performed n=3 times. Student’s two-tailed t-test was performed to evaluate the statistical significance between the sham (control) cells and those with siRNA (s).
3.6. COPD-like oxidative stress amplifies SOCE mediated by TRPC1 and TRPC3 function and expression in A549 cells
To examine the imbalance of oxidants to antioxidants in A549 cells that mimics the COPD condition, we induced oxidative stress using 1,3-bis-(2-chloroethyl)-1-nitrosourea (BCNU; 50 μM) in A549 cells [48]. Since we observed enhanced expression of TRPC1, TRPC3, STIM1 and ORAI1 in COPD-derived cells, we again analyzed the transcriptional expressions of these molecular players under BCNU-induced oxidative stress. Indeed, we found that expressions of TRPC1, TRPC3, STIM1 and ORAI1 were much enhanced by the treatment of BCNU (Figure 6A–B).
Figure 6. SOCE is enhanced in COPD-like conditions for A549 cells.

Gene expression profiles of control (Con) or treated (+BCNU) A549 cells for (A) TRPC1 and TRPC3, or (B) SOCE components STIM1 and ORAI1. Expression levels (mRNA) were normalized by GAPDH. Mean fluorescence traces of Fura-2-AM-loaded (C) untreated or (D) BCNU-treated A549 cells showing Tg (0.5 μM)-induced rise of [Ca2+]i in Ca2+-free bath solution and its inhibition by Pyr6 or 2-APB. Extracellular solution was then adjusted to 2.0 mM Ca2+. Bar diagrams in C and D represent Ca2+release or Ca2+ entry peaks. Quantitated bar diagrams for A-D are in mean ± SEM. *, P < 0.05; ** P < 0.01. Experiments performed n=3 times. Student’s two-tailed t-test was performed to evaluate statistical significance between control and treated groups.
Next, we induced oxidative stress in A549 cells using BCNU to determine the effect of enhanced ROS generation upon Ca2+ entry. SOCE induction by Tg showed a rapid release of Ca2+, that was not significantly different in both sets of cells (control and BCNU treated; Figure 6C–D). However, the addition of 2 mM [Ca2+]o induced a rapid increase in Ca2+ entry, which was significantly higher in ROS-induced cells (Figure 6C–D) suggesting that oxidative stress increases the Ca2+ influx via the SOCE. We also used blockade of SOCE components, to examine the ROS-induced Ca2+signaling in SOCE. Interestingly, Ca2+ release from the control A549 cells exhibited significant release through 2-APB, but not Pyr6 (Figure 6C–D). However, Pyr6 and 2-APB both inhibited the Ca2+ entry to a greater extent in BCNU treated cells compared to the control (Figure 6C–D). Here, we demonstrated the physiological confirmation of greater SOCE activity induced by oxidative stress through ROS-induced Ca2+ signaling.
3.7. COPD enhances oxidative stress, leading to upregulation of fibrotic, inflammatory, apoptotic genes in A549 cells
To establish the effects of oxidative stress in COPD, we induced ROS in A549 cells and examined the expressions of P22 Phox and NOX4 (source of ROS) (Figure 7A) and H2O2 release as a measure of oxidant (Figure 7B). ROS induction increased the expression of P22 Phox, NOX4 and overall H2O2 release in a concentration (0, 30, 50, 100 μM) and time (6 and 24 h) -dependent manner. Next, we assessed a broad range of markers: TGFβ1; FN, smooth muscle α (SMα) for airway remodeling/fibrosis (Figure 7C), and IL-6, MCP1, TNFα and NF-κβ (inflammatory markers) (Figure 7D). We observed the role of oxidative stress in all facets that we analyzed, which manifested as an increased capacity for epithelial cells to differentiate and an elevation in the expression of inflammatory and fibrotic markers. Next, we sought to distinguish the effect of induced oxidative stress (BCNU) and the addition of exogenous oxidants (H2O2) on the ER-mitochondria mediated downstream pathway. To this end, we treated cells with either BCNU (50 μM) or H2O2 (500 μM) for 1 h or 12 h. Following treatment, we evaluated BAX/BCL2 ratio as a measure of apoptosis, and we found that addition of H2O2 induced greater cell death than BCNU induced oxidative stress at lower exposure (1 h) and high exposure (12 h; Figure 7E). We also examined the expressions of Extracellular signal-related kinase (ERK) and p-ERK, part of the mitogen-activated protein kinase pathway. We determined that p-ERK/ERK ratio was enhanced following the addition of H2O2, compared to BCNU induction (Figure 7F). Significantly, our results suggest that the p-ERK/ERK ratio could be used as a marker for enhanced oxidative stress condition. Since our western blot data showed that apoptotic protein levels for BAX/BCL-2 have been elevated (Figure 7E), we also evaluated our findings by assessing expression levels for their correspondent apoptotic genes. Our results have shown that A549 cells, under oxidative stress, experienced elevated apoptotic gene expression levels compared to control (Figure 7G), which corroborated with our previous western blot findings (Figure 7E). We investigated the effect of BCNU on cell death by fluorescent DAPI staining and plasma membrane damage (LDH) and observed that BCNU-induced oxidative stress increased in cell death and damage in A549 cells that were incubated in 30, 50, or 100 μM concentrations (Figure 7H–I). Furthermore, to confirm the involvement of TRPC1/TRPC3-Ca2+ signaling in ROS mediated cell death and cytotoxicity we used TRPC1 (Pico1,4,5) and TRPC3 (GSK2833503A and Pyr10) specific inhibitors to examine BCNU-induced cell death. Our results show that percent cell death (DAPI staining) and cytotoxicity (LDH release) were alleviated by GSK2833503A, Pico1,4,5, and Pyr10, suggesting that TRPC1 and TRPC3 Ca2+ signaling may be involved in BCNU-induced oxidative stress (Figure S8A–C).
Figure 7. BCNU induces oxidative stress leading to upregulation of inflammation, fibrosis and apoptosis for A549 cells in COPD-like conditions.

Comparative analysis of A549 cells (Con) and treated A549 cell (+BCNU) showing oxidative stress through analyses gene expressions (mRNA) of (A) P22 Phox and NOX4, which was further corroborated by (B) 6 and 24 h H2O2 release measurements, showing progressive increase in H2O2 release with increasing BCNU concentration [control (0μM), 30μM, 50μM, 100μM]. A549 fibrosis was evident following BCNU treatment in gene expressions of (C) TGFβ1, FN and SMα and inflammatory gene expression markers, namely (D) IL-6, MCP1, TNFα and NF-κβ. BCNU treatment also induced apoptosis in A549 cells as shown in (E) protein expression analysis of BAX and BCL-2 following incubation of A549 cells with BCNU or H2O2 at 1 and 12 h and (F) ERK phosphorylation (p-ERK) (incubated with BCNU or H2O2 for 1 and 12 h). (G) Gene expression analysis of BAX, BCL-2, Caspase 3 and Caspase 9, (H) DAPI staining and (I) LDH release analysis, further corroborated evidence of BCNU-inducing apoptosis in A549 cells in increasing concentrations [Con (0μM), 30μM, 100μM, or Con (0μM), 30μM, 50μM, 100μM, respectively]. For all gene expression analyses, A549 cells were incubated with BCNU for 12 h. Bar graphs are in mean ± SEM. *, P < 0.05; **, P < 0.01. All gene and protein expressions are normalized to GAPDH and β-actin respectively. Experiments were performed n=3 times. Student’s two-tailed t-test was performed to evaluate statistical significance between control and BCNU-treated A549 cells (A-D, G), or control A549 cells with or without treatment (+BCNU or +H2O2; B, H). One way ANOVA and post-hoc Tukey’s test for further analysis was performed to compare and analyze A549 cells in different BCNU concentrations (E, F).
3.8. Knockdown of TRPC1 and/or TRPC3 protects against ROS-induced apoptosis in A549 cells
To determine the contribution of TRPC channels in oxidative stress induced by BCNU and/or H2O2, we knocked down TRPC1 expression in A549 cells by using specific TRPC1 siRNA (used in Figure S7G) and compared its effect to non-targeting siRNA as control. We then analyzed the expression of the apoptotic indicators (BAX/ BCL-2 and p-ERK/ ERK ratios), as our defined markers for enhanced oxidative stress condition. TRPC1 siRNA transfected cells showed a reduction in the BAX/BCL-2 ratio, in response to both BCNU- and H2O2-induced oxidative stress (Figure 8A). However, the basal expression levels of those genes were not elevated upon H2O2 or BCNU exposure (Figure 8A). Correspondingly, transient reduction in TRPC1 expression also resulted in a decrease in the p-ERK to ERK ratio, in response to BCNU and H2O2 addition (Figure 8A). Next, to analyze the contribution of TRPC channels to oxidative stress, we knocked down the expression of an additional TRPC channel, TRPC3, using a TRPC3-specific siRNA demonstrated in Figure S7G. We then induced the enhanced oxidative stress condition in TRPC1 and TRPC3 siRNAs transfected cells with either H2O2 (500 μM) or BCNU (50 μM) for 18 h and analyzed the resultant BAX/BCL2 gene expression ratio. We found that both TRPC1 and TRPC3 siRNAs treated cells had a suppressed BAX/BCL2 ratio in response to both H2O2 (Figure 8B) and BCNU (Figure 8C). Since the occurrence of functional dimeric and heteromeric TRPC channels in membranes has been reported [49], we then asked whether silencing of both the channels would lead to enhanced protection from H2O2 and BCNU-induced oxidative stress. To this end, we transfected cells with a combination of TRPC1 and TRPC3 specific siRNAs and then treated transfected cells with H2O2 (500 μM) or BCNU (50 μM). We observed the expected rise in BAX/BCL2 levels due to H2O2 treatment and, our results showed a decrease in BAX/BCL2 ratio in those TRPC1/C3 siRNAs transfected A549 cells with a similar treatment, suggesting that TRPC1 and TRPC3 could be involved in apoptotic regulation to reduced cell death (Figure 8D). We also analyzed BAX/BCL2 and p-ERK/ERK ratios following BCNU treatment and found that silencing both the TRPC1 and TRPC3 genes resulted in lower BAX/BCL2 and p-ERK/ERK ratios compared to the knockdown of TRPC3 alone (Figure 8E–G). Taken together, these results demonstrate that both TRPC1 and TRPC3 channels are regulator of oxidative stress and apoptotic response in A549 cells.
Figure 8. Knockdown of TRPC1 and 3 protects A549 cells from ROS mediated apoptosis.
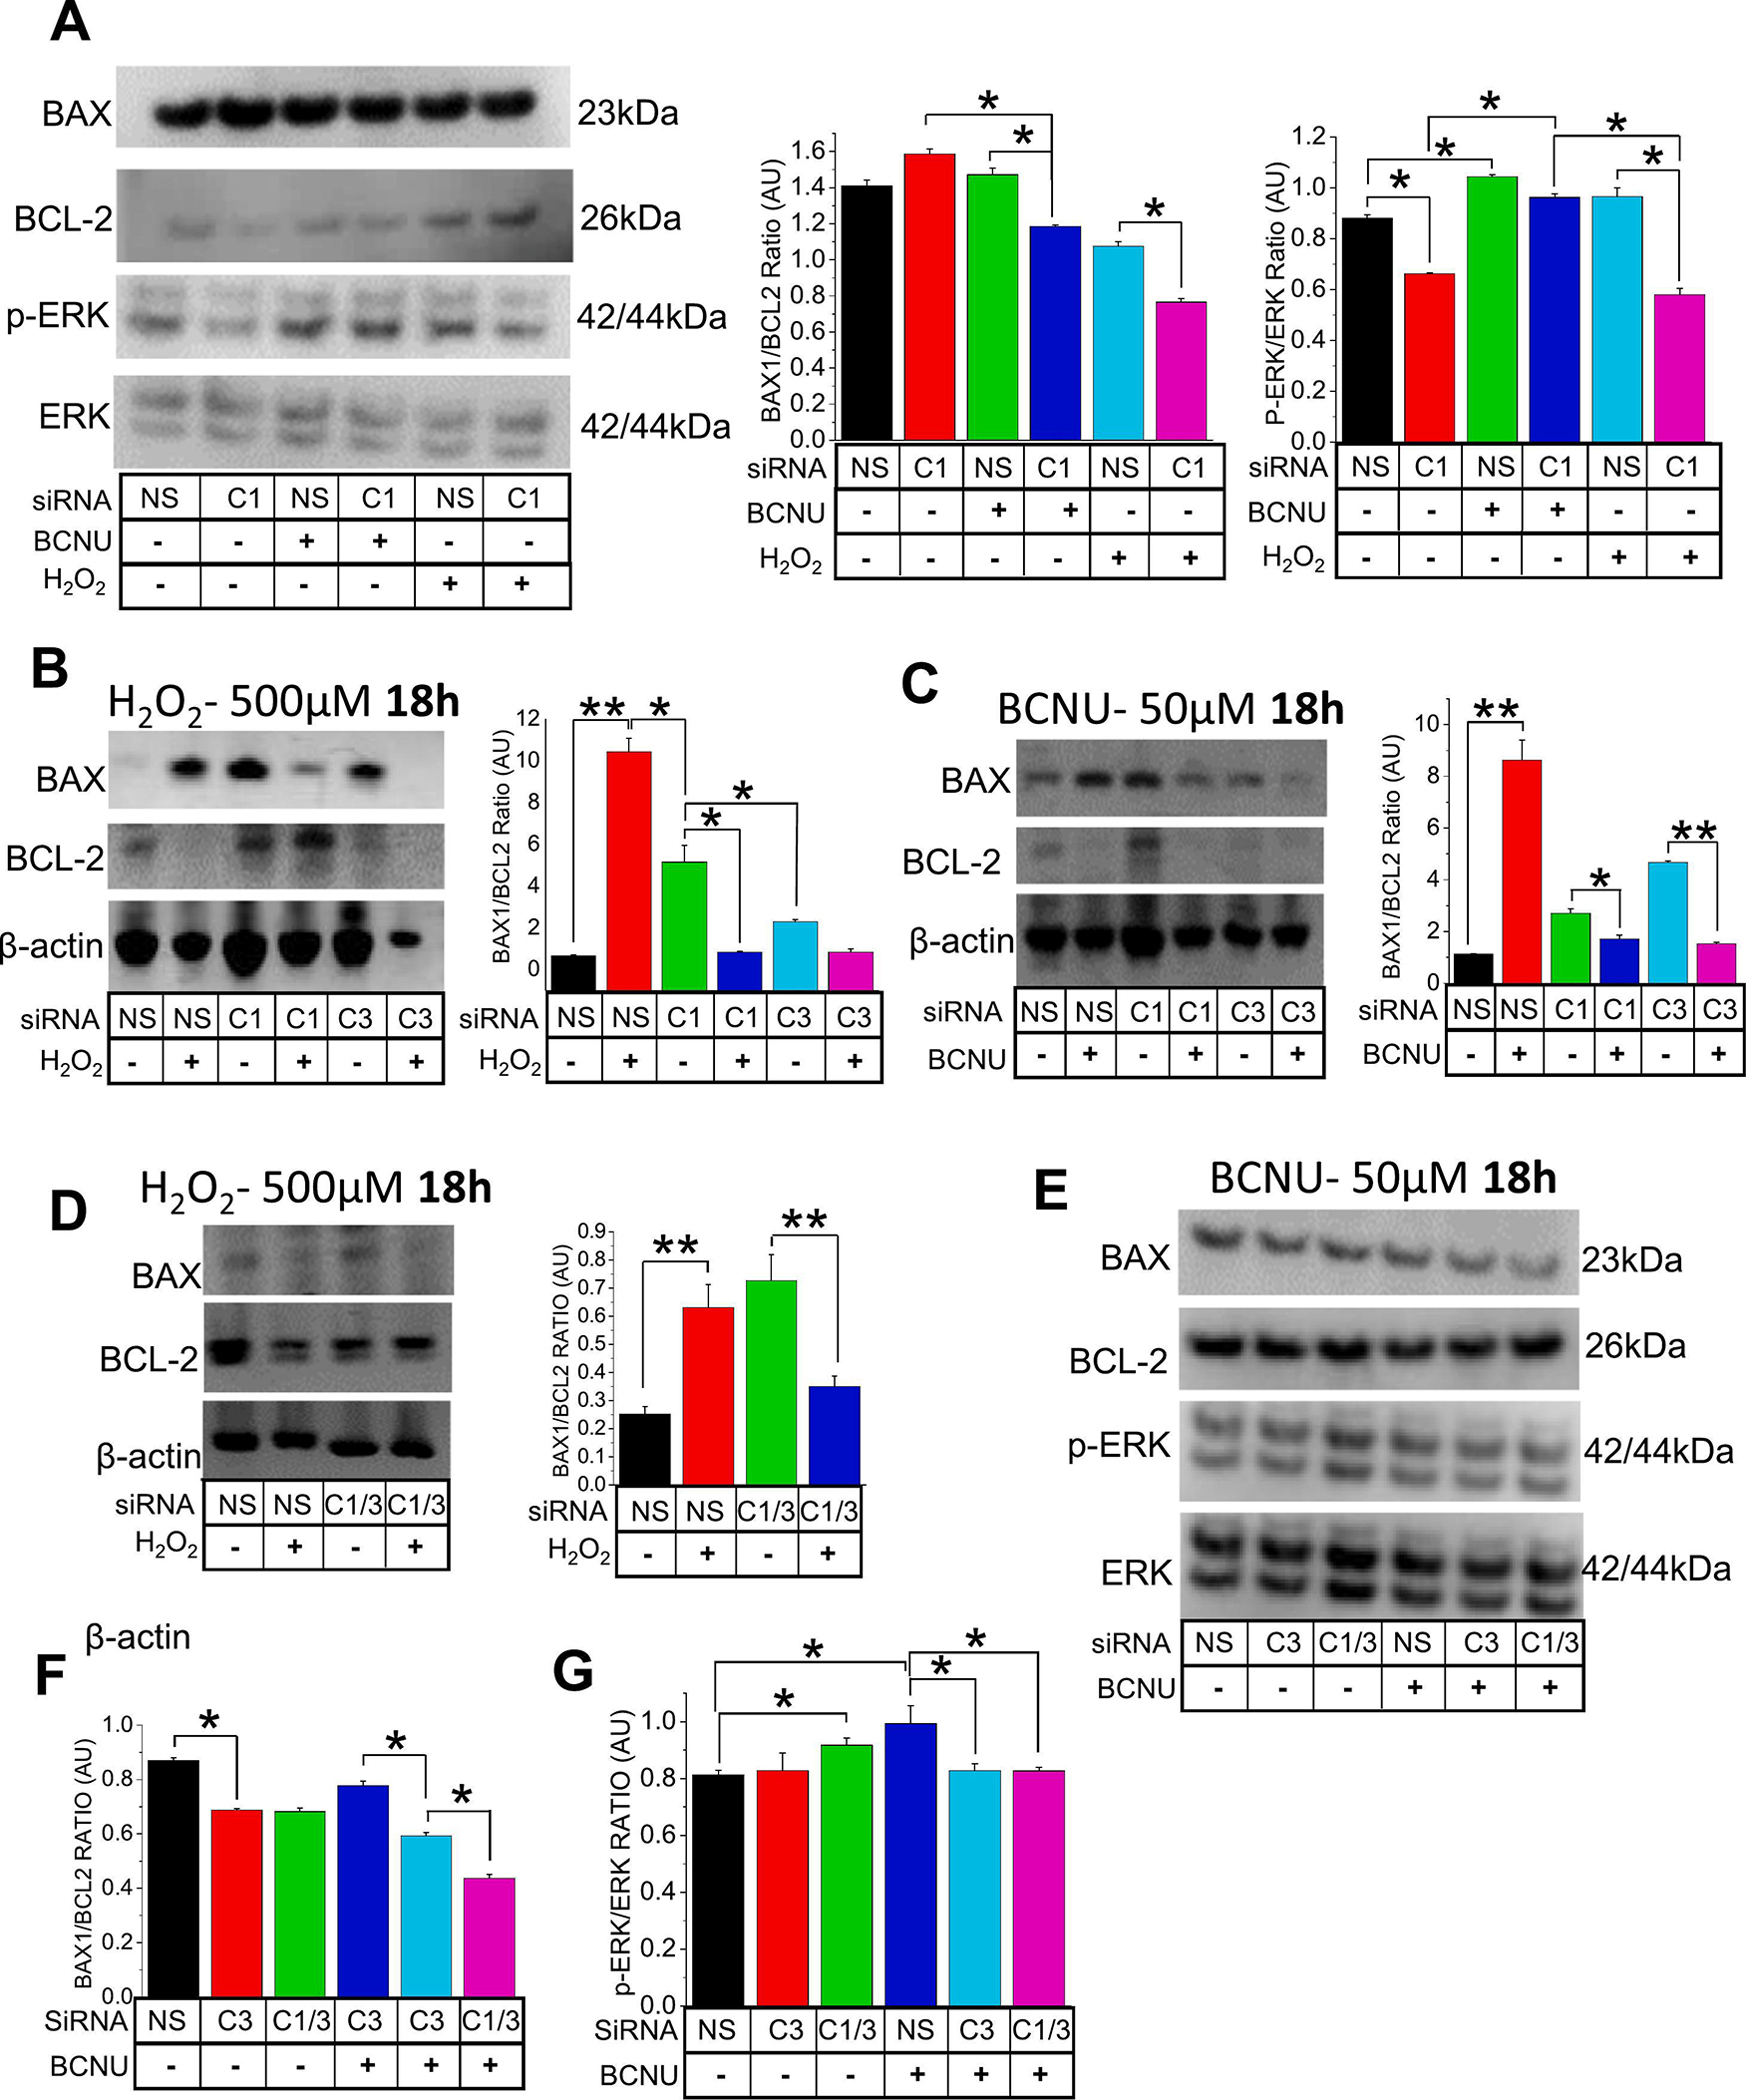
To analyze the contributions of TRPC1 (C1) and TRPC3 (C3) in Oxidative stress induced cell death, (A) effect of silencing TRPC1 (siRNA 10nM) in A549 cells were presented through western blot analysis, [protein expression through BAX/BCL-2 ratios and p-ERK/ERK (total) ratios] following BCNU (50μM) or H2O2 (500μM) treatments for 18 h. The siRNA (10nM) inhibition of C1 and/or C3 genes was analyzed through mRNA expressions of BAX and BCL-2 following (B) H2O2 (500μM) and (C) BCNU (50μM) incubations respectively for 18 h. (D) A double knockdown of C1 and C3 (siRNA; 10nM) was also performed and analyzed through gene expressions of BAX and BCL-2 following H2O2 (500μM) incubation for 18 h. (E) The silencing of C3 and the double knockdown of C1 and C3 were analyzed through protein expression analysis of (F) BAX/BCL-2 ratios and (G) p-ERK/ ERK ratios following BCNU (50μM) treatments. A non-targeting siRNA (NS; scramble; 10nM) was used as a control in all siRNA experiments. Bar graphs are in means ± SEM. *, P < 0.05; **, P < 0.01. All expressions were normalized to β-actin. Experiments were performed n=3 times. One way ANOVA and post-hoc Tukey’s test were performed to compare and analyze A549 cells in different BCNU concentrations and siRNA (s) conditions (A-G).
4. Discussion
Oxidative stress contributes to the pathogenesis of several pulmonary diseases, including COPD or asthma [50]. Among the factors that contribute towards the development of oxidative stress, are exogenous factors such as atmospheric pollution and tobacco smoke, and endogenous factors e. g. the mobilization of inflammatory cells (macrophages and polymorphonuclear neutrophils). Antioxidant capacity of lung epithelial cells is much reduced in the COPD condition compared to normal [51]. Regulation of [Ca2+]i is critical to the maintenance of normal cellular function. Previous studies have shown alterations in Ca2+ signaling in COPD cells involving dysregulation of ER Ca2+ release [52,53].
In the present study, we sought to elucidate the Ca2+ signaling mechanism and the downstream process of the disease condition compared to the normal PE cells. Our findings suggested that COPD cells utilize greater involvement of the TRPC1 channel in ER Ca2+ release induced SOCE pathway, confirming our hypothesis that [Ca2+]i is differentially regulated in COPD-PE cells compared to physiologically normal PE cells (Figure S6). We have also shown that increased intracellular ROS production in COPD cells and elevated SOCE activity through the activation of IP3R and the TRPC1/C3 channels. One explanation is that the increased intracellular production of ROS in the COPD cells may have perpetuated oxidative conditions and increased the affinity of IP3R for IP3 through the loss of ERp44 binding [54]. In addition, there is a possibility that the increased ROS can inhibit the Ca2+ pumps and opens up Ca2+ permeable channels, in the ER or the plasma membrane, allowing decrease in Ca2+ flow and the concentration gradient, resulting in an increase of the [Ca2+]i [55].
TRPC1/TRPC3 channel activities have been previously studied in freshly isolated smooth muscle cells, where the inhibition of the heteromeric channel was shown to contribute towards nitric oxide-mediated vasorelaxation [56]. We found increased expression and activity of TRPC1 and TRPC3 channels in COPD cells compared to PE cells. While TRPC1/C3 mediation in SOCE has been demonstrated in various tissues and cell lines [57–59], its expression and functionality have not been clearly elucidated in lung epithelial cells. Yuan et al. have demonstrated that the heteromultimerization of TRPC1 and TRPC3 and their function in SOCE is inextricably linked to STIM1 [59]. In our findings, the application of Pyr6, a STIM1/ORAI1 inhibitor, or Pyr10, a selective ROCE and TRPC3 inhibitor, effectively inhibited Ca2+ entry, suggesting that TRPC1 and TRPC3 are working in tandem for the SOCE pathway, along with STIM1. The findings in our whole-cell patch clamp experiment corroborated with our Ca2+ imaging results when the COPD cells exhibited greater current activation upon applying Tg, which in turn was blocked with Pyr3, 2-APB, and SKF-96365. In support, using a double knockdown of (TRPC1 + TRPC3) lung epithelial cells, we showed that Tg-induced [Ca2+]i rise and SOCE activation was nearly completely inhibited compared to that of the control, suggesting that TRPC1 and TRPC3 are involved in mediating the SOCE pathway. We have also found that Ca2+ release was inhibited when Pyr6 or Pyr10 was utilized after TRPC1 and TRPC3 were knocked down. Another study has reported that the usage of Pyr6 may inhibit Ca2+ release in OV90 cells, which we also found [60]. TRPC1 and TRPC3 channels function in concert with STIM/ORAI in SOCE, and TRPC1/C3 channel inhibition attenuates downstream effects of oxidative stress induced by COPD.
Most notably, our findings in healthy and COPD lung cells mirrored the results in A549 cells with or without induction of oxidative stress by BCNU or H2O2. ROS-induced A549 cells displayed greater SOCE upon Tg induction, along with a greater inhibition by Pyr6 or 2-APB, while A549 cells with TRPC1 and/or TRPC3 siRNA(s) displayed greater resilience to post-H2O2 or BCNU treatment compared to its non-treated counterparts as evidenced by BAX to BCL2 and p-ERK to ERK expression ratios. We propose that the TRPC1 and/or TRPC3 contribute in a significant manner towards [Ca2+]i regulation, and TRPC1 blockade may be plausible as a therapeutic intervention in treating COPD. It should be noted that unlike in clinical COPD conditions, the COPD-like condition induced in A549 cells was only inflicted short-term for 18 h prior to experiments [61]. Likewise, additional localization-studies for the TRPC1 and TRPC3 may be needed for further confirmation. More importantly, we have been able to show a direct link between TRPC1/C3 mediated Ca2+ signaling and ROS mediated cell death and cytotoxicity. Overall, our results for the first time show molecular candidates that govern ROS mediated clinical condition of COPD and the Ca2+ signaling mechanism leading to COPD-like condition, where TRPC1/C3 mediated SOCE is the major pathway. ROS-mediated COPD condition develops due to long-term exposure to irritants such as cigarette smoking [62], which may be occasionally exacerbated by hypoxia. In such cases treatment options are limited, and the side effects can be overwhelming. Additionally, the symptoms of COVID-19 infection and a flare-up of COPD can overlap in many ways, while those afflicted with COPD are more prone to poor clinical outcomes from COVID-19 infections [63]. Our findings on the molecular pathophysiology involving Ca2+ signaling regulation will pave the way in finding a new targeted treatment strategy.
The PE cells we used here are from normal individuals, which have been extensively characterized [64–65] and used for biomarker and mechanistic studies [66–67], including air-liquid interface systems and other cellular models [68]. The PE and COPD epithelial cells were utilized as primary cells in these experiments to obtain the first-track information about COPD condition, which has been extrapolated for revealing the mechanism in A549 cells imposing a COPD-like condition. Specifically, we focused on the inflammatory, apoptotic and fibrotic upregulation elicited by decreased antioxidant ability, as opposed to other phenotypes for this condition, such as the propensity of COPD airway cells for de-differentiation towards mesenchymal cells [69]. Nevertheless, we have shown that TGF-β1, which has a crucial role for epithelial to mesenchymal transition [69], was elevated in COPD-PE cells and COPD-like A549 cells. Finally, this study will be the basis for reversing the lung remodeling capacities that were compromised due to COPD, using TRPC1 and TRPC3 channels as potential candidates and SOCE as a possible mechanism.
Supplementary Material
Figure S1. Gene expression profile of pulmonary epithelial (PE) or COPD cells for (A) TRP channels (TRPC), or store-operated Ca2+ entry components (B) STIM and ORAI channels.
Figure S2. Images (as background data for Figure 3) were obtained from (A) H2DCF2, (B) DAPI, and (C) Annexin V stained pulmonary epithelial (PE) or COPD cells with no treatment, Thapsigargin (Tg; 1 μM) only, Tg+SKF-96365 (SKF; 10 μM), or Tg+2-APB (12 μM).
Figure S3. Transient receptor potential canonical (TRPC) channels (TRPC1, TRPC3, TRPC4. TRPC5, TRPC6 and TRPC7), and store-operated Ca2+ entry components [stromal interaction molecule 1(STIM1) and STIM2 and ORAI channels (ORAI 1–3)] gene expression profile in A549 cells. Relative expression levels were normalized to GAPDH.
Figure S4. Characterization of [Ca2+]i entry in A549 cells using pharmacological inhibitors of TRPC1 and TRPC3. Ratiometric (340/380) Fura-2 traces of [Ca2+]i were measured in A549 cells in 1.2 mM Ca2+ or Ca2+-free cell bath. (A, B) In Ca2+-free cell bath, thapsigargin (Tg) was implemented after treatment with Pico1,4,5 (1 μM) or Synta66 (1 μM). (C, D) In 1.2 mM Ca2+, 100 μM OAG was applied to A549 cells with no inhibitors, Pyr10, or GSK2833503A (GSK2; 1 μM) and then the cell bath was replenished with 2.0 mM Ca2+.
Figure S5. Ionomycin-induced [Ca2+]i entry elicits SOCE in A549 cells. Ratiometric (340/380) Fura-2 traces of [Ca2+]i measurements were retrieved from A549 cells in Ca2+-free cell bath. 0.5 μM ionomycin were applied to A549 cells with (A) no inhibitors, (B) Pyr6, or (C) Pyr10, and then the cell bath was replenished with 2.0 mM Ca2+. Quantitated bar diagrams depicting (D) Ca2+ release or (E) Ca2+ entry for experimental groups with Pyr6 or Pyr10 inhibitors are in mean + SEM. *, p < 0.05; ** p < 0.01. Student’s two-tailed t-test with one-way ANOVA and Tukey’s test was performed to evaluate statistical significance.
Figure S6. Electrophysiological characterization of A549 cells. (A-C) Current densities of voltage ramps from −100 to +100 mV were recorded from A549 cells and quantitated into I-V curves. After receiving baseline measurements from the cells, (A, B) CCh (carbachol; 100 μM) or (C) GSK1702934A (GSK1; 1 μM) was applied as an agonist, and then (A) Pico1,4,5 (1 μM), (B) Synta66 (1 μM), or (C) GSK2833503A (GSK2; 1 μM) was applied as an inhibitor to the induced current. Bar graphs in A-C show average current densities at +100 mV in mean + SEM. (A-C) Time-lapse recordings of current densities at +100 and −100 mV were plotted for each experiment.
Figure S7. TRPC1 and TRPC3 knockdown in A549 cells decreases Ca2+ entry. Ratiometric (340/380) Fura-2 traces of [Ca2+]i measurements were retrieved from A549 cells in Ca2+-free cell bath. Addition of 0.5 μM thapsigargin (Tg) to A549 cells with siRNAs: (A) Scramble, (B) TRPC1, (C) TRPC3, (D) TRPC1+TRPC3, (E) ORAI1 and (F) STIM1, then the cell baths were replenished with 2.0 mM Ca2+. Experiments performed n=3 times with ~ 40 – 50 cells. (G) TRPC1, TRPC3, ORAI1, and STIM1 gene expression comparison of control (scramble) and siRNA transfected A549 cells. GAPDH was used as internal control. Quantitated bar diagrams depicting (H) Ca2+ release or (I) Ca2+ peak is in mean + SEM.
Figure S8. TRPC1 or TRPC3 inhibition in A549 cells prevents BCNU-induced cell death. (A) Microscopy images were obtained from DAPI stained A549 cells after no treatment (Control), BCNU (+BCNU), BCNU and Pico1,4,5 (+BCNU+Pico1,4,5), BCNU GSK2833503A (+BCNU+GSK2), or BCNU and Pyr10 (+BCNU+Pyr10) treatments. (B) Percentage cell death of untreated and untreated A549 cells was analyzed using ImageJ. (C) Serum-free media form the same treated cells were collected for LDH release analysis. (B, C) Quantitated bar diagrams are in mean + SEM. *, p < 0.05. Scale bars = 50 μm.
Highlights.
TRPC1/3 mediates store operated Ca2+ entry (SOCE) in COPD pulmonary epithelial (PE) cells.
COPD evokes oxidative stress induced detrimental pathway activation in PE cells.
Induction of oxidative stress in A549 cells resulting SOCE-induced COPD-like conditions.
TRPC1/3 ablation lowered Ca2+ entry and reversed apoptotic expression and p-ERK activation.
Acknowledgments:
We would like to thank Calcium Signaling Lab members Sade Evans and Yianni L. Kanaras for helping in some experiments and Aneil Srivastava, Nhu Le and Madison Ezell for data analysis. We acknowledge Institute for Clinical Research, Inc. for administrative support and Washington DC VA Medical Center for facility support.
Funding:
This study is supported by a grant to BCB from Georgetown-Howard Universities Center for Clinical and Translational Science (GHUCCTS). We also acknowledge the funding support from National Institute of Diabetes and Digestive and Kidney Diseases (DK102043) to BCB and EAB. There was no involvement of this funding in the preparation of this manuscript, design, collection, analyses, and interpretation of the data, writing of the report, and/or decision to submit this article for publication. We also acknowledge the funding support from DC VA Medical Center and Institute for Clinical Research, Inc. towards this study.
Footnotes
Conflicts of Interest: The authors declares that there are no financial and non-financial conflict of interests.
Declaration of interests
The authors declare that they have no known competing financial interests or personal relationships that could have appeared to influence the work reported in this paper.
Ethical Approval: All human cells and cell line used in this study were obtained from a commercial source (de-identified samples, not individually identifiable to any person). This study (#01700; PI Bandyopadhyay) received IRB exemption and was approved by the Research and Development committee of the Washington DC VA Medical Center on August 11th, 2014.
Informed Consent Statement: Not applicable.
CRediT Author Statement
Author Contributions: Conception and design, acquisition, and analysis (e.g., statistical analysis) of experimental data: SS, FCG, EAB, AJY, SKY, and BCB; Interpretation of data: SS, FCG, EAB, AJY, SKY, and BCB; Writing the manuscript draft, review, and revision of the manuscript: SS, FCG, EAB, AJY, and BCB. Funding acquisition: BCB. All authors have read and agreed to the final version of the manuscript.
Publisher's Disclaimer: This is a PDF file of an unedited manuscript that has been accepted for publication. As a service to our customers we are providing this early version of the manuscript. The manuscript will undergo copyediting, typesetting, and review of the resulting proof before it is published in its final form. Please note that during the production process errors may be discovered which could affect the content, and all legal disclaimers that apply to the journal pertain.
Data Availability Statement:
The data that support the findings of this study are available from the corresponding author upon reasonable request. Any experimental data or additional information necessary to reanalyze the data reported in this study are available from the Lead contact. This study does not report any original code.
References:
- 1.Pagano G, Manini P, Bagchi D, Oxidative stress-related mechanisms are associated with xenobiotics exerting excess toxicity to Fanconi anemia cells, Environ. Health Perspect. 2003; 111: 1699–1703. 10.1289/ehp.6229. [DOI] [PMC free article] [PubMed] [Google Scholar]
- 2.Brown DM, Donaldson K, Borm PJ, Schins RP, Dehnhardt M, Gilmour P, Jimenez LA, Stone V, Calcium and ROS-mediated activation of transcription factors and TNF-alpha cytokine gene expression in macrophages exposed to ultrafine particles, Am. J. Physiol. Lung Cell. Mol. Physiol. 2004; 286: L344–353. 10.1152/ajplung.00139.2003. [DOI] [PubMed] [Google Scholar]
- 3.Cowley EA, Linsdell P, Characterization of basolateral K+ channels underlying anion secretion in the human airway cell line Calu-3, J. Physiol. 2002; 538: 747–757. 10.1113/jphysiol.2001.013300. [DOI] [PMC free article] [PubMed] [Google Scholar]
- 4.Cha M-J, Jang J-K, Ham O, Song B-W, Lee S-Y, Lee CY, Park J-H, Lee J, Seo H-H, Choi E, Jeon W, Hwang HJ, Shin H-T, Choi E, Hwang K-C, MicroRNA-145 suppresses ROS-induced Ca2+ overload of cardiomyocytes by targeting CaMKIIδ, Biochem. Biophys. Res. Commun. 2013; 435: 720–726. 10.1016/j.bbrc.2013.05.050. [DOI] [PubMed] [Google Scholar]
- 5.Umemoto S, Tanaka M, Kawahara S, Kubo M, Umeji K, Hashimoto R, Matsuzaki M, Calcium antagonist reduces oxidative stress by upregulating Cu/Zn superoxide dismutase in stroke-prone spontaneously hypertensive rats, Hypertens. Res. Off. J. Jpn. Soc. Hypertens. 2004; 27: 877–885. 10.1291/hypres.27.877. [DOI] [PubMed] [Google Scholar]
- 6.Suresh K, Servinsky L, Reyes J, Baksh S, Undem C, Caterina M, Pearse DB, Shimoda LA, Hydrogen peroxide-induced calcium influx in lung microvascular endothelial cells involves TRPV4, Am. J. Physiol. Lung Cell. Mol. Physiol. 2015; 309: L1467–1477. 10.1152/ajplung.00275.2015. [DOI] [PMC free article] [PubMed] [Google Scholar]
- 7.Ay B, Iyanoye A, Sieck GC, Prakash YS, Pabelick CM, Cyclic nucleotide regulation of store-operated Ca2+ influx in airway smooth muscle, Am. J. Physiol. Lung Cell. Mol. Physiol. 2006; 290: L278–283. 10.1152/ajplung.00188.2005. [DOI] [PubMed] [Google Scholar]
- 8.Corteling RL, Li S, Giddings J, Westwick J, Poll C, Hall IP, Expression of transient receptor potential C6 and related transient receptor potential family members in human airway smooth muscle and lung tissue, Am. J. Respir. Cell Mol. Biol. 2004; 30: 145–154. 10.1165/rcmb.2003-0134OC. [DOI] [PubMed] [Google Scholar]
- 9.Yu Y, Fantozzi I, Remillard CV, Landsberg JW, Kunichika N, Platoshyn O, Tigno DD, Thistlethwaite PA, Rubin LJ, Yuan JX-J, Enhanced expression of transient receptor potential channels in idiopathic pulmonary arterial hypertension, Proc. Natl. Acad. Sci. U. S. A. 2004; 101: 13861–13866. 10.1073/pnas.0405908101. [DOI] [PMC free article] [PubMed] [Google Scholar]
- 10.Berridge MJ, Lipp P, Bootman MD, The versatility and universality of calcium signalling, Nat. Rev. Mol. Cell Biol. 2000; 1: 11–21. 10.1038/35036035. [DOI] [PubMed] [Google Scholar]
- 11.Berridge MJ, Inositol trisphosphate and calcium signalling, Nature. 1993; 361: 315–325. 10.1038/361315a0. [DOI] [PubMed] [Google Scholar]
- 12.Clapham DE, Runnels LW, Strübing C, The TRP ion channel family, Nat. Rev. Neurosci. 2001; 2: 387–396. 10.1038/35077544. [DOI] [PubMed] [Google Scholar]
- 13.Minke B, Cook B, TRP channel proteins and signal transduction, Physiol. Rev. 2002; 82: 429–472. 10.1152/physrev.00001.2002. [DOI] [PubMed] [Google Scholar]
- 14.Bandyopadhyay BC, Swaim WD, Liu X, Redman RS, Patterson RL, Ambudkar IS, Apical Localization of a Functional TRPC3/TRPC6-Ca2+-Signaling Complex in Polarized Epithelial Cells ROLE IN APICAL Ca2+ INFLUX, J. Biol. Chem. 2005; 280: 12908–12916. 10.1074/jbc.M410013200. [DOI] [PubMed] [Google Scholar]
- 15.Bandyopadhyay BC, Swaim WD, Sarkar A, Liu X, Ambudkar IS, Extracellular Ca(2+) sensing in salivary ductal cells, J. Biol. Chem. 2012; 287: 30305–30316. 10.1074/jbc.M112.394122. [DOI] [PMC free article] [PubMed] [Google Scholar]
- 16.Bandyopadhyay BC, Ong HL, Lockwich TP, Liu X, Paria BC, Singh BB, Ambudkar IS, TRPC3 controls agonist-stimulated intracellular Ca2+ release by mediating the interaction between inositol 1,4,5-trisphosphate receptor and RACK1, J. Biol. Chem. 2008; 283: 32821–32830. 10.1074/jbc.M805382200. [DOI] [PMC free article] [PubMed] [Google Scholar]
- 17.Singh BB, Lockwich TP, Bandyopadhyay BC, Liu X, Bollimuntha S, Brazer S-C, Combs C, Das S, Leenders AGM, Sheng Z-H, Knepper MA, Ambudkar SV, Ambudkar IS, VAMP2-dependent exocytosis regulates plasma membrane insertion of TRPC3 channels and contributes to agonist-stimulated Ca2+ influx, Mol. Cell. 2004; 15: 635–646. 10.1016/j.molcel.2004.07.010. [DOI] [PubMed] [Google Scholar]
- 18.Kiselyov K, Xu X, Mozhayeva G, Kuo T, Pessah I, Mignery G, Zhu X, Birnbaumer L, Muallem S, Functional interaction between InsP3 receptors and store-operated Htrp3 channels, Nature. 1998; 396: 478–482. 10.1038/24890. [DOI] [PubMed] [Google Scholar]
- 19.Ma HT, Patterson RL, van Rossum DB, Birnbaumer L, Mikoshiba K, Gill DL, Requirement of the inositol trisphosphate receptor for activation of store-operated Ca2+ channels, Science. 2000; 287: 1647–1651. 10.1126/science.287.5458.1647. [DOI] [PubMed] [Google Scholar]
- 20.Vazquez G, Wedel BJ, Bird GSJ, Joseph SK, Putney JW, An inositol 1,4,5-trisphosphate receptor-dependent cation entry pathway in DT40 B lymphocytes, EMBO J. 2002; 21: 4531–4538. 10.1093/emboj/cdf467 [DOI] [PMC free article] [PubMed] [Google Scholar]
- 21.Liu X, Bandyopadhyay BC, Singh BB, Groschner K, Ambudkar IS, Molecular analysis of a store-operated and 2-acetyl-sn-glycerol-sensitive non-selective cation channel. Heteromeric assembly of TRPC1-TRPC3, J. Biol. Chem. 2005; 280: 21600–21606. 10.1074/jbc.C400492200 [DOI] [PubMed] [Google Scholar]
- 22.Ambudkar IS, Ong HL, Liu X, Bandyopadhyay BC, Bandyopadhyay B, Cheng KT, TRPC1: the link between functionally distinct store-operated calcium channels, Cell Calcium. 2007; 42: 213–223. 10.1016/j.ceca.2007.01.013. [DOI] [PubMed] [Google Scholar]
- 23.Shin S, Ibeh CL, Awuah Boadi E, Choi BE, Roy SK, & Bandyopadhyay BC (2021). Hypercalciuria switches Ca2+ signaling in proximal tubular cells, induces oxidative damage to promote calcium nephrolithiasis. Genes & diseases, 9(2), 531–548. 10.1016/j.gendis.2021.04.006 [DOI] [PMC free article] [PubMed] [Google Scholar]
- 24.Miller BA, Zhang W, TRP channels as mediators of oxidative stress, Adv. Exp. Med. Biol. 2011; 704: 531–544. 10.1007/978-94-007-0265-3_29. [DOI] [PubMed] [Google Scholar]
- 25.Yiu AJ, Ibeh C-L, Roy SK, Bandyopadhyay BC, Melamine induces Ca2+-sensing receptor activation and elicits apoptosis in proximal tubular cells, Am. J. Physiol. Cell Physiol. 2017; 313: C27–C41. 10.1152/ajpcell.00225.2016. [DOI] [PMC free article] [PubMed] [Google Scholar]
- 26.Gombedza FC, Shin S, Kanaras YL, Bandyopadhyay BC, Abrogation of store-operated Ca2+ entry protects against crystal-induced ER stress in human proximal tubular cells, Cell Death Discov. 2019; 5: 124. 10.1038/s41420-019-0203-5. [DOI] [PMC free article] [PubMed] [Google Scholar]
- 27.Mao P, Li J, Huang Y, Wu S, Pang X, He W, Liu X, Slutsky AS, Zhang H, Li Y, MicroRNA-19b Mediates Lung Epithelial-Mesenchymal Transition via Phosphatidylinositol-3,4,5-Trisphosphate 3-Phosphatase in Response to Mechanical Stretch, Am. J. Respir. Cell Mol. Biol. 2017; 56: 11–19. 10.1165/rcmb.2015-0377OC. [DOI] [PubMed] [Google Scholar]
- 28.Barr JJ, Auro R, Furlan M, Whiteson KL, Erb ML, Pogliano J, Stotland A, Wolkowicz R, Cutting AS, Doran KS, Salamon P, Youle M, Rohwer F, Bacteriophage adhering to mucus provide a non-host-derived immunity, Proc. Natl. Acad. Sci. U. S. A. 2013; 110: 10771–10776. 10.1073/pnas.1305923110. [DOI] [PMC free article] [PubMed] [Google Scholar]
- 29.Ibeh C-L, Yiu AJ, Kanaras YL, Paal E, Birnbaumer L, Jose PA, Bandyopadhyay BC, Evidence for a regulated Ca2+ entry in proximal tubular cells and its implication in calcium stone formation, J. Cell Sci. 2019; 132: jcs225268. 10.1242/jcs.225268. [DOI] [PMC free article] [PubMed] [Google Scholar]
- 30.Satoh T, Numakawa T, Abiru Y, Yamagata T, Ishikawa Y, Enokido Y, Hatanaka H, Production of reactive oxygen species and release of L-glutamate during superoxide anion-induced cell death of cerebellar granule neurons, J. Neurochem. 1998; 70: 316–324. 10.1046/j.1471-4159.1998.70010316.x [DOI] [PubMed] [Google Scholar]
- 31.Shino Y, Itoh Y, Kubota T, Yano T, Sendo T, Oishi R, Role of poly(ADP-ribose)polymerase in cisplatin-induced injury in LLC-PK1 cells, Free Radic. Biol. Med. 2003; 35: 966–977. 10.1016/s0891-5849(03)00470-2. [DOI] [PubMed] [Google Scholar]
- 32.Bird GS, DeHaven WI, Smyth JT, Putney JW, Methods for studying store-operated calcium entry, Methods San Diego Calif. 2008; 46: 204–212. 10.1016/j.ymeth.2008.09.009. [DOI] [PMC free article] [PubMed] [Google Scholar]
- 33.Merritt JE, Armstrong WP, Benham CD, Hallam TJ, Jacob R, Jaxa-Chamiec A, Leigh BK, McCarthy SA, Moores KE, Rink TJ, SK&F 96365, a novel inhibitor of receptor-mediated calcium entry, Biochem. J. 1990; 271: 515–522. 10.1042/bj2710515 [DOI] [PMC free article] [PubMed] [Google Scholar]
- 34.Maruyama T, Kanaji T, Nakade S, Kanno T, Mikoshiba K, 2APB, 2-aminoethoxydiphenyl borate, a membrane-penetrable modulator of Ins(1,4,5)P3-induced Ca2+ release, J. Biochem. (Tokyo) 1997; 122: 498–505. 10.1093/oxfordjournals.jbchem.a021780. [DOI] [PubMed] [Google Scholar]
- 35.Kiyonaka S, Kato K, Nishida M, Mio K, Numaga T, Sawaguchi Y, Yoshida T, Wakamori M, Mori E, Numata T, Ishii M, Takemoto H, Ojida A, Watanabe K, Uemura A, Kurose H, Morii T, Kobayashi T, Sato Y, Sato C, Hamachi I, Mori Y, Selective and direct inhibition of TRPC3 channels underlies biological activities of a pyrazole compound, Proc. Natl. Acad. Sci. U. S. A. 2009; 106: 5400–5405. 10.1073/pnas.0808793106. [DOI] [PMC free article] [PubMed] [Google Scholar]
- 36.Venkatachalam K, Zheng F, Gill DL, Regulation of canonical transient receptor potential (TRPC) channel function by diacylglycerol and protein kinase C, J. Biol. Chem. 2003; 278: 29031–29040. 10.1074/jbc.M302751200. [DOI] [PubMed] [Google Scholar]
- 37.Liao Y, Plummer NW, George MD, Abramowitz J, Zhu MX, Birnbaumer L, A role for Orai in TRPC-mediated Ca2+ entry suggests that a TRPC:Orai complex may mediate store and receptor operated Ca2+ entry, Proc. Natl. Acad. Sci. U. S. A. 2009; 106: 3202–3206. 10.1073/pnas.0813346106. [DOI] [PMC free article] [PubMed] [Google Scholar]
- 38.Hollins F, Sutcliffe A, Gomez E, Berair R, Russell R, Szyndralewiez C, Saunders R, Brightling C, Airway smooth muscle NOX4 is upregulated and modulates ROS generation in COPD, Respir. Res. 2016; 17: 84. 10.1186/s12931-016-0403-y. [DOI] [PMC free article] [PubMed] [Google Scholar]
- 39.Bergeron C, Al-Ramli W, Hamid Q, Remodeling in asthma, Proc. Am. Thorac. Soc. 2009; 6: 301–305. 10.1513/pats.200808-089RM. [DOI] [PubMed] [Google Scholar]
- 40.Kulkarni T, O’Reilly P, Antony VB, Gaggar A, Thannickal VJ, Matrix Remodeling in Pulmonary Fibrosis and Emphysema, Am. J. Respir. Cell Mol. Biol. 2016; 54: 751–760. 10.1165/rcmb.2015-0166PS. [DOI] [PMC free article] [PubMed] [Google Scholar]
- 41.Rahman IM Adcock, Oxidative stress and redox regulation of lung inflammation in COPD, Eur. Respir. J. 2006; 28: 219–242. 10.1183/09031936.06.00053805. [DOI] [PubMed] [Google Scholar]
- 42.Rubaiy HN, Ludlow MJ, Bon RS, Beech DJ. Pico145 - powerful new tool for TRPC1/4/5 channels. Channels (Austin). 2017. Sep 3;11(5):362–364. doi: 10.1080/19336950.2017.1317485. Epub 2017 Apr 11. [DOI] [PMC free article] [PubMed] [Google Scholar]
- 43.Li J, McKeown L, Ojelabi O, et al. Nanomolar potency and selectivity of a Ca2+ release-activated Ca2+ channel inhibitor against store-operated Ca2+ entry and migration of vascular smooth muscle cells. Br J Pharmacol. 2011;164(2):382–393. doi: 10.1111/j.1476-5381.2011.01368.x [DOI] [PMC free article] [PubMed] [Google Scholar]
- 44.Wajdner HE, Farrington J, Barnard C, et al. Orai and TRPC channel characterization in FcεRI-mediated calcium signaling and mediator secretion in human mast cells. Physiol Rep. 2017;5(5):e13166. doi: 10.14814/phy2.13166 [DOI] [PMC free article] [PubMed] [Google Scholar]
- 45.Seo K, Rainer PP, Shalkey Hahn V, et al. Combined TRPC3 and TRPC6 blockade by selective small-molecule or genetic deletion inhibits pathological cardiac hypertrophy [published correction appears in Proc Natl Acad Sci U S A. 2014 Apr 22;111(16):6115]. Proc Natl Acad Sci U S A 2014;111(4):1551–1556. [DOI] [PMC free article] [PubMed] [Google Scholar]
- 46.Schleifer H, Doleschal B, Lichtenegger M, Oppenrieder R, Derler I, Frischauf I, Glasnov TN, Kappe CO, Romanin C, Groschner K, Novel pyrazole compounds for pharmacological discrimination between receptor-operated and store-operated Ca(2+) entry pathways, Br. J. Pharmacol. 2012; 167: 1712–1722. 10.1111/j.1476-5381.2012.02126.x. [DOI] [PMC free article] [PubMed] [Google Scholar]
- 47.Yoshida S, Plant S. Mechanism of release of Ca2+ from intracellular stores in response to ionomycin in oocytes of the frog Xenopus laevis. J Physiol. 1992. Dec;458:307–18. doi: 10.1113/jphysiol.1992.sp019419. [DOI] [PMC free article] [PubMed] [Google Scholar]
- 48.Ozdemir O, Ravindranath Y, Savasan S, Endothelial Cell Injury of Carmustine (BCNU) in Hepatic Sinusoids: Contribution of Oxidation and Immune Reaction., Blood. 2004; 104: 1154–1154. 10.1182/blood.V104.11.1154.1154. [DOI] [Google Scholar]
- 49.Fischer MJ, Edwardson JM, V2A2lidating TRP channel heteromers, Temp. Austin Tex. 2014; 1: 26–27. 10.4161/temp.29548. [DOI] [PMC free article] [PubMed] [Google Scholar]
- 50.Delaunois LM, Mechanisms in pulmonary toxicology, Clin. Chest Med. 2004; 25: 1–14. 10.1016/S0272-5231(03)00122-9. [DOI] [PubMed] [Google Scholar]
- 51.Kirkham PA, Barnes PJ, Oxidative stress in COPD, Chest. 2013; 144: 266–273. 10.1378/chest.12-2664. [DOI] [PubMed] [Google Scholar]
- 52.Green HJ, Burnett M, Duhamel TA, D’Arsigny C, O’Donnell DE, Webb KA, Ouyang J, Abnormal sarcoplasmic reticulum Ca2+-sequestering properties in skeletal muscle in chronic obstructive pulmonary disease, Am. J. Physiol. Cell Physiol. 2008; 295: C350–357. 10.1152/ajpcell.00224.2008. [DOI] [PubMed] [Google Scholar]
- 53.Petit A, Knabe L, Khelloufi K, Jory M, Gras D, Cabon Y, Begg M, Richard S, Massiera G, Chanez P, Vachier I, Bourdin A, Bronchial Epithelial Calcium Metabolism Impairment in Smokers and Chronic Obstructive Pulmonary Disease. Decreased ORAI3 Signaling, Am. J. Respir. Cell Mol. Biol. 2019; 61: 501–511. 10.1165/rcmb.2018-0228OC. [DOI] [PubMed] [Google Scholar]
- 54.Nunes P, Demaurex N, Redox regulation of store-operated Ca2+ entry, Antioxid. Redox Signal. 2014; 21: 915–932. 10.1089/ars.2013.5615. [DOI] [PMC free article] [PubMed] [Google Scholar]
- 55.Song MY, Makino A, Yuan JX-J, Role of reactive oxygen species and redox in regulating the function of transient receptor potential channels, Antioxid. Redox Signal. 2011; 15: 1549–1565. 10.1089/ars.2010.3648. [DOI] [PMC free article] [PubMed] [Google Scholar]
- 56.Chen J, Crossland RF, Noorani MMZ, Marrelli SP, Inhibition of TRPC1/TRPC3 by PKG contributes to NO-mediated vasorelaxation, Am. J. Physiol. Heart Circ. Physiol. 2009; 297: H417–424. 10.1152/ajpheart.01130.2008. [DOI] [PMC free article] [PubMed] [Google Scholar]
- 57.Kochukov MY, Balasubramanian A, Noel RC, Marrelli SP, Role of TRPC1 and TRPC3 channels in contraction and relaxation of mouse thoracic aorta, J. Vasc. Res. 2013; 50: 11–20. 10.1159/000342461. [DOI] [PMC free article] [PubMed] [Google Scholar]
- 58.Wu X, Zagranichnaya TK, Gurda GT, Eves EM, Villereal ML, A TRPC1/TRPC3-mediated increase in store-operated calcium entry is required for differentiation of H19–7 hippocampal neuronal cells, J. Biol. Chem. 2004; 279: 43392–43402. 10.1074/jbc.M408959200. [DOI] [PubMed] [Google Scholar]
- 59.Yuan JP, Kim MS, Zeng W, Shin DM, Huang G, Worley PF, Muallem S, TRPC channels as STIM1-regulated SOCs, Channels Austin Tex. 2009; 3: 221–225. 10.4161/chan.3.4.9198. [DOI] [PubMed] [Google Scholar]
- 60.Chakraborty PK, Mustafi SB, Xiong X, et al. MICU1 drives glycolysis and chemoresistance in ovarian cancer. Nat Commun. 2017;8:14634. Published 2017 May 22. doi: 10.1038/ncomms14634 [DOI] [PMC free article] [PubMed] [Google Scholar]
- 61.Hogg JC, Chu F, Utokaparch S, Woods R, Elliott WM, Buzatu L, Cherniack RM, Rogers RM, Sciurba FC, Coxson HO, Paré PD, The nature of small-airway obstruction in chronic obstructive pulmonary disease, N. Engl. J. Med. 2004; 350: 2645–2653. 10.1056/NEJMoa032158. [DOI] [PubMed] [Google Scholar]
- 62.Rahman I, MacNee W, Antioxidant pharmacological therapies for COPD, Curr. Opin. Pharmacol. 2012; 12: 256–265. 10.1016/j.coph.2012.01.015. [DOI] [PMC free article] [PubMed] [Google Scholar]
- 63.Gerayeli FV, Milne S, Cheung C, Li X, Yang CWT, Tam A, Choi LH, Bae A, Sin DD, COPD and the risk of poor outcomes in COVID-19: A systematic review and meta-analysis, EClinicalMedicine. 2021; 33: 100789. 10.1016/j.eclinm.2021.100789. [DOI] [PMC free article] [PubMed] [Google Scholar]
- 64.Jeong KI, Piepenhagen PA, Kishko M, DiNapoli JM, Groppo RP, Zhang L, Almond J, Kleanthous H, Delagrave S, & Parrington M (2015). CX3CR1 Is Expressed in Differentiated Human Ciliated Airway Cells and Co-Localizes with Respiratory Syncytial Virus on Cilia in a G Protein-Dependent Manner. PloS one, 10(6), e0130517. 10.1371/journal.pone.0130517 [DOI] [PMC free article] [PubMed] [Google Scholar]
- 65.Sturrock A, Zimmerman E, Helms M, Liou TG, & Paine R 3rd (2021). Hypoxia induces expression of angiotensin-converting enzyme II in alveolar epithelial cells: Implications for the pathogenesis of acute lung injury in COVID-19. Physiological reports, 9(9), e14854. 10.14814/phy2.14854 [DOI] [PMC free article] [PubMed] [Google Scholar]
- 66.Radwanska A, Cottage CT, Piras A, Overed-Sayer C, Sihlbom C, Budida R, Wrench C, Connor J, Monkley S, Hazon P, Schluter H, Thomas MJ, Hogaboam CM, & Murray LA (2022). Increased expression and accumulation of GDF15 in IPF extracellular matrix contribute to fibrosis. JCI insight, 7(16), e153058. 10.1172/jci.insight.153058 [DOI] [PMC free article] [PubMed] [Google Scholar]
- 67.Zhang P, Zhang Y, Wang L, Wang X, Xu S, Zhai Z, Wang C, & Cai H (2022). Reversal of NADPH Oxidase-Dependent Early Oxidative and Inflammatory Responses in Chronic Obstructive Pulmonary Disease by Puerarin. Oxidative medicine and cellular longevity, 2022, 5595781. 10.1155/2022/5595781 [DOI] [PMC free article] [PubMed] [Google Scholar]
- 68.Chandorkar P, Posch W, Zaderer V, Blatzer M, Steger M, Ammann CG, Binder U, Hermann M, Hörtnagl P, Lass-Flörl C, & Wilflingseder D (2017). Fast-track development of an in vitro 3D lung/immune cell model to study Aspergillus infections. Scientific reports, 7(1), 11644. 10.1038/s41598-017-11271-4 [DOI] [PMC free article] [PubMed] [Google Scholar]
- 69.Gohy ST, Hupin C, Fregimilicka C, Detry BR, Bouzin C, Gaide Chevronay H, Lecocq M, Weynand B, Ladjemi MZ, Pierreux CE, Birembaut P, Polette M, Pilette C Imprinting of the COPD airway epithelium for dedifferentiation and mesenchymal transition. Eur Respir J. 2015; 45: 1258–1272. doi: 10.1183/09031936.00135814 [DOI] [PubMed] [Google Scholar]
Associated Data
This section collects any data citations, data availability statements, or supplementary materials included in this article.
Supplementary Materials
Figure S1. Gene expression profile of pulmonary epithelial (PE) or COPD cells for (A) TRP channels (TRPC), or store-operated Ca2+ entry components (B) STIM and ORAI channels.
Figure S2. Images (as background data for Figure 3) were obtained from (A) H2DCF2, (B) DAPI, and (C) Annexin V stained pulmonary epithelial (PE) or COPD cells with no treatment, Thapsigargin (Tg; 1 μM) only, Tg+SKF-96365 (SKF; 10 μM), or Tg+2-APB (12 μM).
Figure S3. Transient receptor potential canonical (TRPC) channels (TRPC1, TRPC3, TRPC4. TRPC5, TRPC6 and TRPC7), and store-operated Ca2+ entry components [stromal interaction molecule 1(STIM1) and STIM2 and ORAI channels (ORAI 1–3)] gene expression profile in A549 cells. Relative expression levels were normalized to GAPDH.
Figure S4. Characterization of [Ca2+]i entry in A549 cells using pharmacological inhibitors of TRPC1 and TRPC3. Ratiometric (340/380) Fura-2 traces of [Ca2+]i were measured in A549 cells in 1.2 mM Ca2+ or Ca2+-free cell bath. (A, B) In Ca2+-free cell bath, thapsigargin (Tg) was implemented after treatment with Pico1,4,5 (1 μM) or Synta66 (1 μM). (C, D) In 1.2 mM Ca2+, 100 μM OAG was applied to A549 cells with no inhibitors, Pyr10, or GSK2833503A (GSK2; 1 μM) and then the cell bath was replenished with 2.0 mM Ca2+.
Figure S5. Ionomycin-induced [Ca2+]i entry elicits SOCE in A549 cells. Ratiometric (340/380) Fura-2 traces of [Ca2+]i measurements were retrieved from A549 cells in Ca2+-free cell bath. 0.5 μM ionomycin were applied to A549 cells with (A) no inhibitors, (B) Pyr6, or (C) Pyr10, and then the cell bath was replenished with 2.0 mM Ca2+. Quantitated bar diagrams depicting (D) Ca2+ release or (E) Ca2+ entry for experimental groups with Pyr6 or Pyr10 inhibitors are in mean + SEM. *, p < 0.05; ** p < 0.01. Student’s two-tailed t-test with one-way ANOVA and Tukey’s test was performed to evaluate statistical significance.
Figure S6. Electrophysiological characterization of A549 cells. (A-C) Current densities of voltage ramps from −100 to +100 mV were recorded from A549 cells and quantitated into I-V curves. After receiving baseline measurements from the cells, (A, B) CCh (carbachol; 100 μM) or (C) GSK1702934A (GSK1; 1 μM) was applied as an agonist, and then (A) Pico1,4,5 (1 μM), (B) Synta66 (1 μM), or (C) GSK2833503A (GSK2; 1 μM) was applied as an inhibitor to the induced current. Bar graphs in A-C show average current densities at +100 mV in mean + SEM. (A-C) Time-lapse recordings of current densities at +100 and −100 mV were plotted for each experiment.
Figure S7. TRPC1 and TRPC3 knockdown in A549 cells decreases Ca2+ entry. Ratiometric (340/380) Fura-2 traces of [Ca2+]i measurements were retrieved from A549 cells in Ca2+-free cell bath. Addition of 0.5 μM thapsigargin (Tg) to A549 cells with siRNAs: (A) Scramble, (B) TRPC1, (C) TRPC3, (D) TRPC1+TRPC3, (E) ORAI1 and (F) STIM1, then the cell baths were replenished with 2.0 mM Ca2+. Experiments performed n=3 times with ~ 40 – 50 cells. (G) TRPC1, TRPC3, ORAI1, and STIM1 gene expression comparison of control (scramble) and siRNA transfected A549 cells. GAPDH was used as internal control. Quantitated bar diagrams depicting (H) Ca2+ release or (I) Ca2+ peak is in mean + SEM.
Figure S8. TRPC1 or TRPC3 inhibition in A549 cells prevents BCNU-induced cell death. (A) Microscopy images were obtained from DAPI stained A549 cells after no treatment (Control), BCNU (+BCNU), BCNU and Pico1,4,5 (+BCNU+Pico1,4,5), BCNU GSK2833503A (+BCNU+GSK2), or BCNU and Pyr10 (+BCNU+Pyr10) treatments. (B) Percentage cell death of untreated and untreated A549 cells was analyzed using ImageJ. (C) Serum-free media form the same treated cells were collected for LDH release analysis. (B, C) Quantitated bar diagrams are in mean + SEM. *, p < 0.05. Scale bars = 50 μm.
Data Availability Statement
The data that support the findings of this study are available from the corresponding author upon reasonable request. Any experimental data or additional information necessary to reanalyze the data reported in this study are available from the Lead contact. This study does not report any original code.