

SUMMARY
We sought to characterize the unique role of somatostatin (SST) in the prelimbic (PL) cortex in mice. We performed slice electrophysiology in pyramidal and GABAergic neurons to characterize the pharmacological mechanism of SST signaling and fiber photometry of GCaMP6f fluorescent calcium signals from SST neurons to characterize the activity profile of SST neurons during exploration of an elevated plus maze (EPM) and open field test (OFT). We used local delivery of a broad SST receptor (SSTR) agonist and antagonist to test causal effects of SST signaling. SSTR activation hyperpolarizes layer 2/3 pyramidal neurons, an effect that is recapitulated with optogenetic stimulation of SST neurons. SST neurons in PL are activated during EPM and OFT exploration, and SSTR agonist administration directly into the PL enhances open arm exploration in the EPM. This work describes a broad ability for SST peptide signaling to modulate microcircuits within the prefrontal cortex and related exploratory behaviors.
In brief
Brockway et al. demonstrate a role for somatostatin peptide signaling in the cortex of mice. Here, they show somatostatin inhibits both cortical microcircuits and output populations. SST neurons are active during exploratory behaviors, and exploration is enhanced when SST receptor targeting drugs are administered to the cortex.
Graphical Abstract

INTRODUCTION
The prefrontal cortex (PFC) contains a complex microcircuitry of γ-aminobutyric acid (GABA)-expressing inhibitory neurons capable of modulating excitatory cortical outputs involved in orchestrating a range of behaviors. Somatostatin (SST) neurons within the cortex have been implicated in a variety of neuropsychiatric diseases and associated behavioral states.1,2 SST neurons play a role in alcohol drinking,3 fear learning,4 and the interaction between substance use and avoidance states.5 These neurons also facilitate oscillatory synchrony between the PFC and the hippocampus,6 an established neural correlate of avoidance behaviors.7–10 In addition, SST neurons are active during restraint stress,11 highlighting the rapid recruitment of SST neurons. However, little is known about how SST itself functions as a signaling molecule in this region.
Neuropeptides including SST are stored in dense-core vesicles12 and can often diffuse greater distances than traditional neurotransmitters.13 These properties of neuropeptides position them to modulate circuits and behaviors in unique and diverse ways2,14 that can complement co-released GABA.2,14 SST signals through binding at five G protein-coupled receptors that are predominately Gi/o coupled and are expressed throughout the mammalian cortex.15,16 The clinical literature suggests a strong “pro-resiliency” role for SST.2,17 SST mRNA is decreased in the postmortem PFC of individuals with bipolar disorder,18 major depressive disorder,19 and schizophrenia.20 Similarly, alcohol-induced changes in local functional connectivity are dependent on overall SST gene expression in healthy individuals, with greater SST gene expression corresponding to decreased alcohol-induced changes.21 Together, the human literature provides ample evidence for SST as a positive marker for the healthy brain, with decreasing expression, independent of GABAergic changes, associated with a host of neuropsychiatric disorders.
We demonstrate key actions of SST peptide signaling on modulating mouse prelimbic (PL) circuits and promoting exploratory behaviors. We used slice electrophysiology to demonstrate key physiological actions of SST peptidergic signaling on cortical microcircuits, using both exogenous bath application and stimulation of endogenous SST release. Second, we turned to in vivo fiber photometry to assess whether these neurons are activated during PFC-dependent behaviors in a manner that might promote endogenous peptide release. Lastly, we administered an SST receptor (SSTR) agonist, and separately, an SSTR antagonist, into the PL cortex to assess the causal effects of SST signaling on these same behaviors.
RESULTS
Somatostatin has an inhibitory effect on PL cortical circuits
To examine the effect of SST on PL cortical circuits, ex vivo whole-cell current-clamp recordings were performed on pyramidal neurons in layer 2/3 of the PL cortex in adult male and female C57BL/6J mice (representative circuit diagram in Figure 1A). Layer 2/3 pyramidal neurons, a direct monosynaptic target of SST cells, were chosen to correspond with our previously published work.3,5,22 Measurements of intrinsic excitability were conducted at both resting membrane potential (RMP) and at the standard holding potential of −70 mV before and after 10 min bath application of 1 μM SST (chosen to correspond with previously published work on SST in cortical neurons23). As no sex differences emerged in the overall effect of SST on pyramidal neurons, electrophysiology data are presented with the sexes combined. Representative traces of rheobase recordings are shown in Figure 1B, before and after SST application. SST hyperpolarized pyramidal neurons and significantly decreased the RMP (Figure 1C). SST also significantly increased the rheobase at both RMP and −70 mV (Figures 1D and 1F). SST did not significantly alter the action potential threshold at RMP or −70 mV (Figures 1E and 1G). Representative traces are shown in Figures 1H and 1I. SST significantly reduced the number of action potentials fired in the VI plot at RMP (Figure 1H). There was also a significant current × drug interaction in the number of action potentials fired in the VI plot at −70 mV (Figure 1I).
Figure 1. Somatostatin hyperpolarizes PL pyramidal neurons of male and female mice.
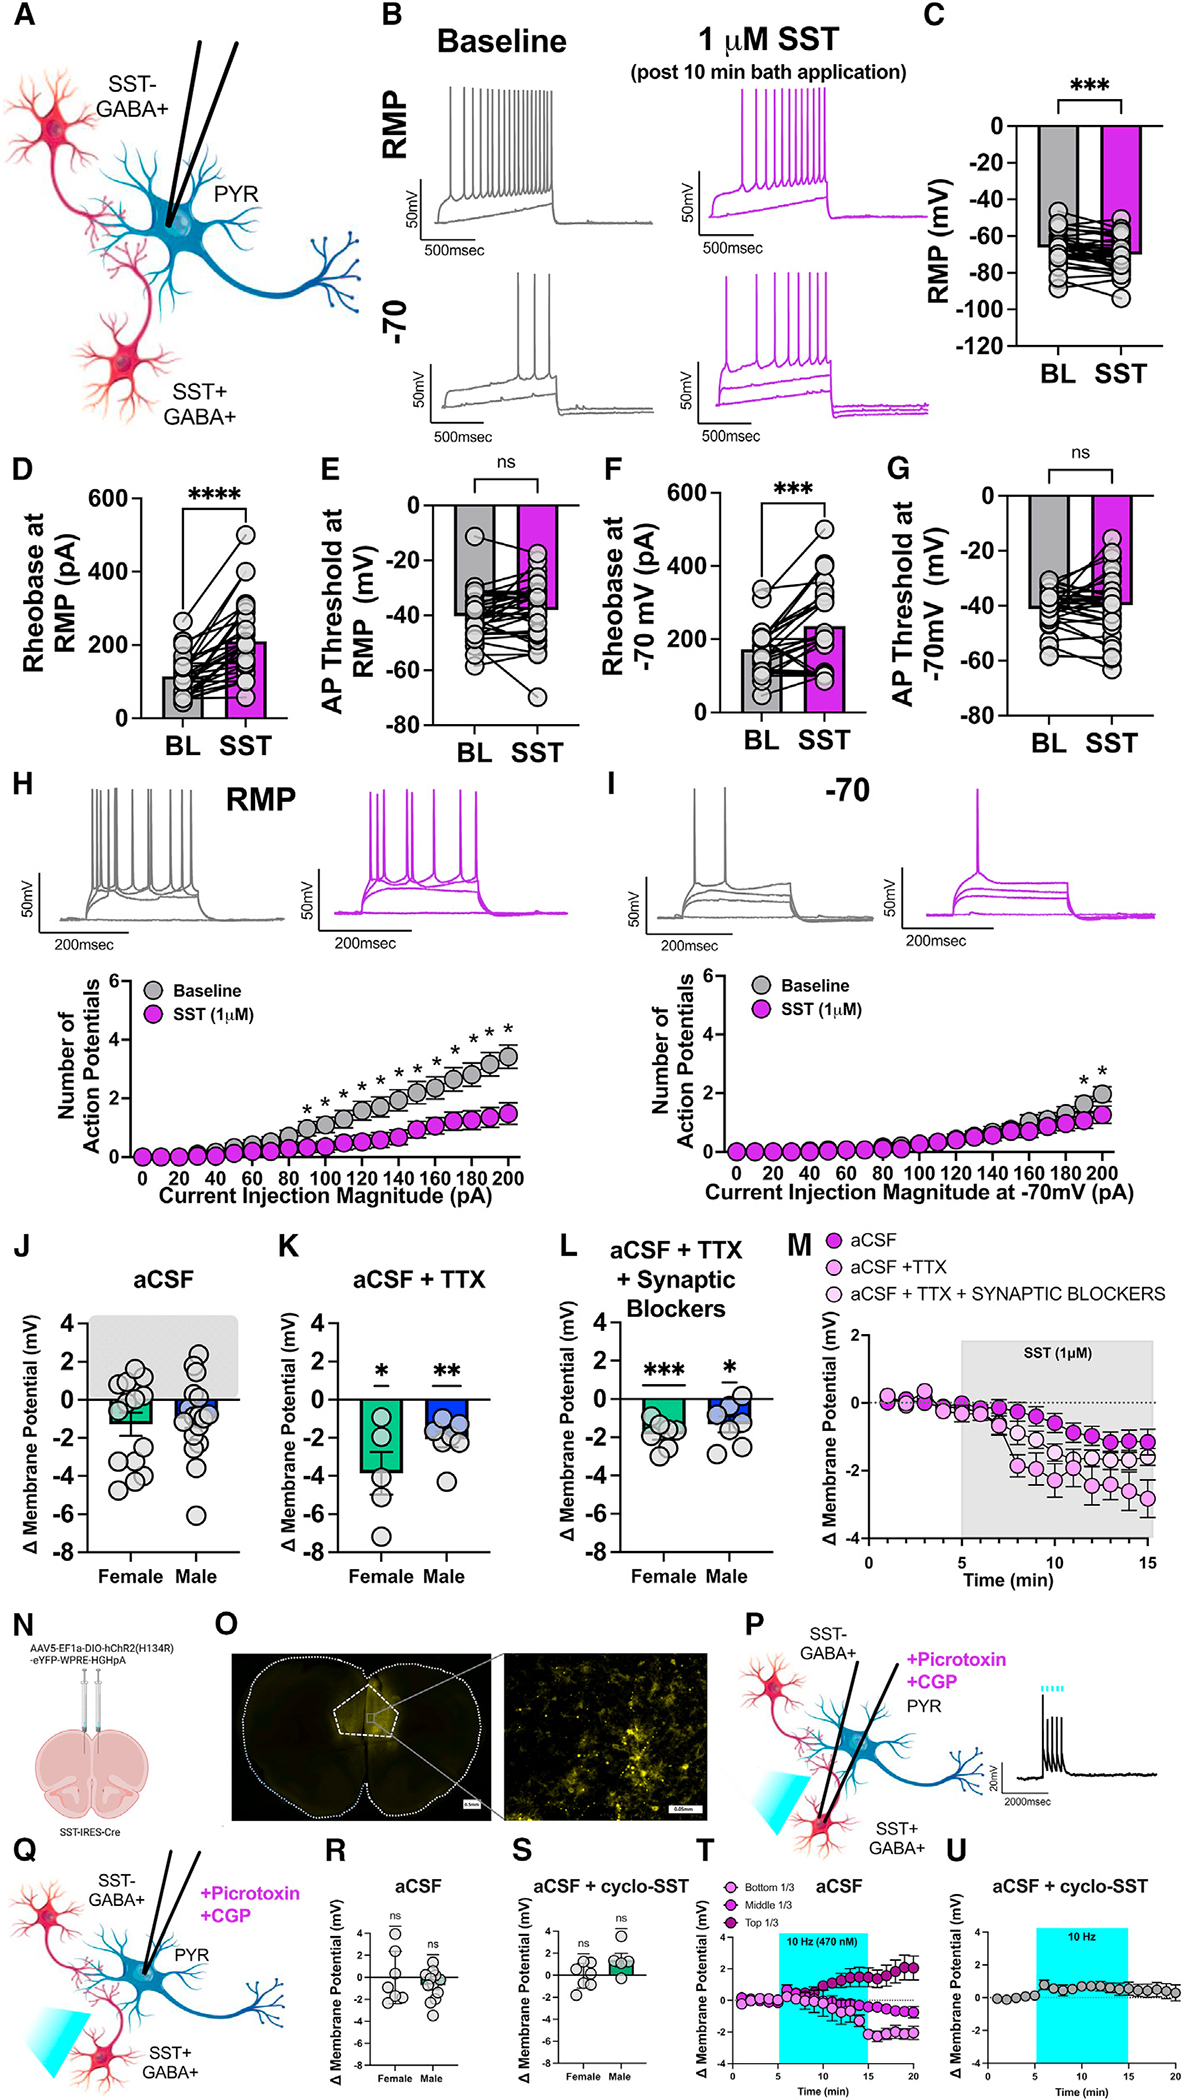
(A) Schematic of experimental setup.
(B) Representative traces before (gray) and after (purple) 1 μM SST application at both RMP (top) and −70 mV (bottom) for rheobase experiments.
(C and D) SST significantly decreased the RMP (paired t test; t30 = 3.679, p = 0.0009), and (D) significantly increased the rheobase at RMP (paired t test; t30 = 6.571, p < 0.0001).
(E) SST did not significantly alter the action potential threshold at RMP (paired t test; t30 = 1.568, p = 0.1273).
(F) Similar effects are seen at the common holding potential of −70 mV with SST bath application significantly increasing the rheobase (paired t test; t30 = 4.105, p = 0.0003).
(G) SST did not significantly alter the action potential threshold at −70 (paired t test; t30 = 0.8883, p = 0.3814).
(H) Representative VI traces (corresponding to 0, 110, 150, and 200 pA of current) at RMP before (gray) and after (purple) SST application. SST significantly reduces the number of action potentials fired in response to increasing amounts of current injection at RMP (two-way ANOVA; Fcurrent(20,600) = 31.51, p < 0.0001; Fdrug(1,30) = 17.50, p = 0.0002, Fcurrent × drug(20,600) = 15.51, p < 0.0001; significant post-hoc Bonferroni’s are indicated on figures).
(I) Representative VI traces (corresponding to 0, 110, 150, and 200 pA of current) at −70 mV before (gray) and after (purple) SST application. Significant reductions in action potential firing were seen at the highest current injection magnitudes, at the common holding potential of −70 mV (two-way ANOVA; Fcurrent(20,580) = 24.22, p < 0.001; Fdrug(1,29) = 1.637, p = 0.2109, Fcurrent × drug(20,580) = 3.247, p < 0.0001; significant post-hoc Bonferroni’s are indicated on figures). For (A)–(H), n = 31 cells from 12 female and 13 male mice; for (I), n = 30 cells from 11 female and 13 male mice.
(J) Shift in membrane potential in aCSF (female in green, male in blue) following 10 min SST administration. n = 31 cells from 12 female and 13 male mice.
(K) Shift in membrane potential (female in green, male in blue) following 10 min SST administration with the addition of 500 nM TTX in the aCSF (one-sample t test; females t4 = 3.448, p = 0.0261; males t6 = 5.095, p = 0.0022). n = 12 cells from 4 female and 5 male mice.
(L) Shift in membrane potential (female in green, male in blue) following 10 min SST administration with the addition of 500 nM TTX to block action potentials and 3 mM kynurenic acid to block glutamate receptors, 25 μM picrotoxin to block GABAA receptors, and 1 μM CGP to block GABAB receptors (one-sample t test; females t6 = 6.850, p = 0.0005; males t6 = 3.179, p = 0.0191). n = 14 cells from 5 female and 6 male mice.
(M) Data from (J)–(L) graphed as a function of time throughout the recording.
(N) AAV5-EF1a-DIO-hChR2(H134R)-eYFP-WPRE-HGHpA was injected into the PL of adult SST-IRES-Cre +/− mice and was allowed to express for a minimum of 3 weeks.
(O) Representative images of ChR2 injections. Left, ChR2 injections were confined to the prelimbic cortex (scale bar represents 0.5 mm, 4x magnification). Right,20x magnification of injection site and patching region (scale bar represents 0.05 mm).
(P) SST neurons in the PL were patched and reliably elicited action potentials at 10 Hz. 25 μM picrotoxin was added to the aCSF to block GABAA receptors and 1 μM CGP to block GABAB receptors.
(Q) Pyramidal cells in the PL were patched and following a 5-min stable baseline, SST cells were stimulated for 10 min (10 Hz). 25 μM picrotoxin was added to the aCSF to block GABAA receptors and 1 μM CGP to block GABAB receptors.
(R) Shift in membrane potential (female in green, male in blue) following 10 min SST activation (10 Hz) with the addition of 25 μM picrotoxin to the aCSF to block GABAA receptors and 1 μM CGP to block GABAB receptors (one-sample t test; females t6 = 0.02415, p = 0.9815; males t11 = 1.801, p = 0.0992). n = 19 cells from 4 female and 5 male mice.
(S) Shift in membrane potential (female in green, male in blue) following 10 min SST activation (10 Hz) with the addition of 1 μM cyclo-SST to block SST receptors, 25 μM picrotoxin to the aCSF to block GABAA receptors, and 1 μM CGP to block GABAB receptors (one-sample t test; females t6 = 0.09895, p = 0.9244; males t4 = 2.263, p = 0.0864). n = 12 cells from 5 female and 3 male mice.
(T) Data from (R) graphed as a function of time throughout the recording. Data were separated into thirds depending on the level of hyperpolarization following 10 min and graphed separately for visualization. Those that hyperpolarized the most are labeled bottom 1/3 and are depicted in light purple, middle 1/3 in medium purple, and top 1/3 in deep purple.
(U) Data from (S) graphed as a function of time throughout the recording. There was no significant effect of optogenetic stimulation of SST neurons in the presence of the SSTR antagonist cyclo-SST (one-sample t test; t11 = 1.381, p = 0.1946). Data are expressed as means ± SEM and considered significant if p < 0.05.
Interestingly, meaningful variability in SST-induced changes in pyramidal neuron membrane potential emerged (Figure 1J, for individual data and separated by sex). While SST hyperpolarized most pyramidal neurons recorded in the PL cortex, a meaningful subset (approximately 35%) depolarized, suggesting that polysynaptic SSTR effects may lead to Gi/o-mediated disinhibitory effects in a subset of neurons. To determine whether the hyperpolarizing effects of SST are dependent on polysynaptic activity, action potentials were blocked, and monosynaptic circuits were isolated with 500 nM TTX. When polysynaptic network activity was blocked, all neurons hyperpolarized in response to SST. SST significantly hyperpolarized pyramidal neurons in both females and males (Figure 1K, overall effect separated by sex, with no clear sex differences). This suggests that SST effects on pyramidal neurons are strongest when isolated from polysynaptic circuits, and that the paradoxical depolarization seen in a subset of pyramidal neurons is driven by changes in local network activity. To further confirm that SST is acting to hyperpolarize pyramidal cells independent of both network activity and synaptic (glutamate and GABA) influence, both action potentials and synaptic signaling were blocked using 500 nM TTX, 25 μM picrotoxin to block GABAA receptors, 1 μM CGP 55845 to block GABAB receptors, and 3 mM kynurenic acid to block AMPA and NMDA receptors (Figure 1L). SST significantly hyperpolarized pyramidal neurons in both females and males under these conditions. This overall demonstrates that SST hyperpolarizes pyramidal cells, through SST receptors on pyramidal cells, independent of changes in synaptic activity (Figure 1M, data from Figures 1J–1L graphed as a function of time).
We next sought to uncover whether endogenously evoked SST release exerted a similar effect. We optogenetically activated ChR2-expressing SST cells at 10 Hz in the presence of GABA receptor blockers (25 μM picrotoxin and 1 μM CGP 55845) to exclude the effect of co-released GABA while simultaneously recording from pyramidal neurons (Figures 1N and 1O). SST cells fired action potentials in response to a brief 10-Hz (470 nm) stimulation comparable to our previously published work (Figure 1P). SST cells were optogenetically stimulated at 10 Hz (470 nm) for 10 min while simultaneously recording the membrane potential of pyramidal cells (Figure 1Q). Males and females were visualized separately to assess whether endogenously evoked SST differed across sexes. 10 min of 10-Hz stimulation did not significantly alter the membrane potential (in Figure 1R, overall effect separated by sex). Further, when 1 μM of the SST receptor antagonist cyclo-SST was added to the bath to block SST receptors along with synaptic blockers, 10 min of 10-Hz stimulation did not significantly alter the membrane potential at the population level (Figure 1S, overall effect separated by sex). However, optogenetic stimulation of SST neurons produced a similarly variable effect on membrane potential as that seen with SST bath application when network activity was not blocked (Figure 1J). There was also greater standard deviation observed in the aCSF group (1.770; Figure 1Q) than when SSTRs were blocked (1.383; Figure 1R) suggesting SST may contribute to this variability. Therefore, data from Figure 1R were split into thirds for visualization to mimic the effect seen with bath application, demonstrating a robust hyperpolarization in a subset of neurons (as approximately 1/3 of cells hyperpolarized, 1/3 remained stable, and 1/3 depolarized in response to SST; Figure 1T). There was no effect of optogenetic stimulation of SST neurons in the presence of the SSTR antagonist cyclo-SST (Figure 1U). Interestingly, there was a visible depolarization observed in the presence of cyclo-SST, which implicates co-release of other neuropeptides beyond SST. Collectively, these experiments demonstrate a hyperpolarizing effect of SST on a subset of pyramidal neurons and reveal the complexity of SST peptidergic function.
When the broad SSTR antagonist cyclo-SST (1 μM) was present in the aCSF, SST did not significantly alter the RMP (representative circuit diagram in Figure S1A, rheobase traces in Figure S1B, bath application in Figure S1C, and summary RMP in Figure S1D). SST had no effect on rheobase at RMP (Figure S1E) or action potential threshold at RMP (Figure S1F). Further, SST had no effect on the rheobase at −70 mV (Figure S1G) or action potential threshold at −70 mV (Figure S1H). Moreover, SST did not affect the number of action potentials fired in the VI plot at either RMP or −70 mV (Figures S1I–S1L). Together, these experiments confirm that SST-mediated hyperpolarization and reduced excitability of pyramidal neurons are dependent on SSTRs.
We further determined whether SST-mediated hyperpolarization and reduced excitability of pyramidal neurons are reversible with post-application of cyclo-SST. Pyramidal neurons in layer 2/3 of the PL cortex were patched and 1 μM SST applied followed by 1 μM cyclo-SST application. Results were comparable to those without post-application of the antagonist in Figure 1. SST with a cyclo-SST washout still significantly hyperpolarized the RMP and rheobase at RMP (representative circuit diagram in Figure S2A, rheobase traces in Figure S2B, overall bath application of SST and cyclo-SST washout in Figure S2C, and overall RMP effect in Figure S2D). While the rheobase at RMP was significantly increased (Figure S2E), the action potential threshold at RMP, rheobase at −70 mV, and action potential threshold at −70 mV were not significantly changed from pre-SST baseline (Figures S2F–S2H). This protocol resulted in no significant change in the number of action potentials fired in the VI plot at both RMP and −70 mV (Figures S2I–S2L). This suggests that, overall, the effect of SSTR activation on RMP and rheobase is largely not reversible with an SSTR antagonist.
Ex vivo whole-cell current-clamp recordings were then conducted in non-pyramidal, GABAergic populations in the PL cortex (representative circuit diagram in Figure 2A, and see Dao et al.3). Representative traces of rheobase recordings before and after SST application are shown in Figure 2B. SST hyperpolarized non-pyramidal neurons and significantly decreased the RMP (Figures 2C and 2D). SST did not significantly alter the rheo-base at RMP (Figure 2E), action potential threshold at RMP (Figure 2F), rheobase at −70 mV (Figure 2G), or action potential threshold at −70 mV (Figure 2H). However, SST significantly reduced the number of action potentials fired in response to increasing current injection at RMP (Figures 2I and 2J) but not at −70 mV. These findings suggest that SST also acts on GABAergic populations within the PL cortex. The inter-spike interval of GABA cell action potentials did not significantly correlate with the magnitude of SST modulation (change in membrane potential [mV]; r(10) = 0.07, p = 0.847) suggesting no clear differences in SST effects on putatively fast-spiking GABA neurons versus non-fast-spiking GABA neurons. When direct, network-independent effects (representative circuit diagram in Figure 2M) were isolated using TTX (500 nM), SST significantly hyperpolarized non-pyramidal cells (Figure 2N for individual data; Figure 2O for time course data).
Figure 2. SST dampens excitability of and hyperpolarizes PL non-pyramidal cells.
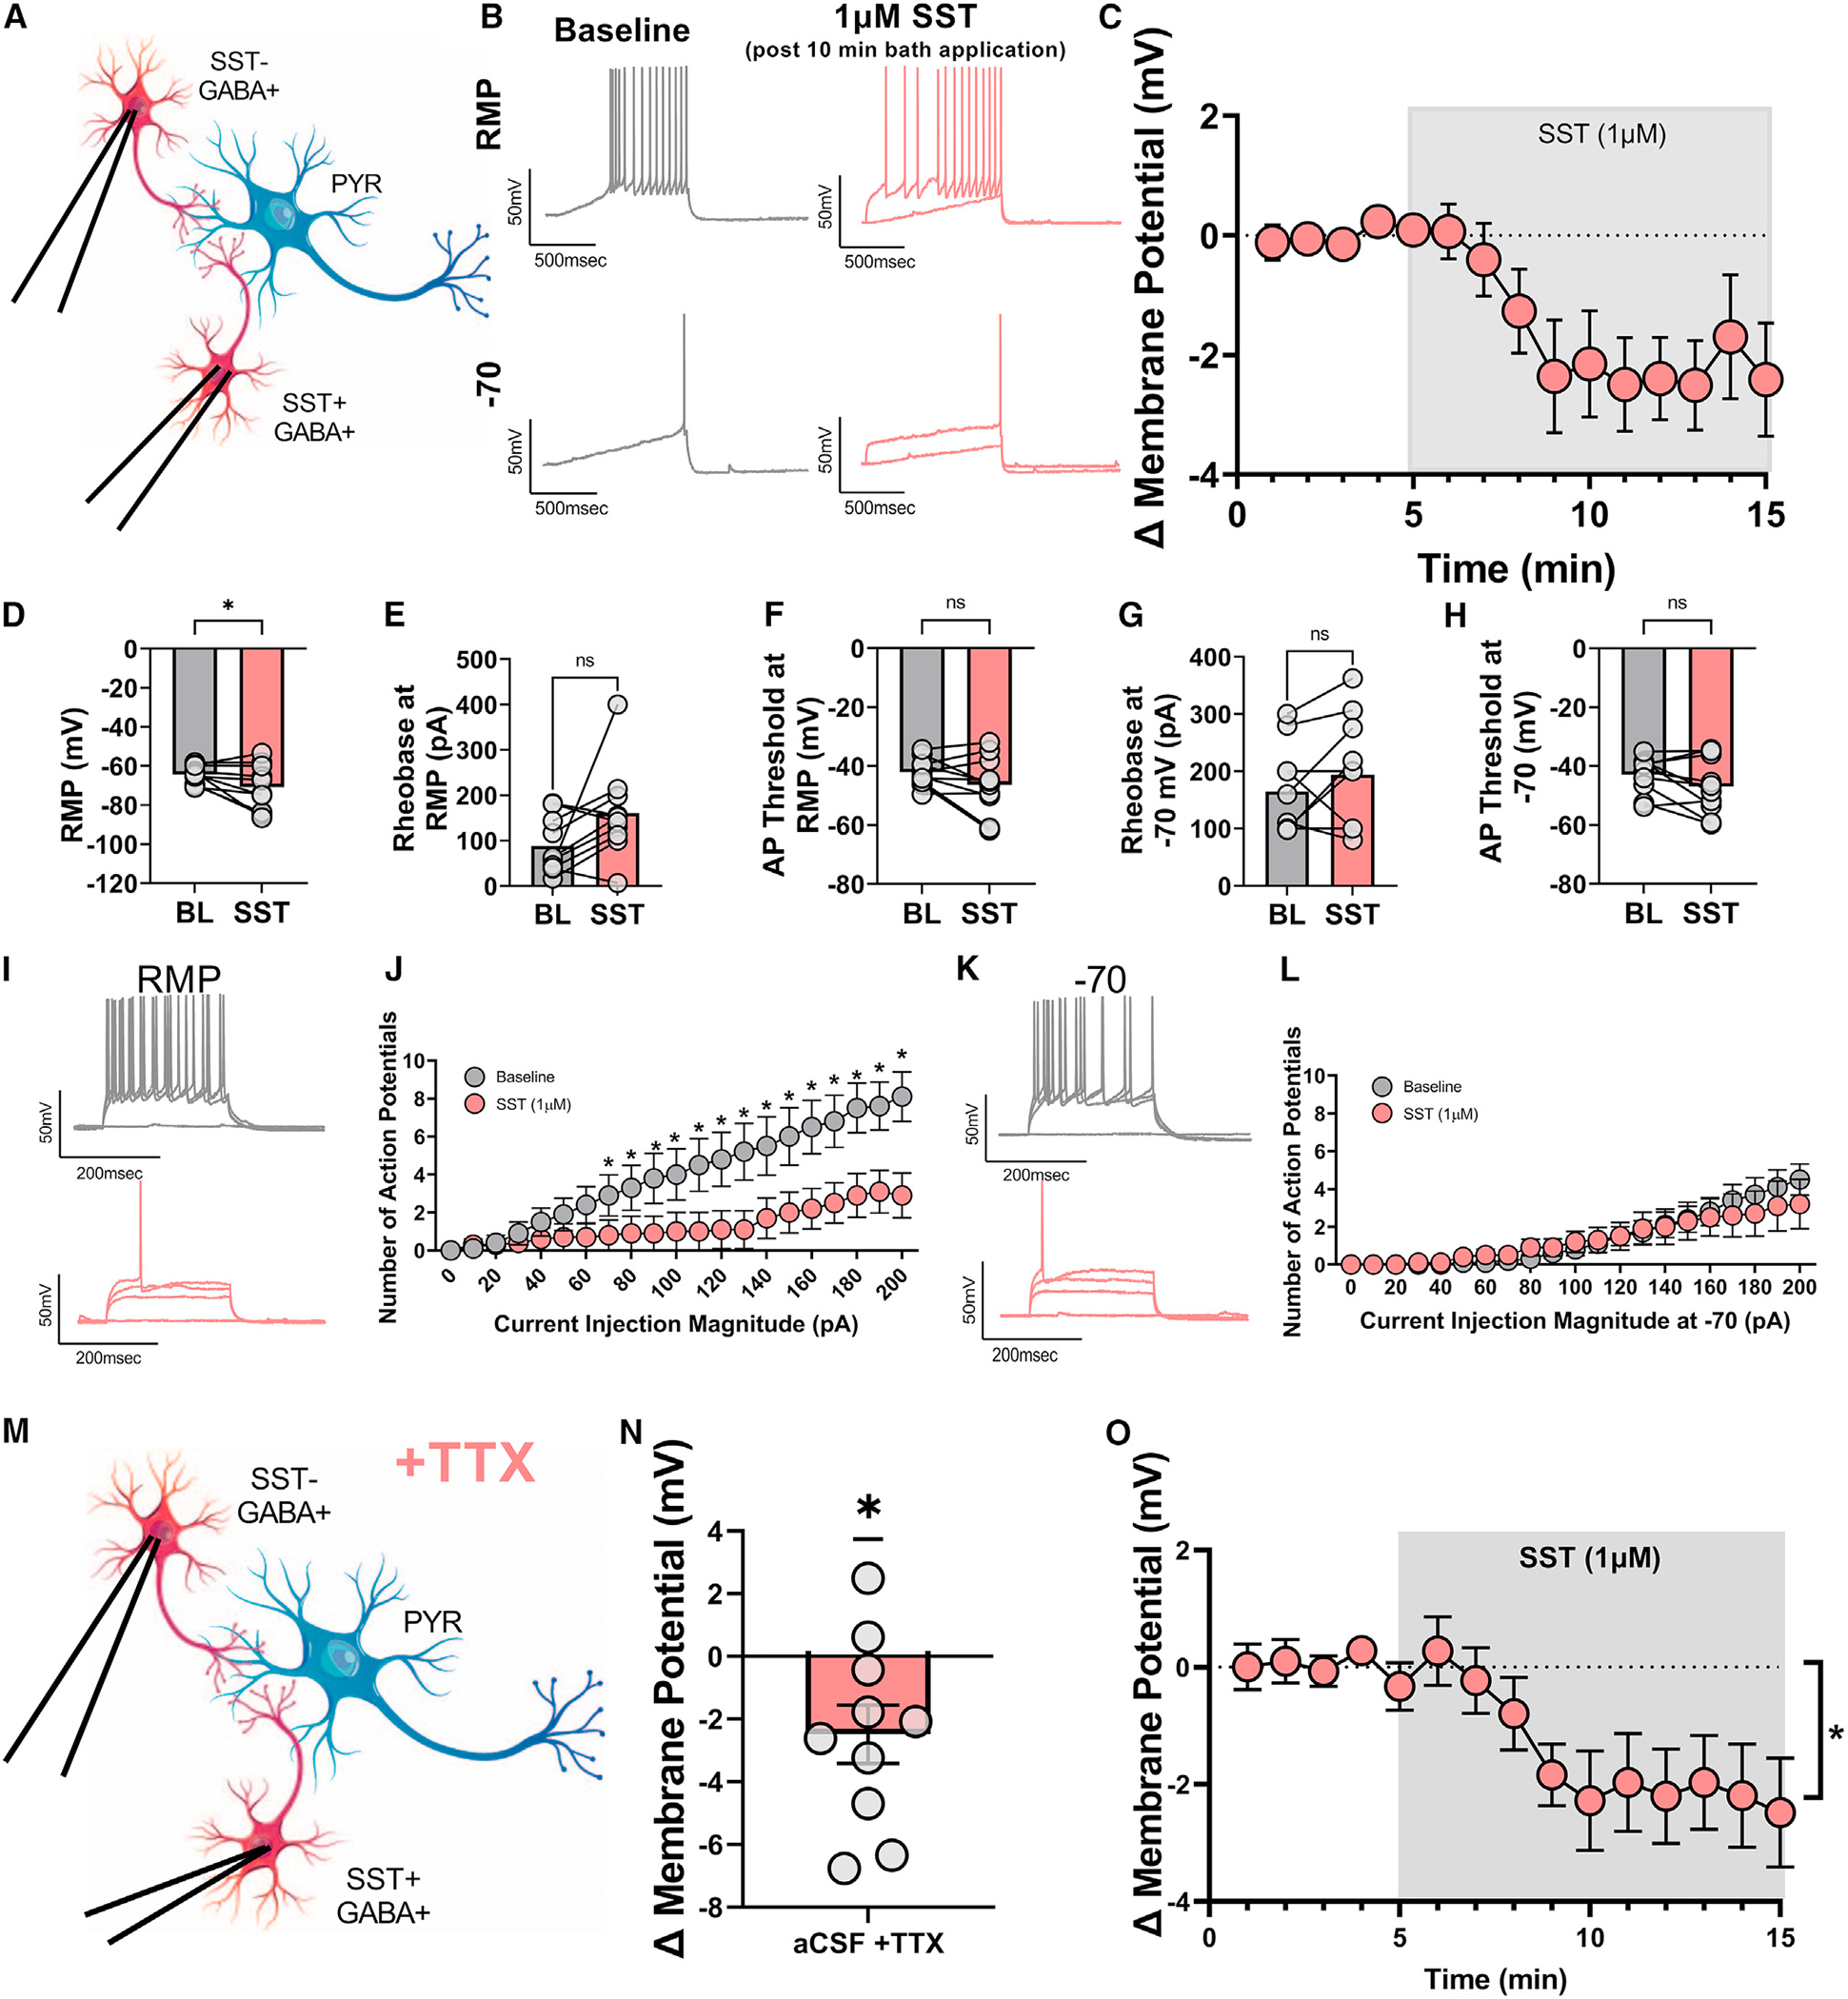
(A) Schematic of experimental setup.
(B) Representative traces before (gray) and after (red) SST 1 μM application at both RMP (top) and −70 mV (bottom) for rheobase experiments.
(C) Change in membrane potential over time following SST bath application.
(D) SST significantly decreased the RMP (paired t test; t9 = 2.291, p = 0.0477).
(E and F) However, (E) the rheobase at RMP (paired t test; t9 = 2.046, p = 0.0711) and (F) the action potential threshold at RMP were not significantly changed (paired t test; t9 = 1.751, p = 0.1138).
(G and H) In addition, the rheobase at −70 mV (paired t test; t9 = 1.320, p = 0.2195) and (H) the action potential threshold at −70 mV (paired t test; t9 = 1.840, p = 0.0990) were not significantly altered.
(I) Representative VI traces at RMP (corresponding to 0, 110, 150, 190 pA of injected current) before (gray) and after (red) SST application.
(J) SST significantly reduces the number of action potentials fired in response to increasing amounts of current injection at RMP (two-way ANOVA; Fcurrent(20,180) = 22.72, p < 0.0001; Fdrug(1,9) = 6.198, p = 0.344, Fcurrent × drug (20,180) = 8.437, p < 0.0001, significant post-hoc Bonferroni’s are indicated on figure).
(K) Representative VI traces at −70 mV (corresponding to 0, 110, 150, 190 pA of injected current) before (gray) and after (red) SST application.
(L) SST does not significantly alter the number of action potentials fired at the common holding potential of −70 mV (two-way ANOVA; Fcurrent(20,180) = 14, p < 0.0001; Fdrug(1,9) = 0.0183, p = 0.8951, Fcurrent × drug (20,180) = 1.0, p = 0.4063).
(M) Model depicting isolation of network-independent effects using TTX while patching PL cortex non-pyramidal neurons.
(N) Change in membrane potential over time following SST bath application.
(O) Time course of SST effects; SST significantly hyperpolarizes non-pyramidal cells when network activity is blocked (one-sample t test; t9 = 2.668, p = 0.0257). For (A)–(L), n = 10 cells from 2 female and 4 male mice. For (M)–(O), n = 10 cells from 4 female and 4 male mice. Data are expressed as means ± SEM and considered significant if p < 0.05.
SST neurons display task-relevant activity during exploratory behaviors
We next explored whether in vivo activity of SST neurons was related to behavioral performance in the EPM and OFT. VIP::Cre;SST::Flp mice were injected in PL cortex with dual adeno-associated viruses (AAVs) encoding a Flp-dependent GCaMP6f and Cre-dependent TdTomato and implanted with an optical fiber in PL cortex (schematic and representative histology, Figures 3A and 3B; histology from all mice in Figure S3A). A custom-made dual-color spectrometer-based in vivo fiber photometry system was used (schematic in Figure 3C, sample fluorescence spectrum in Figure 3D). No sex differences were detected in the analyzed behavior or photometry signals, so data were pooled by sex (Figures 3 and S3; pink dots denote females, and purple dots denote males).
Figure 3. Somatostatin neurons in PL are active during exploration of the EPM and OFT.

(A) Schematic of AAV9.CAG.DIO.TdTomato and AAV9.Ef1a.fDIO.GCaMP6f injection with optic fiber implant into unilateral PL cortex.
(B) Sample image of GCaMP6f and TdTomato expression (in putative SST+ and VIP+ interneurons, respectively) and optic fiber placement in PL cortex. Scale bar: 50 μm.
(C) Schematic of dual-color spectrometer-based in vivo fiber photometry system.
(D) Sample fluorescence spectrum from PL cortex showing putative GCaMP6f and TdTomato fluorescence at a peak and trough of the GCaMP6f response.
(E) Sample heatmap of PrL SST+ interneuron Ca2+ dynamics as a function of location in the EPM. Ca2+-dependent GCaMP6f fluorescence intensity is reported as the Z-scored ratio of GCaMP6f:TdTomato (G:T) fluorescence, normalized between 0 and 1.
(F) Sample photometric recording of G:T fluorescence during EPM exploration. Gray bars mark periods of open arm exploration.
(G) Mean Z-scored G:T fluorescence during exploration of the open vs. closed arms of the EPM (paired t test; t10 = 6.101, p < 0.001). Dots represent individual mice. Male mice, purple; female mice, pink.
(H) Mean Z-scored G:T fluorescence during exploration of the open vs. closed arms across the 10-min EPM test (two-way ANOVA; FTime × Arm(2.87, 22.93) = 3.487, p < 0.05).
(I) Z-scored G:T fluorescence aligned to center-to-open arm and center-to-closed arm transitions in the EPM, averaged across mice. One-sample t tests vs. Z score = 0: center > open: t10 = 4.351, p = 0.0014; center > closed: t10 = 2.861, p = 0.01659. Center-to-open transitions: Bonferroni-corrected post-hoc one-sample t tests (vs. Z score = 0), *: 3–4 s and 4–5 s, p < 0.05. Center-to-closed transitions: Bonferroni-corrected post-hoc one-sample t tests (vs. Z score = 0), *: 0–1 s and 1–2 s, p < 0.05.
(J) Z-scored G:T fluorescence and mouse speed aligned to center-to-open arm (left) and center-to-closed arm (right) transitions in the EPM, averaged across mice. Two-way RM ANOVA: FTime × Transition(9,180) = 5.672, p < 0.0001; significant post-hoc Šidák’s tests: C > C diff. from C > O at 0–1, 3–4, and 4–5 s, p < 0.05.
(K) Sample heatmap of Z-scored G:T fluorescence (normalized between 0 and 1) as a function of location in the OF.
(L) Sample photometric recording of G:T fluorescence during OF exploration. Gray bars mark periods of center zone exploration.
(M) Mean Z-scored G:T fluorescence during exploration of the center and surround of the OF. Paired t test; t10 = 2.797, p = 0.0189. Dots represent individual mice. Male mice, purple; female mice, pink.
(N) Mean Z-scored G:T fluorescence during exploration of the center and surround across the 30-min OFT. Two-way RM ANOVA: FTimexZone(4.55, 43.39) = 2.759, p < 0.05.
(O) Z-scored G:T fluorescence aligned to surround-to-center zone and center-to-surround zone transitions in the OF, averaged across mice. One-sample t tests (vs. Z score = 0): surround > center: t10 = 5.069, p = 0.0005; center > surround: t10 = 5.234, p = 0.0004. Surround-to-center transitions: Bonferroni-corrected post-hoc one-sample t tests (vs. Z score = 0), *: 1–2 s, 2–3 s, 3–4 s, and 4–5 s, p < 0.005. Center-to-surround transitions: Bonferroni-corrected post-hoc one-sample t tests (vs. Z score = 0), *: −1 to 0 s, 0–1 s, and 1–2 s, p < 0.05. Two-way RM ANOVA: FTime × Transition(9,180) = 10.12, p < 0.0001; significant post-hoc Šidák’s tests: C > S diff. from S > C at −1 to 0 s and 0–1 s, p < 0.05.
(P) Z-scored G:T fluorescence and mouse speed aligned to surround-to-center zone (left) and center-to-surround zone (right) transitions in the OF, averaged across mice. For all panels, n = 11 mice (6 female and 5 male). Data are expressed as means ± SEM and considered significant if p < 0.05.
SST neurons showed task-related increases in calcium (Ca2+) activity in the EPM (representative heatmap of PL SST neuron Ca2+ dynamics as a function of location in the EPM in Figure 3E; sample photometric recording of GCaMP6f:TdTomato, indicated as G:T, fluorescence during EPM exploration in Figure 3F; gray bars denote periods of open arm exploration). On average, SST neuron activity was higher in the open versus closed arms (Figure 3G). This heightened open-arm-related activity gradually diminished across the 10-min EPM test (Figure 3H). In addition, SST neuron activity was dynamically altered around arm transitions in the EPM. SST neuron activity was generally elevated in the 10 s around both transitions from the center of the maze to the open arms and from the center to the closed arms (Figure 3I). SST neuron activity was consistently elevated across transitions from the center to the open arms, with the greatest activity 3–5 s after the transition (Figure 3I). In contrast, during transitions from the center to the closed arms, SST neuron activity peaked more discretely in the 2 s following transitions (Figure 3I). In line with these findings, SST neuron activity dynamics differed significantly between the two transition types. While SST neuronal activity aligned with speed during closed arm transitions, this relationship was not present during open arm transitions (Figures 3J and S6).
Task-relevant activity of SST neurons was also seen in the OFT (representative heatmap of PL SST Ca2+ dynamics as a function of location in the OFT in Figure 3K, and sample photometric recording of G:T fluorescence during OFT in Figure 3L; gray bars denote periods of center zone exploration). Similar to recordings during the EPM, average SST neuron activity was higher during exploration of the center of the OF relative to the surround zone (Figure 3M). Unlike the EPM, heightened center-zone-related activity progressively developed over the 30-min OFT (Figure 3N). SST neuron activity was dynamically altered around zone transitions in the OFT. SST neuron activity was generally elevated in the 10 s around transitions from the surround to the center and from the center to surround (Figure 3O). SST neuron activity gradually increased following transitions from the surround to the center zone (Figure 3O). In contrast, SST neuron activity was particularly high immediately preceding and following transitions from the center to the surround zone (Figure 3O). Consistent with these results, SST neuron activity dynamics differed significantly between the two transition types. SST neuron activity during both transition types aligned comparably to mouse speed during transitions (Figure 3P). Together, these experiments highlight that SST neurons are engaged during PFC-dependent exploratory behaviors.
Administration of the SSTR agonist octreotide reveals task- and sex-specific effects on exploratory behavior
To assess causal effects of SST peptide signaling in the PL cortex during these same exploratory behaviors, the SSTR agonist octreotide or aCSF control was administered directly to the PL cortex 10 min prior to the OFT or EPM via bilateral cannulas (histology from mice receiving octreotide or aCSF in Figure 4A). Due to the paucity of literature on SST peptidergic effects on cortically governed behaviors, males and females were analyzed separately.
Figure 4. The SSTR-targeting compound octreotide in PL decreases avoidance behavior in the EPM, while the SSTR antagonist cyclo-SST has no effect.

(A) Representative histology and heatmaps for octreotide behavior. The open arms are oriented vertically, and closed arms are oriented horizontally for all EPM heatmaps.
(B) Total entries into both open and closed EPM arms (two-way ANOVA; Fsex(1,26) = 0.4680, p = 0.5000; Fdrug(1,26) = 0.3289, p = 0.5712, Fsex × drug (1,26) = 0.5580, p = 0.4618, significant post-hoc Tukey’s are indicated on figure).
(C) Number of entries into the open arm as a percentage of all entries (two-way ANOVA; Fsex(1,26) = 0.06454, p = 0.8015; Fdrug(1,26) = 0.2855, p = 0.5976, Fsex × drug (1,26) = 1.598, p = 0.2174; significant post-hoc Tukey’s are indicated on figure).
(D) Number of head dip extensions beyond the bounds of the open arm. Octreotide significantly increased the number of head dips in males relative to all other groups (two-way ANOVA; Fsex(1,26) = 5.917, p = 0.0222; Fdrug(1,26) = 3.264, p = 0.0824, Fsex × drug (1,26) = 5.614, p = 0.0255; significant post-hoc Tukey’s are indicated on figure).
(E) Percent time spent in the open arm with respect to total trial time. Octreotide significantly increased the percent of time spent in the open arm for males relative to control (two-way ANOVA; Fsex(1,26) = 0.6452, p = 0.4291; Fdrug(1,26) = 3.462, p = 0.0741, Fsex × drug (1,26) = 7.868, p = 0.0094; significant post-hoc Tukey’s are indicated on figure).
(F) Percent time spent in the closed arm with respect to total trial time. Male mice treated with octreotide significantly decreased the percent of time spent in the closed arm with respect to total trial time. Two-way ANOVA; Fsex(1,26) = 0.1647, p = 0.6882; Fdrug(1,26) = 2.868, p = 0.1023, Fsex × drug (1,26) = 10.75, p = 0.0030; significant post-hoc Tukey’s are indicated on figure).
(G) Percent time spent in the center zone of the EPM with respect to total trial time (two-way ANOVA; Fsex(1,26) = 0.2568, p = 0.6166; Fdrug(1,26) = 0.1419, p = 0.7095, Fsex × drug (1,26) = 3.117, p = 0.0892; significant post-hoc Tukey’s are indicated on figure).
(H) Total displacement for mice during the OFT (two-way ANOVA; Fsex(1,28) = 1.054, p = 0.3134; Fdrug(1,28) = 0.5550, p = 0.4625, Fsex × drug (1,28) = 1.855, p = 0.1840).
(I) Percent time spent in the center zone of the OFT with respect to total trial time (two-way ANOVA; Fsex(1,28) = 0.4335, p = 0.5147; Fdrug(1,28) = 2.426, p = 0.1306, Fsex × drug (1,28) = 0.02013, p = 0.8882).
(J) Total combined displacement tracked in 5-min intervals throughout the OFT (three-way ANOVA; Ftime(3.716, 104.0) = 67.10, p < 0.0001, Fsex(1, 28) = 1.054, p = 0.3134, Fdrug(1, 28) = 0.5550, p = 0.4625, Ftime × sex(5, 140) = 2.638, p = 0.0260, Ftime × drug(5, 140) = 0.7609, p = 0.5795, Fsex × drug(1, 28) = 1.855, p = 0.1840, Ftime × sex × drug(5, 140) = 0.4731, p = 0.7959).
(K) Representative histology and heatmaps for cyclosomatostatin behavior. The open arms are oriented vertically, and closed arms are oriented horizontally for all EPM heatmaps.
(L) Total entries into both open and closed EPM arms (two-way ANOVA; Fsex(1,45) = 0.01162, p = 0.9146; Fdrug(1,45) = 0.3.727, p = 0.0598, Fsex × drug(1,45) = 0.2008, p = 0.6562; significant post-hoc Tukey’s are indicated on figure).
(M) Number of entries into the open arm as a percentage of all entries (two-way ANOVA; Fsex(1,45) = 1.353, p = 0.2509; Fdrug(1,45) = 1.974, p = 0.1668, Fsex × drug (1,45) = 1.410e-005, p = 0.9970; significant post-hoc Tukey’s are indicated on figure).
(N) Number of head dip extensions beyond the bounds of the open arm (two-way ANOVA; Fsex(1,45) = 2.414, p = 0.1273; Fdrug(1,45) = 0.1363, p = 0.7137, Fsex × drug (1,45) = 0.002505, p = 0.9603; significant post-hoc Tukey’s are indicated on figure).
(O) Percent time spent in the open arm with respect to total trial time (two-way ANOVA; Fsex(1,45) = 1.877, p = 0.1775; Fdrug(1,45) = 0.0005470, p = 0.9814, Fsex × drug (1,45) = 0.6088, p =0.4393; significant post-hoc Tukey’s are indicated on figure).
(P) Percent time spent in the closed arm with respect to total trial time (two-way ANOVA; Fsex(1,45) = 0.8560, p = 0.3598; Fdrug(1,45) = 0.03603, p = 0.8503, Fsex × drug(1,45) = 0.0009172, p = 0.9760; significant post-hoc Tukey’s are indicated on figure).
(Q) Percent time spent in the center zone of the EPM with respect to total trial time (two-way ANOVA; Fsex(1,45) = 0.5035, p = 0.4816; Fdrug(1,45) = 0.1820, p = 0.6717, Fsex × drug (1,45) = 2.567, p = 0.1161; significant post-hoc Tukey’s are indicated on figure).
(R) Total displacement for mice during the OFT (two-way ANOVA; Fsex(1,47) = 3.300, p = 0.0757; Fdrug(1,47) = 0.7976, p = 0.3764, Fsex × drug(1,47) = 0.4138, p = 0.5232).
(S) Percent time spent in the center zone of the OFT with respect to total trial time (two-way ANOVA; Fsex(1,47) = 1.773, p = 0.1894; Fdrug(1,47) = 0.9509, p = 0.3345, Fsex × drug(1,47) = 0.08929, p = 0.7664).
(T) Total combined displacement tracked in 5-min intervals throughout the OFT (three-way ANOVA; Ftime(5,235) = 80.45, p < 0.0001, Fsex(1,47) = 3.300, p = 0.0757, Fdrug(1,47) = 0.7976, p = 0.3764, Ftime × sex(5,235) = 0.9541, p = 0.4468, Ftime × drug(5,235) = 3.201, p = 0.0082, Fsex × drug(1,47) = 0.4138, p = 0.5232, Ftime × sex × drug(5,235) = 0.8377, p = 0.5241). For (B)–(G), n = 30 (8 male control, 8 male octreotide, and 7 female control, 7 female octreotide) mice; for (H)–(J), n = 32 (8 male control, 8 male octreotide, and 7 female control, 9 female octreotide) mice. For (L)–(Q), n = 49 (12 male control, 12 male cyclosomatostatin, and 12 female control, 13 female cyclosomatostatin) mice; for (R)–(T), n = 51 (14 male control, 13 male cyclosomatostatin, and 11 female control, 13 female cyclosomatostatin) mice. Data are expressed as means ± SEM and considered significant if p < 0.05.
Local administration of the SSTR-targeting compound octreotide (0.001 μg/300 nL/hemisphere) in the PL cortex had no effect on total arm entries or percent open arm entries (representative heatmaps in Figures 4A–4C). Octreotide-treated male mice, but not female mice, showed a significant increase in the number of head dips over the open arm of the EPM (Figure 4D). There was also a significant interaction between drug and sex for percent time in the open and closed arms (Figures 4E and 4F), with a significant increase and decrease, respectively, seen only in male mice treated with octreotide relative to control. There was also no significant effect of octreotide administration on the percent of time spent in the center of the EPM (Figure 4F). This suggests that administration of an SSTR agonist alters exploratory behavior in a novel context in male, but not female, mice.
Octreotide administered into PL cortex had no effect on the overall distance traveled in the OFT (representative heatmaps in Figure 4A; distance traveled in Figure 4H), further suggesting the changes seen in the EPM were not due to alterations in gross motor behavior. In addition, octreotide did not alter the percent time in the center in either sex (Figure 4I). Octreotide did not significantly alter displacement when time was binned by 5 min (Figure 4J). This suggests that the changes in exploratory behavior induced by octreotide were unique to the EPM and not driven by changes in general ambulatory behavior.
Administration of the SSTR antagonist cyclosomatostatin does not alter ambulatory or exploratory behavior
We next sought to determine whether we could uncover the role of endogenous SST during these same exploratory behaviors by blocking SSTRs. The pan-SSTR antagonist cyclo-SST or aCSF control was administered directly to the PL cortex 10 min prior to the OFT or EPM via bilateral cannulas similarly to the experiments conducted with octreotide (histology from mice receiving cyclo-SST or aCSF in Figure 4K). Importantly, while our slice electrophysiology experiments suggested this dose was effective at blocking SST actions, they also show that SSTR effects are non-reversible.
Local administration of the SSTR antagonist cyclo-SST (0.01 μg/300 nL/hemisphere) in the PL cortex had no effect on total arm entries or percent open arm entries in the EPM (representative heatmaps in Figures 4K–4M). There was no significant increase in the number of head dips over the open arm of the EPM (Figure 4N). There was also no significant interaction between drug and sex for percent time in the open and closed arms (Figure 4P). There was no significant effect of cyclo-SST administration on the percent of time spent in the center of the EPM (Figure 4Q). This demonstrates that administration of an SSTR antagonist has no effect on exploratory or ambulatory behavior in a novel context in male or female mice.
Cyclo-SST administered into PL cortex had no effect on the overall distance traveled in the OFT (representative heatmaps in Figure 4K; distance traveled in Figure 4R), suggesting the changes seen in the EPM were not due to alterations in gross motor behavior. In addition, cyclo-SST did not alter the percent time in the center in either sex (Figure 4S). Cyclo-SST did not significantly alter displacement when time was binned by 5 min (Figure 4T). This suggests SST signaling does not drive changes in general ambulatory behavior.
Finally, in order to confirm that the SST-like agonist octreotide has similar ex vivo effects on pyramidal neurons to SST, we performed identical whole-cell current-clamp experiments to those conducted with SST but using 3.27 μM octreotide (corresponding to the concentration used for behavior; Figure S4). Representative traces of rheobase recordings are shown in Figures S4B and S4N for females and males, respectively. Octreotide had no significant effect on RMP in females (Figure S4D); however, in males, octreotide significantly reduced RMP (Figure S4P). Octreotide significantly increased the rheobase at RMP in both females (Figure S4E) and males (Figure S4Q). Octreotide did not significantly alter the action potential threshold at RMP in females (Figure S4F); however, octreotide did significantly decrease the action potential threshold at RMP in males (Figure S4R). Octreotide significantly increased the rheobase at −70 mV in females (Figure S4G); however, there was no significant change in the rheobase at −70 mV in males (Figure S4S). Octreotide did not significantly change the action potential threshold at −70 mV in females (Figure S4H) or males (Figure S4T). Octreotide significantly decreased the number of action potentials fired in the VI plot at both RMP and −70 mV in both females (Figures S4J and S4L) and males (Figures S4V and S4X). Collectively these data confirm that octreotide has similar effects to SST in hyperpolarizing and reducing the excitability of pyramidal neurons.
DISCUSSION
Here, we provide evidence that SST peptide signaling in the PL cortex acts to broadly dampen cortical circuits in both male and female mice using both exogenous electrophysiological models and optogenetically evoked endogenous release, that SST neurons are preferentially activated when mice explore the open arms of the EPM and the central zone of the OFT, and during transitions between these zones, and that the pro-exploratory effects of intra-PL SSTR agonist administration aligned with some of the SST neuron activity dynamics recorded with fiber photometry. Collectively, these data suggest that SST and SSTR-targeting compounds alter behavior through inhibition of PL pyramidal neuron outputs and support the need for further investigation teasing apart peptidergic and neurotransmitter actions in these circuits and behaviors.
SST signaling dampens PL cortical output circuits
This work demonstrates that SST reduces membrane potential and intrinsic excitability of both glutamatergic (pyramidal) projection populations and GABAergic local microcircuits in the PL cortex (Figures 1 and 2). We found that SST in the PL cortex acts via activation of SSTRs (Figure S1) to modulate activity of output pyramidal neurons through monosynaptic and polysynaptic mechanisms (Figures 1 and 2). While pyramidal neurons broadly hyperpolarized in response to SST, when network activity was not blocked, the response was variable (Figure 1). When network activity was blocked, all pyramidal neurons hyperpolarized in response to SST (Figure 1). This depolarization was therefore likely due to polysynaptic mechanisms (e.g., polysynaptic GABA neuron-mediated disinhibition of pyramidal neurons). Further, SST-induced hyperpolarization occurs independent of synaptic activity (Figure 1), suggesting SST acts to hyperpolarize pyramidal neurons directly and likely postsynaptically. While GABAergic neurons also broadly hyperpolarized in response to SST (Figure 2), there were some differences observed between pyramidal and GABAergic neurons in their response to SST, which may be due to differences in effects on voltage-gated channels.
To provide insight into the effect of endogenous SST released from SST cells in the PL, we measured the effect of optogenetically evoked SST release on pyramidal cell membrane potential in the PL (Figure 1). Optogenetic activation of SST cells led to a comparable split in hyperpolarization and depolarization as seen with bath application when network activity is maintained, suggesting optogenetic stimulation of SST neurons leads to comparable endogenous SST release and network-driven effects as that seen with exogenous bath application. Interestingly, in the presence of the antagonist cyclo-SST, all hyperpolarization was blocked, but we observed depolarization in a large subset of cells. This suggests co-release of another neuropeptide by SST neurons, with the literature pointing to many viable candidates. SST-mediated hyperpolarization was not reversed by an SSTR antagonist (Figure S2). The long-lasting effect of SST13 and the non-reversible nature24 are consistent with the reported actions of other neuropeptides (e.g., dynorphin24). Moreover, previous work indicates rapid agonist-induced internalization of some subsets of SSTRs.25 Therefore, it is likely that some SSTRs are internalized after SST administration, limiting antagonist binding.
Studies have indicated an overall inhibitory role for SST-mediated neuromodulation. SST can inhibit the release of growth hormones from the pituitary,26 reduce glutamate and GABA transmission onto forebrain cholinergic neurons,27 and inhibit GABA transmission in both the thalamus28 and striatum.29 SST has been shown to hyperpolarize hippocampal pyramidal cells in vitro.30 However, SST may also have an excitatory response at higher concentrations.31 SST also reduces excitability in cortical pyramidal neurons in the developing brain.23 The precise effect of SST likely depends on various factors, such as the brain region and cell type probed, the relative expression of SSTRs 1–5, subject age, and the concentration of SST.
Previous work from our group demonstrated that SST peptide is released in PL cortex when SST neurons are optogenetically stimulated at 10 Hz,22 suggesting that changes in SST neuronal firing rates at relatively low frequencies may correspond to alterations in SST release. Recent rodent studies have implicated PL SST neurons as mediators of various behaviors.16,17,32 The neuromodulatory role of SST in the PL presented in the current study suggests that these prior studies should be interpreted as having potential effects on both GABAergic and peptidergic mechanisms. Moreover, reductions in the number of SST neurons observed following chronic stress33 and changes in GABAergic populations in patients with neuropsychiatric diseases2 are likely to result in altered SST neuromodulation alongside altered GABAergic function. Such changes in SST modulation may contribute to dysregulation of PL cortical neurons and outputs and ultimately be causal to some disease-relevant behaviors.34–37
SST neurons in PL are active during exploratory behavior, and SST peptide administration into PL similarly alters exploration
Our photometry recordings reveal that SST neurons are preferentially activated during exploration of the open versus closed arms of the EPM and the center versus surround zones of the OF (Figure 3). SST neurons have been previously implicated in exploratory behavior as manipulation of SST neuron activity during the EPM influences open arm behavior.34 The general increase in SST neuron activity in the open arms of the EPM also corroborates prior work.35 Notably, SST activity did not consistently correlate with speed, showing a relationship in the EPM only during transitions to the open arm. Our recordings further reveal that SST neuron activity aligns with discrete transitions, most notably from center-to-closed arms of the EPM and from center-to-surround zones in the OF. Our causal evidence that SSTR signaling in PL cortex promotes EPM open arm exploration aligns well with the heightened activation of PL SST neurons in the open arms of the maze. Heightened activity of SST neurons suggests increased SST release. The release of SST requires repetitive action potentials as SST is stored in dense-core vesicles residing away from the active zone.16 While in vivo photometry strategies covered a broad portion of the PFC, and SST Ca2+ dynamics do not directly indicate SST peptide release, this alignment, and our prior reports of SST release in response to sustained low-frequency SST neuron activity,22 suggests that SST peptide may be released during more sustained periods of open arm exploration. SST may serve as a pro-exploration signal, similar to prior suggestions that SST acts as a “pro-resiliency” peptide.2,17 In contrast, SST neuron activation that aligns with rapid transitions from the open arms of the maze may reflect activity that preferentially signals through GABAergic transmission over peptidergic modulation. Our future work will test this hypothesized dichotomy by using, among other approaches, in vivo recordings of emerging fluorescent SST sensors.
Importantly, while the fiber photometry experiments did not detect any sex-dependent relationship between SST neuron signaling and exploratory behavior, peptide-induced changes in behavior were only identified in male mice. Increased exploratory behavior after infusion of somatostatin receptor 2 agonists in the hippocampus has been previously reported.36 Additional studies have suggested behavioral effects of SST following intra-cerebroventricular infusion37,38 and intra-septal and intra-amygdalar infusion.39 However, critically, these studies were done exclusively in males and provided little mechanistic insight. Differences observed in males and females may be due to numerous factors, including potential differences in SSTR density and/or relative prevalence of SSTR subtypes.40 For example, SSTR density is higher in the human brain of males compared to females, which may account for the observed effect in males but not females.40 SSTR density is also higher in the male rat arcuate nucleus and pituitary.41
Potential pharmacological mechanisms of SST-mediated hyperpolarization
SSTRs are Gi/o protein coupled and inhibit adenylyl cyclase, resulting in decreased intracellular cyclic AMP and intracellular Ca2+.42 SSTRs can modulate different signal transduction cascades including mitogen-activated protein kinase leading to a multitude of cellular consequences.42 Prolonged exposure to SST can alter gene expression.43 One downstream mechanism of action following SSTR activation is activation of G protein-coupled inwardly rectifying potassium (GIRK) channels.23,44,45 This mechanism likely accounts for some of the hyperpolarization observed in electrophysiological recordings (anatomically confined to layer 2/3) in Figures 1 and 2. SST can also interact synergistically with neurotransmitter systems such as the dopaminergic system to enhance GIRK activation.46 Importantly, because there are five known SSTRs, it will be important for future work to tease apart SST effects on a receptor-by-receptor basis. It is also possible that SST modulates neurotransmitter signaling (e.g., increase GABA release or modulating GABAB receptors47) as well as interacting with other neuropeptides (e.g., dynorphin or CRF).48 Moreover, SST can act both pre- and post-synaptically and has also been shown to modulate neurotransmitter release through both loci.16 The specific effect and extent of SST-induced hyperpolarization and decreased excitability is therefore likely to be extremely cell and circuit specific.
Limitations of the study
Here, our work provides a comprehensive characterization of SST signaling within the PL cortex, with levels of investigation including ex vivo mechanism, in vivo neuronal activity, and in vivo behavioral pharmacology. Our current work did not explore a broad dose range of the SSTR antagonist cyclo-SST. While the concentration chosen was sufficient to block SST-mediated effects in slice electrophysiology experiments, additional studies should be conducted to explore doses in vivo—where effects may be uncovered at higher concentrations. Furthermore, future work will explore SSTR subtype expression and density in the PL cortex in male and female mice and whether biased ligands may provide differing effects. Future work should make use of emerging technologies (such as optical biosensors, discussed above) to further validate the physiological relevance of this system, as well as probe output-specific effects and a greater variety of ethologically relevant behaviors.
STAR★METHODS
RESOURCE AVAILABILITY
Lead contact
Further information and requests for resources and reagents should be directed to and will be fulfilled by the Lead Contact, Nicole Crowley (nzc27@psu.edu).
Materials availability
This study did not generate new unique reagents.
Data and code availability
Original data will be made available upon request directed to the lead contact, Nicole Crowley (nzc27@psu.edu).
All original code has been deposited on Dryad and is publicly available as of the date of publication (Dryad: https://doi.org/10.5061/dryad.mgqnk993f). DOIs are listed in the key resources table.
Any additional information required to reanalyze the data reported in this paper is available from the lead contact upon request.
KEY RESOURCES TABLE.
| REAGENT or RESOURCE | SOURCE | IDENTIFIER |
|---|---|---|
|
| ||
| Bacterial and virus strains | ||
|
| ||
| AAV9.Ef1a.fDIO.GCaMP6f | (Menegas et al.)49 | Addgene #118273 |
| AAV9.CAG.FLEX.TdTomato | (Oh et al.)50 | Addgene #51503 |
| AAV5-EF1a-DIO-hChR2(H134R)-eYFP-WPRE-HGHpA | Karl Deisseroth | Addgene #20298 |
|
| ||
| Chemicals, peptides, and recombinant proteins | ||
|
| ||
| Picrotoxin | Hello Bio | HB0506 |
| CGP 55845 | Tocris | 1248 |
| SST 14 | Bachem | H-1490 |
| Cyclosomatostatin (cyclo-SST) | Abcam | ab141211 |
| Octreotide Acetate | Sigma Aldrich | PHR 1880 |
| Tetrodotoxin (TTX) | Abcam | ab120054 |
| 2,2,2-Tribromoethanol (Avertin) | Thermo Fisher Scientific | A18706.14 |
| Isoflurane | Piramal Pharma Limited | NDC: 66794–013-25 |
| Ketoprofen (100 mg/ml injectable solution) | Manufacturer: Zoetis Supplier: Midwest Veterinary Supply |
275.22120.3 |
| Bupivacaine HCl | Manufacturer: Hospira Supplier: Midwest Veterinary Supply | 191.26505.3 |
| 4% Paraformaldehyde | Thermo Fisher Scientific | J19943.K2 |
| Kynurenic acid | Sigma | K3376 |
| Immu-Mount | Thermo Fisher Scientific | 9990402 |
| DAPI Fluoromount-G | Southern Biotech | 0100–20 |
|
| ||
| Deposited data | ||
|
| ||
| Code and Data | This study | Dryad:https://datadryad.org/stash/share/ouwbAlBUHoEafVxikaupvUOuhSn3wUHZYc096IYwM2c |
|
| ||
| Experimental models: Organisms/strains | ||
|
| ||
| C57BL/6J | Jackson Labs | #000664 |
| SST-IRES-Cre+/- | Jackson Labs | #013044 |
| VIP::Cre | Jackson Labs | #010908 |
| SST::Flp | Jackson Labs | #028579 |
| Df(16)A+/- | (Stark et al.)51 | N/A |
|
| ||
| Software and algorithms | ||
|
| ||
| Clampex (Clampfit and pClamp 11) | Molecular Devices | https://www.moleculardevices.com/ |
| Biorender | Biorender | https://www.biorender.com/ |
| Prism | Graphpad | https://www.graphpad.com/ |
| MATLAB | The Math Works, Inc. | https://www.mathworks.com/products/matlab.html |
| Python | (Van Rossum)52 | N/A |
| Deep Lab Cut | (Mathis et al.)53 | https://github.com/DeepLabCut/DeepLabCut |
|
| ||
| Other | ||
|
| ||
| Vibrating Microtome VF-300–0Z | Precisionary Instruments | N/A |
| Leica Vibratome VS. 1200 | Leica | N/A |
| 7000 smz2 Vibratome | Campden Instruments | N/A |
| Narishige PC-100 Puller | Narishige Group | N/A |
| Borosilicate Glass Capillaries | Warner Instruments | 64–0772 |
| 470-nm LED pE-100 | Cool LED | pE-100 |
| Contemporary Ortho-Jet Powder (Bilateral Cannula) | Lang Dental | Ref. 1530 |
| Ortho-Jet Liquid (Bilateral Cannula) | Lang Dental | Ref. 1304 |
| Dental Cement (Fiber Photometry) | Unifast Trad | N/A |
| Vetbond | 3M | 1469Sb |
| ICV Bilateral Internal Cannula | P1 Technologies | 8IC235ISPCXC |
| ICV Bilateral Guide Cannula | P1 Technologies | 8IC235G10XXC |
| ICV Bilateral Dummy Cannula | P1 Technologies | 8IC235DCSPCC |
| Bilateral Cannula Dust Cap | P1 Technologies | 8K0000303DC1 |
| Stereotaxic frame (Bilateral Cannula/ Optogenetic Release): Drill and Microinjector Robot, Mouse/Rat | Stoelting | SKU: 51705 |
| Stereotaxic frame (Fiber Photometry) | Kopf Instruments | Model 942 |
| 1 μL Neuros syringe | Hamilton | 65458–01 |
| 5 μL Removable Needle Syringe | Hamilton | #7634–01 |
| Syringe Pump | Stoelting | #53311 |
| miniature screws | Antrin Miniature Specialities | AMS90/1B |
| Fiber Optic Cannula (200 μm core, 0.39 NA) | ThorLabs | CFMC12L05 |
| 473-nm Laser | Ready Lasers | MBL-III-473–100mW |
| Noise Eeater | ThorLabs | NEL01 |
| Kinematic Flourescence Filter Cube | ThorLabs | DFM1 |
| Dual-Edge Dichoric Mirror | Chroma | ZT488/561rpc |
| FC/PC Fiber Coupler | Thorlabs | PAF2-A4A |
| Fiber Patchcord (200 μm core, 0.39 NA) | ThorLabs | M72L05 |
| Fiberoptic Rotary Joint | Doric Lenses | FRJ_1×1_FC-FC |
| Mating Sleeve | Precision Fiber Products | SM-CS1140S |
| Dual-band Emission Filter | Chroma | ZET488/561m |
| Fiber Coupler | ThorLabs | PAF2S-11A |
| Anti-reflection-coated Fiber | ThorLabs | M200L02S-A |
| Spectrometer | Ocean Insight | QE Pro |
| BX63 Upright Microscope | Olympus | N/A |
| CMS GmbH CMOS fitted Microscope | Leica Microsystems | N/A |
| LSM 800 Confocal Microscope | Zeiss | N/A |
| Waveform Generator | Sanworks | Pulse Pal v2 |
| Blackfly S USB3 Camera | FLIR | N/A |
EXPERIMENTAL MODEL AND STUDY PARTICIPANT DETAILS
Animals
All animal procedures were performed in accordance with the Institutional Animal Care and Use Committees (IACUC) at The Pennsylvania State University and The National Institute on Neurological Disorders and Stroke (NINDS), conforming to US National Institutes of Health guidelines. Adult male and female C57BL/6J mice were bred in house for electrophysiology or ordered from Jackson Labs (strain #000664, Bar Harbor, ME) for cannula experiments. For experiments involving ex vivo optogenetic activation of somatostatin cells, adult male and female SST-IRES-Cre+/− on a C57BL/6J genetic background (#013044, Jackson Laboratory) were bred in house. Adult female and male VIP::Cre;SST::Flp mice (#010908 and 028579, respectively; Jackson Laboratory; heterozygous for both recombinases) were bred in house from crossings of homozygous VIP::Cre; SST::Flp females and Df(16)A+/− males51 for the fiber photometry experiments. Df(16)A+/− male breeders were backcrossed for more than 10 generations on a C57BL/6J background. All mice used for photometry were wildtype at the Df(16)A locus (i.e., Df(16)A+/+). Mice were maintained on a 12-h light cycle (lights on at 7:00 a.m., vivarium temperature 21°C, ±1°C) for all experiments. All electrophysiology and cannula experiments were conducted at The Pennsylvania State University, and all fiber photometry experiments were conducted at the NINDS. All animals were drug naive at the start of the study and were only exposed to SST-targeting drugs as noted per experiment (either in vivo or in slice).
C57BL/6J mice
Adult (older than 56 days) male and female C57BL/6J mice were bred in house for electrophysiology or ordered from Jackson Labs (strain #000664, Bar Harbor, ME) for cannula experiments.
SST-IRES-Cre+/− mice
For experiments involving ex vivo optogenetic activation of somatostatin cells, male and female SST-IRES-Cre+/− on a C57BL/6J genetic background (#013044, Jackson Laboratory) were bred in house.
VIP::Cre; SST::Flp mice
Female and male VIP::Cre;SST::Flp mice (#010908 and 028579, respectively; Jackson Laboratory; heterozygous for both recombinases) were bred in house from crossings of homozygous VIP::Cre; SST::Flp females and Df(16)A+/− males23 for the fiber photometry experiments. Df(16)A+/− male breeders were backcrossed for more than 10 generations on a C57BL/6J background. All mice used for photometry were wildtype at the Df(16)A locus (i.e., Df(16)A+/+).
METHOD DETAILS
Electrophysiology
Mice were deeply anesthetized via inhaled isoflurane (5% in oxygen, v/v) and rapidly decapitated. Brains were quickly removed and processed according to the N-methyl-D-glucamine (NMDG) protective recovery method.54 Brains were immediately placed in ice-cold oxygenated NMDG-HEPES artificial cerebrospinal fluid (aCSF) containing the following, in mM: 92 NMDG, 2.5 KCl, 1.25 NaH2PO4, 30 NaHCO3, 20 HEPES, 25 glucose, 2 thiourea, 5 Na-ascorbate, 3 Na-pyruvate, 0.5 CaCl2$2H2O, and 10 MgSO4$7H2O (pH to 7.3–7.4). The PL was identified according to the Allen Mouse Brain Atlas. 300-μm coronal slices containing the PL were prepared on a Compresstome Vibrating Microtome VF-300–0Z (Precisionary Instruments, Greenville, NC), and transferred to heated (31°C) NMDG-HEPES (in mM: 124 NaCl, 4.4 KCl, 2 CaCl2, 1.2 MgSO4, 1 NaH2PO4, 10.0 glucose, and 26.0 NaHCO3, pH 7.4, mOsm 300–310), for a maximum of 10 min. Slices were then transferred to heated (31°C) oxygenated normal aCSF where they were allowed to rest for at least 1 h before use. Finally, slices were moved to a submerged recording chamber where they were continuously perfused with the recording aCSF (2 mL per min flow rate, 31°C). Recording electrodes (3–6 MΩ) were pulled from thin-walled borosilicate glass capillaries with a Narishige PC-100 Puller. Drugs were included in the aCSF as described below per experiment. Experiments were conducted blinded to condition and sex, mice were randomized between groups and experiment day, and experiments replicated wherever possible. Results were validated between electrophysiologists.
Pyramidal and GABAergic neurons in layer 2/3 of the PL cortex were identified by location from midline, morphology (prominent triangular soma and apical dendrites for pyramidal neurons), and membrane characteristics, consistent with previously published electrophysiology in PL cortex layer 2/3 pyramidal neurons.3,4,55 Pyramidal and non-pyramidal neurons were further confirmed by membrane properties and action potential width as appropriate.3
All experiments used a potassium-gluconate (KGluc)-based intracellular recording solution, containing the following (in mM): 135 K-Gluc, 5 NaCl, 2 MgCl2, 10 HEPES, 0.6 EGTA, 4 Na2ATP, and 0.4 Na2GTP (287–290 mOsm, pH 7.35). Following rupture of the cell membrane, cells were held in current-clamp. A minimum of 5 min stable baseline was acquired prior to experiments and bath application of drugs. Measurements of intrinsic excitability were conducted at both resting membrane potential (RMP) and at the standard holding potential of −70 mV both before and after application of drugs. Gap-free RMP was recorded during the entire drug application period. Measurements of intrinsic excitability included the RMP, rheobase (the minimum amount of current needed to elicit an action potential during a current ramp protocol), action potential threshold (the membrane potential at which the first action potential fired during the current ramp), and the number of action potentials fired during a voltage-current plot protocol (VI plot). Rheobase and VI protocols were conducted consistent with previously published methods from our lab.56 The rheobase protocol consisted of 4 sequential ramps, each injecting 120 pA of current, and each subsequent ramp stepping by 100 pA. Ramps lasted 1000 ms, and the protocol was stopped after the ramp during which the cell fired an action potential. The VI protocol consisted of increasing steps of depolarizing currents (0–200 pA, increasing by 10 pA per step, each step lasting 300 ms) with hyperpolarizing currents included as a negative control. Some experiments were conducted in tetrodotoxin (500 nM) as noted to isolate monosynaptic activity. For all experiments where drugs were added to the aCSF, slices were perfused with drug as indicated per experiment, and slices were discarded after each experiment. Input resistance was monitored intermittently throughout each experiment, and when it deviated by more than 20% the experiment was discarded.
For optogenetic activation of SST cells with simultaneous electrophysiological recording of pyramidal cells in layer 2/3 of the PL cortex, slices were kept shielded from light, and experiments performed under low illumination. 25 μM Picrotoxin (Hello Bio, HB0506), and 1 μM CGP 55845 (Tocris, 1248) were added to the aCSF to block GABAergic signaling. A separate set of experiments were conducted with the addition of 1 μM cylcosomatostatin (cyclo-SST) in the aCSF along with GABA receptor antagonists. Cells were held in current-clamp and membrane potential (mV) was measured. Following establishment of a 5 min stable baseline, a 470-nm LED (CoolLED, United Kingdom) was directed to the slice for 10 min (10 Hz frequency). The membrane potential was recorded for an additional 5 min following stimulation. The perfusion pump was stopped before the start of the baseline file and remained off for the duration of the experiment to preserve released SST in the bath. SST cells in the PL were patched following the completion of a stimulation experiment and were stimulated at 10 Hz while recording membrane potential to ensure robust expression of ChR2. Following experiments, slices were immersed in 4% paraformaldehyde for 1 h, mounted on slides, coverslipped, and representative images of viral injection obtained on an epifluorescent microscope.
Stereotaxic surgeries for cannula implantation
Custom bilateral cannulas targeted at the PL cortex were purchased from P1 Technologies (Roanoke, VA). Mice were deeply anesthetized with isoflurane (5% induction, 1–2% maintenance) and mounted on a stereotaxic frame (Stoelting, Wood Dale, IL). Following craniotomy, drill holes were targeted at the PL cortex (from bregma: AP +1.8 mm, ML +/− 0.5 mm). Two additional drill holes were placed posterior to the injection site for bone screws. The guide cannula was lowered to the injection site for a final depth of −1.60 mm. Dental cement was used to secure the guide cannula, a dummy cannula was inserted, and Vetbond used for any additional scalp closure. Mice were allowed to recover, single housed, for a minimum of one week prior to behavioral testing. Placements of cannulas for all mice were verified by histology at the conclusion of the experiments.
Stereotaxic surgeries for fiber photometry
Adeno-associated virus (AAV) encoding Flp-dependent GCaMP6f (AAV9.Ef1a.fDIO.GCaMP6f) was packaged by Vector Biolabs using a plasmid from Addgene (#118273). AAV encoding Cre-dependent TdTomato (AAV9.CAG.FLEX.TdTomato) was purchased from Addgene (#51503). Titers of the GCaMP6f and TdTomato viruses were 1×10¹² and 1.9 × 10¹³ GC/mL, respectively, and were combined 10:1 (GCaMP:TdTomato) immediately prior to injection. All stereotaxic viral injections were conducted using aseptic surgical technique. Mice aged 12–16 weeks were deeply anesthetized with 5% isoflurane in oxygen (v/v) and secured in a stereotaxic frame (Kopf Instruments, Germany). Sedation was maintained using 1%–2% isoflurane during surgery. A midline incision was made on the scalp and two miniature screws (Antrin Miniature Specialities, Inc.) were secured to the skull. A craniotomy was performed above the left PL cortex according to the coordinates (in mm) +1.95 A/P (from bregma), −0.4 M/L (from bregma), −1.5 (from dura). The combined viruses were microinjected from pulled glass capillaries (using PC-100, Narishige) using a syringe (#7634–01, Hamilton) and syringe pump (#53311, Stoelting) with a volume of 500 nL and a rate of 100 nL/min. After infusion, the needle was left in place for 10 min to allow the virus to diffuse before the needle was slowly withdrawn. A fiber optic cannula (200μm core, 0.39 NA; CFMC12L05, ThorLabs) was implanted into the same craniotomy, with the coordinates (in mm) +1.95 A/P (from bregma), −0.4 M/L (from bregma), −1.0 (from dura). Dental cement (Unifast Trad) was used to adhere the ferrule/fiber to the skull. Tissue was secured to the dental cement with VetBond adhesive (1469Sb, 3M). Ketoprofen (5 mg/kg, SQ) was provided 30-min prior to the end of surgery for postoperative analgesia. Following surgery, mice were returned to group housing for 5–7 weeks prior to behavioral testing and photometric recording.
Stereotaxic surgeries for optogenetic activation of SST cells
The viral construct AAV5-EF1a-DIO-hChR2(H134R)-eYFP-WPRE-HGHpA (Titer = 2.1 × 10¹³ GC/mL) was obtained from Addgene (#20298). Male and female SST-IRES-Cre+/− mice at least 8 weeks old were deeply anesthetized with 5% isoflurane and underwent stereotaxic surgery. Following craniotomy, mice were bilaterally injected using a 1 μL Neuros syringe (65458–01, Hamilton Company, Reno, NV; Stoelting) with 0.3 μL of the viral vector into the PL (AP: +1.80, ML: ±0.40, DV: −2.30) at 0.1 μL/min. The syringe was left in place for 5 min to allow for diffusion before being slowly removed. Bupivicaine (0.1mL/20g) was applied topically and ketoprofen (0.1mL/10g) intraperitoneally for postoperative analgesia. Mice were allowed to recover for a minimum of 3 weeks prior to experiments to allow for adequate viral expression. PFC slices were visualized under infrared video microscope and blue LED (470 nm) for verification of viability and eYFP expression in the PL.
In vivo fiber photometry apparatus
A custom-built spectrometer-based system (based on previously published systems57–59) was used to conduct fiber photometry recordings. Blue light from a 473-nm laser (MBL-III-473–100mW, Ready Lasers) was directed through a Noise Eater (NEL01, ThorLabs) and into a kinematic fluorescence filter cube (DFM1, ThorLabs) onto a dual-edge dichroic mirror (ZT488/561rpc, Chroma). Light was then coupled using an FC/PC fiber coupler (PAF2-A4A, ThorLabs) into a fiber patchcord (M72L05, 200-μm core, 0.39 NA, ThorLabs) connected to a fiberoptic rotary joint (FRJ_1×1_FC-FC, Doric Lenses) followed by another patchcord (200-μm core, 0.39 NA, Doric). Blue light power was approximately 80 μW at the ferrule end of the final patchcord, resulting in ~70 μW output from the surgically implanted ferrule. On each recording day, the surgically implanted ferrule was cleaned with 70% ethanol and lens paper (806, Ted Pella) and securely attached to the ferrule end of the final patchcord via a mating sleeve (SM-CS1140S, Precision Fiber Products). Fluorescence emission from the tissue was collected by the same fiber, filtered through a dual-band emission filter (ZET488/561m, Chroma), and directed using a fiber coupler (PAF2S-11A, Thorlabs) into a 200-μm core, anti-reflection-coated fiber (M200L02S-A, ThorLabs) which led to a spectrometer (Ocean Insight, QEPro). The spectrometer quantified photon counts across a ~350–1130 nm wavelength window. Spectra comprised of integrated photons captured over a 37-ms time window were sampled at a frequency of 20 Hz.
Drugs
For electrophysiology, Octreotide Acetate (Sigma Aldrich, PHR 1880) was dissolved in ddH2O at 3.27 mM, aliquoted at 100 μL, stored at −20°C, and diluted to 3.27 μM as needed. SST (Bachem, H-1490) was dissolved in ddH2O at 1 mM, aliquoted at 50 μL, stored at −20°C, and diluted to 1 μM in aCSF as needed. Cyclosomatostatin (cyclo-SST; Abcam, ab141211) was dissolved in DMSO at 1 mM, aliquoted at 100 μL, stored at −20°C, and diluted to 1 μM in aCSF as needed. Tetrodotoxin (TTX) (Abcam, ab120054) was dissolved in ddH2O at 5 mM, aliquoted at 50 μL, stored at −20°C, and diluted to 500 nM in aCSF as needed. 3 mM Kynurenic acid (Sigma, K3376), 25μM Picrotoxin (Hello Bio, HB0506), and 1μM CGP 55845 (Tocris, 1248) was added to the aCSF as needed. For behavior, Octreotide Acetate (Sigma Aldrich, PHR 1880) was dissolved in sterile aCSF at 327 μM, aliquoted at 100 μL, stored at −20°C, and diluted as needed.
Drug microinjection procedure
Drug microinjection protocols were adapted from previously published studies.60 Mice were habituated to handling and manipulation of the dummy cannula for 3 consecutive days prior to behavioral testing. Octreotide or aCSF control was injected at an infusion rate of 100 nL/min over 3 min. The infusion cannula was left in place for 2 min to allow for local diffusion of the injected solution. For behavior using administration of the SSTR-antagonist cyclo-SST, mice were habituated as described above. Similarly, cyclo-SST or aCSF control was injected at an infusion rate of 100 nL/min over 3 min and allowed to remain in place for 2 min to allow for local diffusion of the injected solution. Cyclo-SST was administered at a concentration of 0.01 μg/300nL per hemisphere.
Behavior
Identical open field test (OFT) and elevated plus maze (EPM) arenas were constructed at The Pennsylvania State University and NINDS. Behavioral experiments were conducted during the light cycle and mice were brought to the testing room and allowed to rest for at least 1 h prior to experimentation. Behavioral tests were separated by 48 h and their order was counterbalanced across mice.
For the OFT, mice were initially placed in the corner of a 50 × 50 × 20 cm arena and allowed to explore for 30 min. One mouse jumped out of the OFT and was excluded from analysis. The total distance traveled over 30 min and the time spent in the 30 × 30 cm center square were quantified. The total distance traveled was displayed both as a time course (5-min bins) and as a total value.
For the EPM test, mice were placed into the center square of an elevated (40 cm) crossbar with two open and two closed arms (30 × 5 cm), facing a closed arm (20 cm walls of Plexiglass). Mice were allowed to explore the maze for 5 min (drug cannula experiments) and 10 min (fiber photometry) and behavior was video recorded. Mice that fell off the EPM were excluded from the analysis (5 mice total). Percent time spent in the open arms, closed arms, center zone, and the percent of entries (open arm entries/total entries × 100) into the open arms were analyzed.
Behavior with fiber photometry
Behavioral testing with photometry recordings was conducted as described above. Mice were first habituated to being handled and tethered to an optical fiber in a bucket for two daily 1-h periods prior to the first OFT/EPM test day. Each test day began with 10 min of blue light administration (~70 μW) in the homecage to stabilize basal GCaMP6f fluorescence and further habituate each mouse to being tethered. A Python-controlled waveform generator (PulsePal v2, SanWorks) was used to simultaneously deliver 20-Hz TTLs to the spectrometer (to trigger spectral integration events) and camera (FLIR Blackfly S USB3; to trigger the camera shutter). Video frames generated at 20Hz were processed in Bonsai operating real-time DeepLabCut processing nodes61,62 such that each frame was assigned coordinates for the maze and mouse as it was captured. Camera shutter events (also 20Hz) were simultaneously captured as digital events in OpenEphys to facilitate subsequent alignment of photometry and positional data (see behavior data analysis).
Photometry/position data were recorded for 10 min during homecage behavior and throughout the subsequent EPM/OFT test. Recordings in both homecage and OFT/EPM were conducted in 2.5-min bins separated by 2 s. These 2-s gaps enabled brief openings of a Python-controlled clamp on the fiber optic rotary joint. The clamp prevented light artifacts due to rotary joint movement during recordings. These brief openings allowed for any accumulated patchcord tension to be released prior to reclamping and resumed recording.
Histology for cannula/fiber optic placements and viral expression
Mice were deeply anesthetized with Avertin (250 mg/kg) or isoflurane (5%) and underwent transcardial perfusion, first with ice-cold phosphate buffered saline (PBS) followed by 4% (w/v) paraformaldehyde (PFA). Following perfusion, brains were post-fixed in PFA for 24 h, transferred to PBS and sectioned at 40 μm using a Leica vibratome (VS. 1200, Leica) or at 50 μm using a Campden Instruments vibratome (7000 smz2). Sections were mounted on SuperFrost or Marienfeld UniMark glass slides, air dried, and then cover-slipped with Immu-Mount (Thermo Fisher Scientific, Waltham, MA, United States) or DAPI Fluoromount-G (Southern Biotech) mounting media. Slides were then imaged on an Olympus BX63 upright microscope (Center Valley, PA) or a Leica customized epifluorescence scope fitted with a CMS GmbH CMOS camera (Leica Microsystems). The image of representative fiber optic placement and viral expression was captured using a Zeiss LSM 800 confocal microscope. Areas containing the most damage were considered the central location of guide cannula or fiber optic placement. Damage location was then determined in reference to the Allen Mouse Brain Atlas and a 0.5–0.55 mm projection was added to the end of the damage to account for the internal cannula projection. Mice with cannula/fiber placement outside of the PL cortex were excluded from behavioral/photometry data analysis. 8 of 120 mice for cannula experiments (including mice used for initial pilot dose-response curves), and 1 of 12 mice for fiber photometry, were removed for misplaced implants.
Behavior data analysis
Behavior for both cannula drug administration and fiber photometry were tracked with DeepLabCut.53 Analysis of cannula drug administration assays was performed in MATLAB; analysis of photometry experiments was performed in Python. Experimenters were blinded to drug injection group throughout the behavioral testing and data analysis.
Cannula microinfusion behavioral analysis
Behavior for cannula drug administration was tracked with DeepLabCut (DLC; Version 2.2.1) and analyzed with custom MATLAB algorithms. For OFT and EPM, three body positions were tracked for behavior classification: the head, middle of the body (caudal to the shoulder joint), and the trunk of the tail. Behavioral recordings that consisted of separate zones included additional tracked points bounding zones of interest. For OFT, these 16 points created boundaries that outlined the edge of the arena (1 point per corner of the 50 cm × 50 cm arena), the center zone (1 point per corner of the central 30 cm × 30 cm square), and each corner (1 point per corner of the 10 cm × 10 cm corner box in the outer zone). Recordings of EPM behavior included the tracking of 12 distinct points that outlined each arm of the maze. Any points that bounded the corner of two zones were only quantified with 1 distinct point to eliminate any redundancies in analysis. Recording of all cannula drug administration behavior was performed using a camera at a frame rate of 29.97 frames per second. OFT and EPM tracking utilized transfer learning to retrain residual network (resnet101) using 9 mice and 10 mice for each behavior, respectively. Mice used for training were selected from recordings performed on separate days whenever possible. DLC model training was considered adequate when confidence in the position was >95%, with most points achieving a confidence >99%. Tracked position coordinates were exported from DLC as CSV file for MATLAB analysis when appropriate confidence levels and tracking performance were reached.
OFT distance was classified as the Euclidean distance of the middle of the mouse body between subsequent frames. Time was quantified by the number of frames a mouse was in a polygon bounded by the corners of the zone of interest. All data were then converted from units of pixels/frames to cm/s using known bounds of the arena and the frame rate of the camera. Percent time in a specific zone was quantified as the total time in the zone divided by the total testing time.
EPM distance was classified as the Euclidean distance of the middle of the mouse body between subsequent frames. Time was initially quantified by the number of frames a mouse was in a polygon bounded by the corners of the zone of interest. All data were then converted from units of pixels/frames to cm/s using known bounds of the arena and the frame rate of the camera. Percent time in a specific zone was quantified as the total time in the zone divided by the total testing time. The central zone connecting arms was classified as a ‘dead zone’ and not included as a portion of the open or closed arms. Head dips were classified as an extension of the head beyond the bounds of the open arm. Random videos were selected, and behaviors were hand scored where possible to verify both tracking and algorithm accuracy. Experimenters were blinded to injection condition throughout the behavioral analysis.
Photometry behavior analysis
Behavioral analysis for the photometry experiments was conducted using many of the same procedures and parameters as described above. In these experiments, Bonsai-DLC was used for behavioral tracking. Bonsai-DLC enabled use of a pre-trained DLC model in a Bonsai workflow to process live-streamed videoframes and generate DLC coordinates in real time. DLC models for the EPM and OFT were created by labeling 300–500 frames per test, comprised of approximately 10–20 frames from each of 20–30 videos of different mice with comparable surgeries/fiber optic tethers to the present experimental mice recorded on different days. In addition to the maze boundaries, six mouse body parts were labeled on each frame: nose, headcap, shoulder, midpoint, hind and base of the tail. The hind label was used for behavioral analysis. The model was trained for approximately 750,000–1,000,000 iterations, yielding confidence values of >99% in most cases.
A Python-controlled waveform generator (PulsePal v2, SanWorks) delivered 20-Hz TTLs to an FLIR Blackfly S USB3 camera. Each resulting frame was processed for all model-labelled body/maze parts. A confidence threshold of >95% was applied in Bonsai to the positional data. Exported data were down-sampled to 10Hz, and a Kalman Filter (pykalman.github.io) was applied to estimate position data for missing values with confidence <95%. The “opencv homography” Python function was applied to align cohorts with slight variations in camera angles. The hind position from each frame was assigned a maze zone based on the coordinates of the maze boundaries. Brief departures from an assigned zone (e.g., changes from “open_top” > “center” > “open_top”) of 3 or less frames were corrected (e.g., converted to all “open_top”) to account for noise in the detection around zone boundaries. In the OFT, the timing and number of zone transitions were then calculated based on these assigned zones. In the EPM, because transitions between arms were complicated by the intervening center zone, zone transitions were defined using two sets of criteria. In cases when changes in assigned zone occurred from one zone to another and back to the original (e.g., “open_top” > “center” > “open_top”), to be assigned a zone transition, the departure (e.g., to “center”) needed to last for a minimum of 6 frames. In cases when changes in assigned zone occurred from one zone to another to yet another (e.g., “open_top” > “center” > “closed_left”), to be assigned a zone transition, the departure (e.g., to “center”) needed to last for a minimum of 2 frames. These thresholds were implemented to prevent overcounting of re-entries into the same zone, and to accommodate counting of fast transitions between zones (e.g., rapid movement across the center from open to closed arms). Thresholds were determined by cross-referencing DLC-based assignment of transitions with manual assignment by an experimenter in several videos.
Photometry data analysis
The shape and amplitude of the spectrometer-derived fluorescence spectra were used to confirm in vivo GCaMP6f and TdTomato expression. To separate the fluorescence derived from GCaMP6f and TdTomato, all raw emission spectra were transformed using a spectral linear unmixing algorithm written in R, as described previously.57,59 The resulting unmixed GCaMP6f and TdTomato coefficients were linear regression-corrected to remove gradual reductions in signal due to fluorophore signal fading across the behavioral test. To control for movement artifacts in the fluorescence signal, the ratio of the unmixed GCaMP6f and TdTomato coefficients was calculated (GCaMP:TdTomato; G:T; as in57). The G:T timeseries was down-sampled from 20Hz to 10Hz. Z-scores of the G:T ratio were then calculated for each 10-Hz time point, using the mean and standard deviation of their corresponding 2.5-min bin of recorded data. Sample traces, their z-scored values, and the z-scored ratio are presented in Figure S5. Once aligned to positional data from DeepLabCut, G:T z-scores were then averaged across task-relevant periods (e.g., open-vs. closed arms; center vs. surround zones), or aligned to discrete transitions (e.g., center-to-open arms; center-to-surround zones). G:T z-scores were averaged across all events (bouts in an arm/zone, or transitions) within a single animal, and then reported as the average Z score across animals.
Correlational analyses were performed to compare the degree to which photometry signals recorded during open vs. closed arm entries correlate with concurrent speed of the mice across these transitions. Using GraphPad prism, 1st derivatives of the photometry and speed time series were calculated for all open and closed arm entries performed by all 11 mice. These derivative time series were averaged within mice and normalized to the peak value in a 4-s peri-transition time window. Using the 40 0.1-s timepoints in this 4-s window (corresponding to the 10 Hz photometry and speed recordings), correlations were performed for each mouse, and the correlation coefficients were then averaged to assess whether the speed-photometry correlations were stronger during open or closed arm transitions.
QUANTIFICATION AND STATISTICAL ANALYSIS
Experimenters were blinded to group designations wherever possible until analysis was completed. Data were analyzed by one-sample t-tests, unpaired t-tests, paired t-tests, 2-way ANOVAs, 3-way ANOVAs, and post-hoc tests as appropriate and indicated for each experiment. Statistics and figure preparation were conducted in Prism 9 (GraphPad, La Jolla, CA). Data are expressed as means ± SEM for all figures. Assumption of normality was checked where appropriate and results of statistical test were considered significant if p < 0.05. No statistical outliers were removed from the electrophysiology, photometry, or behavioral data. All statistical details are included in the figure legends.
Supplementary Material
Highlights.
SST peptide signaling confers broad inhibitory control in the prefrontal cortex
Optogenetic activation of SST neurons mimics pharmacological effects of SST
SST neurons display task-relevant activity during exploratory behaviors in vivo
Pharmacological administration of SST receptor targeting drugs promotes exploratory behavior
ACKNOWLEDGMENTS
This work was funded by the National Institutes of Health (R01AA209403, R21AA028088, and P50AA017823 to N.A.C.; R01NS078168 and R01NS101353 to P.J.D.; T32NS115667 Training Grant to M.S.H.) and National Institute of Neurological Disorders and Stroke Intramural Research Program (ZIA NS003168). The content of this article is solely the responsibility of the authors and does not necessarily represent the official views of the NIH. Graphical abstract created with BioRender.com.
Footnotes
DECLARATION OF INTERESTS
The authors declare no competing interests.
SUPPLEMENTAL INFORMATION
Supplemental information can be found online at https://doi.org/10.1016/j.celrep.2023.112976.
REFERENCES
- 1.Crowley NA, and Joffe ME (2022). Developing breakthrough psychiatric treatments by modulating G protein-coupled receptors on prefrontal cortex somatostatin interneurons. Neuropsychopharmacology 47, 389–390. 10.1038/S41386-021-01119-X. [DOI] [PMC free article] [PubMed] [Google Scholar]
- 2.Brockway DF, and Crowley NA (2020). Turning the ′Tides on Neuropsychiatric Diseases: The Role of Peptides in the Prefrontal Cortex. Front. Behav. Neurosci. 14, 588400. 10.3389/fnbeh.2020.588400. [DOI] [PMC free article] [PubMed] [Google Scholar]
- 3.Dao NC, Brockway DF, Suresh Nair M, Sicher AR, and Crowley NA (2021). Somatostatin neurons control an alcohol binge drinking prelimbic microcircuit in mice. Neuropsychopharmacology 46, 1906–1917. 10.1038/s41386-021-01050-1. [DOI] [PMC free article] [PubMed] [Google Scholar]
- 4.Cummings KA, and Clem RL (2020). Prefrontal somatostatin interneurons encode fear memory. Nat. Neurosci. 23, 61–74. 10.1038/s41593-019-0552-7. [DOI] [PMC free article] [PubMed] [Google Scholar]
- 5.Dao NC, Suresh Nair M, Magee SN, Moyer JB, Sendao V, Brockway DF, and Crowley NA (2020). Forced Abstinence From Alcohol Induces Sex-Specific Depression-Like Behavioral and Neural Adaptations in Somatostatin Neurons in Cortical and Amygdalar Regions. Front. Behav. Neurosci. 14, 86. 10.3389/fnbeh.2020.00086. [DOI] [PMC free article] [PubMed] [Google Scholar]
- 6.Abbas AI, Sundiang MJM, Henoch B, Morton MP, Bolkan SS, Park AJ, Harris AZ, Kellendonk C, and Gordon JA (2018). Somatostatin Interneurons Facilitate Hippocampal-Prefrontal Synchrony and Prefrontal Spatial Encoding. Neuron 100, 926–939.e3. 10.1016/j.neuron.2018.09.029. [DOI] [PMC free article] [PubMed] [Google Scholar]
- 7.Adhikari A, Topiwala MA, and Gordon JA (2010). Synchronized activity between the ventral hippocampus and the medial prefrontal cortex during anxiety. Neuron 65, 257–269. 10.1016/J.NEURON.2009.12.002. [DOI] [PMC free article] [PubMed] [Google Scholar]
- 8.Adhikari A, Topiwala MA, and Gordon JA (2011). Single units in the medial prefrontal cortex with anxiety-related firing patterns are preferentially influenced by ventral hippocampal activity. Neuron 71, 898–910. 10.1016/J.NEURON.2011.07.027. [DOI] [PMC free article] [PubMed] [Google Scholar]
- 9.Padilla-Coreano N, Bolkan SS, Pierce GM, Blackman DR, Hardin WD, Garcia-Garcia AL, Spellman TJ, and Gordon JA (2016). Direct Ventral Hippocampal-Prefrontal Input Is Required for Anxiety-Related Neural Activity and Behavior. Neuron 89, 857–866. 10.1016/J.NEURON.2016.01.011. [DOI] [PMC free article] [PubMed] [Google Scholar]
- 10.Padilla-Coreano N, Canetta S, Mikofsky RM, Alway E, Passecker J, Myroshnychenko MV, Garcia-Garcia AL, Warren R, Teboul E, Blackman DR, et al. (2019). Hippocampal-Prefrontal Theta Transmission Regulates Avoidance Behavior. Neuron 104, 601–610.e4. 10.1016/j.neuron.2019.08.006. [DOI] [PMC free article] [PubMed] [Google Scholar]
- 11.Joffe ME, Maksymetz J, Luschinger JR, Dogra S, Ferranti AS, Luessen DJ, Gallinger IM, Xiang Z, Branthwaite H, Melugin PR, et al. (2022). Acute restraint stress redirects prefrontal cortex circuit function through mGlu 5 receptor plasticity on somatostatin-expressing inter-neurons. Neuron 110, 1068–1083.e5. 10.1016/J.NEURON.2021.12.027. [DOI] [PMC free article] [PubMed] [Google Scholar]
- 12.Merighi A (2018). Costorage of high molecular weight neurotransmitters in large dense core vesicles of mammalian neurons. Front. Cell. Neurosci. 12, 272. 10.3389/FNCEL.2018.00272/BIBTEX. [DOI] [PMC free article] [PubMed] [Google Scholar]
- 13.van den Pol AN (2012). Neuropeptide Transmission in Brain Circuits. Neuron 76, 98–115. 10.1016/j.neuron.2012.09.014. [DOI] [PMC free article] [PubMed] [Google Scholar]
- 14.Kash TL, Pleil KE, Marcinkiewcz CA, Lowery-Gionta EG, Crowley N, Mazzone C, Sugam J, Hardaway JA, and McElligott ZA (2015). Neuropeptide regulation of signaling and behavior in the BNST. Mol. Cell 38, 1–13. 10.14348/molcells.2015.2261. [DOI] [PMC free article] [PubMed] [Google Scholar]
- 15.Patel YC, Greenwood MT, Warszynska A, Panetta R, and Srikant CB (1994). All five cloned human somatostatin receptors (hSSTR1–5) are functionally coupled to adenylyl cyclase. Biochem. Biophys. Res. Commun. 198, 605–612. 10.1006/bbrc.1994.1088. [DOI] [PubMed] [Google Scholar]
- 16.Liguz-Lecznar M, Urban-Ciecko J, and Kossut M (2016). Somatostatin and somatostatin-containing neurons in shaping neuronal activity and plasticity. Front. Neural Circ. 10, 48. 10.3389/fncir.2016.00048. [DOI] [PMC free article] [PubMed] [Google Scholar]
- 17.Robinson SL, and Thiele TE (2020). A role for the neuropeptide somatostatin in the neurobiology of behaviors associated with substances abuse and affective disorders. Neuropharmacology 167, 107983. 10.1016/j.neuropharm.2020.107983. [DOI] [PMC free article] [PubMed] [Google Scholar]
- 18.Fung SJ, Fillman SG, Webster MJ, and Shannon Weickert C (2014). Schizophrenia and bipolar disorder show both common and distinct changes in cortical interneuron markers. Schizophr. Res. 155, 26–30. 10.1016/j.schres.2014.02.021. [DOI] [PubMed] [Google Scholar]
- 19.Sibille E, Morris HM, Kota RS, and Lewis DA (2011). GABA-related transcripts in the dorsolateral prefrontal cortex in mood disorders. Int. J. Neuropsychopharmacol. 14, 721–734. 10.1017/S1461145710001616. [DOI] [PMC free article] [PubMed] [Google Scholar]
- 20.Hashimoto T, Bazmi HH, Mirnics K, Wu Q, Sampson AR, and Lewis DA (2008). Conserved regional patterns of GABA-related transcript expression in the neocortex of subjects with schizophrenia. Am. J. Psychiatr. 165, 479–489. 10.1176/appi.ajp.2007.07081223. [DOI] [PMC free article] [PubMed] [Google Scholar]
- 21.Ochi R, Ueno F, Sakuma M, Tani H, Tsugawa S, Graff-Guerrero A, Uchida H, Mimura M, Oshima S, Matsushita S, and Nakajima S (2022). Patterns of functional connectivity alterations induced by alcohol reflect somatostatin interneuron expression in the human cerebral cortex. Sci. Rep. 12, 7896–7899. 10.1038/s41598-022-12035-5. [DOI] [PMC free article] [PubMed] [Google Scholar]
- 22.Dao NC, Brockway DF, and Crowley NA (2019). In Vitro Optogenetic Characterization of Neuropeptide Release from Prefrontal Cortical Somatostatin Neurons. Neuroscience 419, 1–4. 10.1016/j.neuroscience.2019.08.014. [DOI] [PubMed] [Google Scholar]
- 23.Riedemann T, and Sutor B (2019). Long-lasting actions of somatostatin on pyramidal cell excitability in the mouse cingulate cortex. Neurosci. Lett. 698, 217–223. 10.1016/J.NEULET.2019.01.034. [DOI] [PubMed] [Google Scholar]
- 24.Crowley NA, Bloodgood DW, Hardaway JA, Kendra AM, McCall JG, Al-Hasani R, McCall NM, Yu W, Schools ZL, Krashes MJ, et al. (2016). Dynorphin Controls the Gain of an Amygdalar Anxiety Circuit. Cell Rep. 14, 2774–2783. 10.1016/j.celrep.2016.02.069. [DOI] [PMC free article] [PubMed] [Google Scholar]
- 25.Schreff M, Schulz S, Händel M, Keilhoff G, Braun H, Pereira G, Klutzny M, Schmidt H, Wolf G, and Höllt V (2000). Distribution, Targeting, and Internalization of the sst4 Somatostatin Receptor in Rat Brain. J. Neurosci. 20, 3785–3797. 10.1523/JNEUROSCI.20-10-03785.2000. [DOI] [PMC free article] [PubMed] [Google Scholar]
- 26.Brazeau P, Vale W, Burgus R, Ling N, Butcher M, Rivier J, and Guillemin R (1973). Hypothalamic polypeptide that inhibits the secretion of immunoreactive pituitary growth hormone. Science 179, 77–79. 10.1126/science.179.4068.77. [DOI] [PubMed] [Google Scholar]
- 27.Momiyama T, and Zaborszky L (2006). Somatostatin presynaptically inhibits both GABA and glutamate release onto rat basal forebrain cholinergic neurons. J. Neurophysiol. 96, 686–694. 10.1152/JN.00507.2005. [DOI] [PMC free article] [PubMed] [Google Scholar]
- 28.Leresche N, Asprodini E, Emri Z, Cope DW, and Crunelli V (2000). Somatostatin inhibits GABAergic transmission in the sensory thalamus via presynaptic receptors. Neuroscience 98, 513–522. 10.1016/S0306-4522(00)00107-X. [DOI] [PubMed] [Google Scholar]
- 29.Lopez-Huerta VG, Tecuapetla F, Guzman JN, Bargas J, and Galarraga E (2008). Presynaptic modulation by somatostatin in the neostriatum. Neurochem. Res. 33, 1452–1458. 10.1007/S11064-007-9579-3. [DOI] [PubMed] [Google Scholar]
- 30.Pittman QJ, and Siggins GR (1981). Somatostatin hyperpolarizes hippocampal pyramidal cells in vitro. Brain Res. 221, 402–408. 10.1016/0006-8993(81)90791-5. [DOI] [PubMed] [Google Scholar]
- 31.Delfs JR, and Dichter MA (1983). Effects of somatostatin on mammalian cortical neurons in culture: Physiological actions and unusual dose response characteristics. J. Neurosci. 3, 1176–1188. 10.1523/jneurosci.03-06-01176.1983. [DOI] [PMC free article] [PubMed] [Google Scholar]
- 32.Urban-Ciecko J, and Barth AL (2016). Somatostatin-expressing neurons in cortical networks. Nat. Rev. Neurosci. 17, 401–409. 10.1038/nrn.2016.53. [DOI] [PMC free article] [PubMed] [Google Scholar]
- 33.Girgenti MJ, Wohleb ES, Mehta S, Ghosal S, Fogaca MV, and Duman RS (2019). Prefrontal cortex interneurons display dynamic sex-specific stress-induced transcriptomes. Transl. Psychiatry 9, 292. 10.1038/s41398-019-0642-z. [DOI] [PMC free article] [PubMed] [Google Scholar]
- 34.Soumier A, and Sibille E (2014). Opposing Effects of Acute versus Chronic Blockade of Frontal Cortex Somatostatin-Positive Inhibitory Neurons on Behavioral Emotionality in Mice. Neuropsychopharmacology 39, 2252–2262. 10.1038/npp.2014.76. [DOI] [PMC free article] [PubMed] [Google Scholar]
- 35.Lee AT, Cunniff MM, See JZ, Wilke SA, Luongo FJ, Ellwood IT, Ponnavolu S, Sohal VS, and Sohal VS (2019). VIP Interneurons Contribute to Avoidance Behavior by Regulating Information Flow across Hippocampal-Prefrontal Networks Article VIP Interneurons Contribute to Avoidance Behavior by Regulating Information Flow across Hippocampal-Prefrontal Networks. Neuron 102, 1223–1234.e4. 10.1016/j.neuron.2019.04.001. [DOI] [PMC free article] [PubMed] [Google Scholar]
- 36.Prévôt TD, Gastambide F, Viollet C, Henkous N, Martel G, Epelbaum J, Béracochéa D, and Guillou JL (2017). Roles of Hippocampal Somatostatin Receptor Subtypes in Stress Response and Emotionality. Neuropsychopharmacology 42, 1647–1656. 10.1038/NPP.2016.281. [DOI] [PMC free article] [PubMed] [Google Scholar]
- 37.Engin E, Stellbrink J, Treit D, and Dickson CT (2008). Anxiolytic and antidepressant effects of intracerebroventricularly administered somatostatin: Behavioral and neurophysiological evidence. Neuroscience 157, 666–676. 10.1016/J.NEUROSCIENCE.2008.09.037. [DOI] [PubMed] [Google Scholar]
- 38.Engin E, and Treit D (2009). Anxiolytic and antidepressant actions of somatostatin: The role of sst2 and sst3 receptors. Psychopharmacology (Berl) 206, 281–289. 10.1007/S00213-009-1605-5/FIGURES/2. [DOI] [PubMed] [Google Scholar]
- 39.Yeung M, and Treit D (2012). The anxiolytic effects of somatostatin following intra-septal and intra-amygdalar microinfusions are reversed by the selective sst2 antagonist PRL2903. Pharmacol. Biochem. Behav. 101, 88–92. 10.1016/J.PBB.2011.12.012. [DOI] [PubMed] [Google Scholar]
- 40.Pichler R, Maschek W, Crespillo C, Esteva I, and Soriguer F (2002). Letter to the Editor Is there a gender difference of somatostatin-receptor density in the human brain? Neuroendocrinol. Lett. 23, 235602–235604. [PubMed] [Google Scholar]
- 41.Selmer I, Schindler M, Allen JP, Humphrey PP, and Emson PC (2000). Advances in understanding neuronal somatostatin receptors. Regul. Pept. 90, 1–18. 10.1016/S0167-0115(00)00108-7. [DOI] [PubMed] [Google Scholar]
- 42.Liguz-Lecznar M, Dobrzanski G, and Kossut M (2022). Somatostatin and Somatostatin-Containing Interneurons—From Plasticity to Pathology. Biomolecules 12, 312. 10.3390/BIOM12020312. [DOI] [PMC free article] [PubMed] [Google Scholar]
- 43.Hou ZH, and Yu X (2013). Activity-regulated somatostatin expression reduces dendritic spine density and lowers excitatory synaptic transmission via postsynaptic somatostatin receptor 4. J. Biol. Chem. 288, 2501–2509. 10.1074/JBC.M112.419051. [DOI] [PMC free article] [PubMed] [Google Scholar]
- 44.Smith PA, Sellers LA, and Humphrey PP (2001). Somatostatin activates two types of inwardly rectifying K+ channels in MIN-6 cells. J. Physiol. 532, 127–142. 10.1111/J.1469-7793.2001.0127G.X. [DOI] [PMC free article] [PubMed] [Google Scholar]
- 45.Walsh KB (2011). Targeting GIRK channels for the development of new therapeutic agents. Front Pharmacol OCT, 64. 10.3389/FPHAR.2011.00064/BIBTEX. [DOI] [PMC free article] [PubMed] [Google Scholar]
- 46.Günther T, Culler M, and Schulz S (2016). Research resource: Real-time analysis of somatostatin and dopamine receptor signaling in pituitary cells using a fluorescence-based membrane potential assay. Mol. Endocrinol. 30, 479–490. 10.1210/ME.2015-1241/SUPPL_FILE/ME-15-1241.PDF. [DOI] [PMC free article] [PubMed] [Google Scholar]
- 47.Riedemann T, and Sutor B (2022). Cell-type specific effects of somatostatin on corticocortical information processing in the anterior cingulate cortex. Preprint at bioRxiv. 10.1101/2022.08.02.502518. [DOI] [Google Scholar]
- 48.Stengel A, and Taché YF (2017). Activation of Brain Somatostatin Signaling Suppresses CRF Receptor-Mediated Stress Response. Front. Neurosci. 11, 231. 10.3389/fnins.2017.00231. [DOI] [PMC free article] [PubMed] [Google Scholar]
- 49.Menegas W, Akiti K, Amo R, Uchida N, and Watabe-Uchida M (2018). Dopamine neurons projecting to the posterior striatum reinforce avoidance of threatening stimuli. Nat. Neurosci. 21, 1421–1430. 10.1038/S41593-018-0222-1. [DOI] [PMC free article] [PubMed] [Google Scholar]
- 50.Oh SW, Harris JA, Ng L, Winslow B, Cain N, Mihalas S, Wang Q, Lau C, Kuan L, Henry AM, et al. (2014). A mesoscale connectome of the mouse brain. Nature 508, 207–214. 10.1038/NATURE13186. [DOI] [PMC free article] [PubMed] [Google Scholar]
- 51.Stark KL, Xu B, Bagchi A, Lai WS, Liu H, Hsu R, Wan X, Pavlidis P, Mills AA, Karayiorgou M, and Gogos JA (2008). Altered brain microRNA biogenesis contributes to phenotypic deficits in a 22q11-deletion mouse model. Nat. Genet. 40, 751–760. 10.1038/NG.138. [DOI] [PubMed] [Google Scholar]
- 52.van Rossum G (1995). Python Reference Manual.
- 53.Mathis A, Mamidanna P, Cury KM, Abe T, Murthy VN, Mathis MW, and Bethge M (2018). DeepLabCut: markerless pose estimation of user-defined body parts with deep learning. Nat. Neurosci. 21, 1281–1289. 10.1038/s41593-018-0209-y. [DOI] [PubMed] [Google Scholar]
- 54.Ting JT, Lee BR, Chong P, Soler-Llavina G, Cobbs C, Koch C, Zeng H, and Lein E (2018). Preparation of Acute Brain Slices Using an Optimized N-Methyl-D-glucamine Protective Recovery Method. J. Vis. Exp. 10.3791/53825. [DOI] [PMC free article] [PubMed] [Google Scholar]
- 55.Lowery-Gionta EG, Crowley NA, Bukalo O, Silverstein S, Holmes A, and Kash TL (2018). Chronic stress dysregulates amygdalar output to the prefrontal cortex. Neuropharmacology 139, 68–75. 10.1016/J.NEUROPHARM.2018.06.032. [DOI] [PMC free article] [PubMed] [Google Scholar]
- 56.Sicher AR, Starnes WD, Griffith KR, Dao NC, Smith GC, Brockway DF, and Crowley NA (2023). Adolescent binge drinking leads to long-lasting changes in cortical microcircuits in mice. Neuropharmacology 234, 109561. 10.1016/J.NEUROPHARM.2023.109561. [DOI] [PMC free article] [PubMed] [Google Scholar]
- 57.Sciolino NR, Hsiang M, Mazzone CM, Wilson LR, Plummer NW, Amin J, Smith KG, McGee CA, Fry SA, Yang CX, et al. (2022). Natural locus coeruleus dynamics during feeding. Sci. Adv. 8, 9134. 10.1126/SCIADV.ABN9134/SUPPL_FILE/SCIADV.ABN9134_SM.PDF. [DOI] [PMC free article] [PubMed] [Google Scholar]
- 58.Mazzone CM, Liang-Guallpa J, Li C, Wolcott NS, Boone MH, Southern M, Kobzar NP, Salgado I.d.A., Reddy DM, Sun F, et al. (2020). High-fat food biases hypothalamic and mesolimbic expression of consummatory drives. Nat. Neurosci. 23, 1253–1266. 10.1038/s41593-020-0684-9. [DOI] [PMC free article] [PubMed] [Google Scholar]
- 59.Meng C, Zhou J, Papaneri A, Peddada T, Xu K, and Cui G (2018). Spectrally Resolved Fiber Photometry for Multi-component Analysis of Brain Circuits. Neuron 98, 707–717.e4. 10.1016/J.NEURON.2018.04.012. [DOI] [PMC free article] [PubMed] [Google Scholar]
- 60.Sajadi A, Provost C, Pham B, and Brouillette J (2016). Neurodegeneration in an Animal Model of Chronic Amyloid-beta Oligomer Infusion Is Counteracted by Antibody Treatment Infused with Osmotic Pumps. J. Vis. Exp. 2016, 54215. 10.3791/54215. [DOI] [PMC free article] [PubMed] [Google Scholar]
- 61.Lopes G, Bonacchi N, Frazão J, Neto JP, Atallah BV, Soares S, Moreira L, Matias S, Itskov PM, Correia PA, et al. (2015). Bonsai: An event-based framework for processing and controlling data streams. Front. Neuroinf. 9, 7. 10.3389/FNINF.2015.00007/ABSTRACT. [DOI] [PMC free article] [PubMed] [Google Scholar]
- 62.Kane GA, Lopes G, Saunders JL, Mathis A, and Mathis MW (2020). Real-time, low-latency closed-loop feedback using markerless posture tracking. Elife 9, e61909–e61929. 10.7554/ELIFE.61909. [DOI] [PMC free article] [PubMed] [Google Scholar]
Associated Data
This section collects any data citations, data availability statements, or supplementary materials included in this article.
Supplementary Materials
Data Availability Statement
Original data will be made available upon request directed to the lead contact, Nicole Crowley (nzc27@psu.edu).
All original code has been deposited on Dryad and is publicly available as of the date of publication (Dryad: https://doi.org/10.5061/dryad.mgqnk993f). DOIs are listed in the key resources table.
Any additional information required to reanalyze the data reported in this paper is available from the lead contact upon request.
KEY RESOURCES TABLE.
| REAGENT or RESOURCE | SOURCE | IDENTIFIER |
|---|---|---|
|
| ||
| Bacterial and virus strains | ||
|
| ||
| AAV9.Ef1a.fDIO.GCaMP6f | (Menegas et al.)49 | Addgene #118273 |
| AAV9.CAG.FLEX.TdTomato | (Oh et al.)50 | Addgene #51503 |
| AAV5-EF1a-DIO-hChR2(H134R)-eYFP-WPRE-HGHpA | Karl Deisseroth | Addgene #20298 |
|
| ||
| Chemicals, peptides, and recombinant proteins | ||
|
| ||
| Picrotoxin | Hello Bio | HB0506 |
| CGP 55845 | Tocris | 1248 |
| SST 14 | Bachem | H-1490 |
| Cyclosomatostatin (cyclo-SST) | Abcam | ab141211 |
| Octreotide Acetate | Sigma Aldrich | PHR 1880 |
| Tetrodotoxin (TTX) | Abcam | ab120054 |
| 2,2,2-Tribromoethanol (Avertin) | Thermo Fisher Scientific | A18706.14 |
| Isoflurane | Piramal Pharma Limited | NDC: 66794–013-25 |
| Ketoprofen (100 mg/ml injectable solution) | Manufacturer: Zoetis Supplier: Midwest Veterinary Supply |
275.22120.3 |
| Bupivacaine HCl | Manufacturer: Hospira Supplier: Midwest Veterinary Supply | 191.26505.3 |
| 4% Paraformaldehyde | Thermo Fisher Scientific | J19943.K2 |
| Kynurenic acid | Sigma | K3376 |
| Immu-Mount | Thermo Fisher Scientific | 9990402 |
| DAPI Fluoromount-G | Southern Biotech | 0100–20 |
|
| ||
| Deposited data | ||
|
| ||
| Code and Data | This study | Dryad:https://datadryad.org/stash/share/ouwbAlBUHoEafVxikaupvUOuhSn3wUHZYc096IYwM2c |
|
| ||
| Experimental models: Organisms/strains | ||
|
| ||
| C57BL/6J | Jackson Labs | #000664 |
| SST-IRES-Cre+/- | Jackson Labs | #013044 |
| VIP::Cre | Jackson Labs | #010908 |
| SST::Flp | Jackson Labs | #028579 |
| Df(16)A+/- | (Stark et al.)51 | N/A |
|
| ||
| Software and algorithms | ||
|
| ||
| Clampex (Clampfit and pClamp 11) | Molecular Devices | https://www.moleculardevices.com/ |
| Biorender | Biorender | https://www.biorender.com/ |
| Prism | Graphpad | https://www.graphpad.com/ |
| MATLAB | The Math Works, Inc. | https://www.mathworks.com/products/matlab.html |
| Python | (Van Rossum)52 | N/A |
| Deep Lab Cut | (Mathis et al.)53 | https://github.com/DeepLabCut/DeepLabCut |
|
| ||
| Other | ||
|
| ||
| Vibrating Microtome VF-300–0Z | Precisionary Instruments | N/A |
| Leica Vibratome VS. 1200 | Leica | N/A |
| 7000 smz2 Vibratome | Campden Instruments | N/A |
| Narishige PC-100 Puller | Narishige Group | N/A |
| Borosilicate Glass Capillaries | Warner Instruments | 64–0772 |
| 470-nm LED pE-100 | Cool LED | pE-100 |
| Contemporary Ortho-Jet Powder (Bilateral Cannula) | Lang Dental | Ref. 1530 |
| Ortho-Jet Liquid (Bilateral Cannula) | Lang Dental | Ref. 1304 |
| Dental Cement (Fiber Photometry) | Unifast Trad | N/A |
| Vetbond | 3M | 1469Sb |
| ICV Bilateral Internal Cannula | P1 Technologies | 8IC235ISPCXC |
| ICV Bilateral Guide Cannula | P1 Technologies | 8IC235G10XXC |
| ICV Bilateral Dummy Cannula | P1 Technologies | 8IC235DCSPCC |
| Bilateral Cannula Dust Cap | P1 Technologies | 8K0000303DC1 |
| Stereotaxic frame (Bilateral Cannula/ Optogenetic Release): Drill and Microinjector Robot, Mouse/Rat | Stoelting | SKU: 51705 |
| Stereotaxic frame (Fiber Photometry) | Kopf Instruments | Model 942 |
| 1 μL Neuros syringe | Hamilton | 65458–01 |
| 5 μL Removable Needle Syringe | Hamilton | #7634–01 |
| Syringe Pump | Stoelting | #53311 |
| miniature screws | Antrin Miniature Specialities | AMS90/1B |
| Fiber Optic Cannula (200 μm core, 0.39 NA) | ThorLabs | CFMC12L05 |
| 473-nm Laser | Ready Lasers | MBL-III-473–100mW |
| Noise Eeater | ThorLabs | NEL01 |
| Kinematic Flourescence Filter Cube | ThorLabs | DFM1 |
| Dual-Edge Dichoric Mirror | Chroma | ZT488/561rpc |
| FC/PC Fiber Coupler | Thorlabs | PAF2-A4A |
| Fiber Patchcord (200 μm core, 0.39 NA) | ThorLabs | M72L05 |
| Fiberoptic Rotary Joint | Doric Lenses | FRJ_1×1_FC-FC |
| Mating Sleeve | Precision Fiber Products | SM-CS1140S |
| Dual-band Emission Filter | Chroma | ZET488/561m |
| Fiber Coupler | ThorLabs | PAF2S-11A |
| Anti-reflection-coated Fiber | ThorLabs | M200L02S-A |
| Spectrometer | Ocean Insight | QE Pro |
| BX63 Upright Microscope | Olympus | N/A |
| CMS GmbH CMOS fitted Microscope | Leica Microsystems | N/A |
| LSM 800 Confocal Microscope | Zeiss | N/A |
| Waveform Generator | Sanworks | Pulse Pal v2 |
| Blackfly S USB3 Camera | FLIR | N/A |