

Summary
The continuous monitoring of vital signs is one of the hottest topics in healthcare. Recent technological advances in sensors, signal processing, and image processing spawned the development of no-contact techniques such as remote photoplethysmography (rPPG). To solve the common problems of rPPG including weak extracted signals, body movements, and generalization with limited data resources, we proposed a dual-path estimation method based on video magnification and deep learning. First, image processes are applied to detect, track, and magnificate facial ROIs automatically. Then, the steady part of the wave of each processed ROI is used for the extraction of features including heart rate, PTT, and features of pulse wave waveform. The blood pressures are estimated from the features via a small CNN. Results comply with the current standard and promise potential clinical applications in the future.
Subject areas: Physics, Artificial intelligence, Machine learning
Graphical abstract
Highlights
-
•
Dual-path signals automatic extraction and collaboration from a single facial video
-
•
Combination of image and signal processing technologies for interference reduction
-
•
A small two-stage CNN using features from the stable phase for limited samples
Physics; Artificial intelligence; Machine learning
Introduction
The continuous monitoring of vital signs gradually become the most attractive topic in healthcare, especially after the impact of the SARS-CoV-2 (COVID-19) epidemic.
More and more people are requiring a non-invasive even no-contact, more effective, comfortable, easy operation and less expensive technique to obtain long-term health monitoring and early warning of disease just at home. In this way, not only does the accessibility of treatments for persons who live in distant areas or are unable to travel increase but also the risk of mutual infection and the pressure of visits reduce. In recent years, photoplethysmography (PPG), which is utilized in this field due to its low cost and non-invasive nature, can trap subtle changes in the reflected light due to physiological activity. It can be further categorized into contact-based contact photoplethysmography (cPPG) and contactless-based remote photoplethysmography (rPPG). The former consisting of a light source and a photodetector is abundant in information including the heart rate (HR), cardiac hemodynamics, age, and condition of blood vessels.1 However, it still leads to the problems such as sight discomfort, skin lesions, temporary occlusion of the subcutaneous capillaries, and so on due to the contact probes. Thus, there has been an increased interest in exploring methods for the latter measurement, which collects information from the skin by only a video camera and estimates the vital signs of a person.
The rPPG-based methods can be low-cost and ubiquitous because they only need cameras that can be further embedded in daily-use devices such as smartphones or laptops. Thus, since the inception of the first rPPG-based method,2 researchers have made tremendous progress in the assessment of cardiac activity and respiratory monitoring,3 blood pressure (BP) measurement,4 oxygen saturation,5 skin detection6 and mental stress assessment.7 Among the methods, the face is usually one of the least occluded skin regions where PPG signals are the most salient so extracting a PPG signal from the facial region has become mainstream. However, there are remaining various challenges for the estimation of vital signs by rPPG. During the collection of the video data, the strength of the signals sometimes is weak and very vulnerable to interference. The motion of the subject, including head tilt, posture changes, facial expressions, and so on, always exists. Besides, the variations of the illumination caused by the flash of indoor lights and the internal noise of the digital camera are other main interference. In addition, the appropriate datasets are lacking, which brings great difficulties to some end-to-end deep-learning-based methods.
Conventional methods for measuring HR based on remote photoplethysmography (rPPG) have seen continuous development. Among them, the first rPPG-based method proposed by Verkruysse2 was introduced for measuring HR and respiratory rate (RR) from facial videos. On this basis, many methods have been proposed to further mitigate the impact of lighting changes on signal analysis during video recording. Poh8,9 utilized the Blind Source Suppression (BSS) method for non-contact multiple physiological parameters measurement. The PPG signal was obtained by separating source signals via Independent Component Analysis (ICA) and Principal Component Analysis (PCA), and the noise was removed from the PPG signal through time filters. Cheng10 proposed a video-based approach for robust heart rate measurement. This method employed joint blind source separation (JBSS) and ensemble empirical mode decomposition (EEMD) to suppress the influence of lighting changes. Another problem when using rPPG is the non-uniform spatial illumination on the facial skin. Song11 combined EEMD and multiset canonical correlation analysis (MCCA) to address this issue. The green signal was decomposed into multi-channel signals of which reliable intrinsic mode functions (IMFs) were input into MCCA to obtain the canonical variables (CVs).
Inspired by the above methods, a plethora of academic studies have extended the application of rPPG technology from HR to other physiological signals, such as blood pressure (BP) in recent years. The primary rationale is that the speed of blood flow is positively correlated with blood pressure.12 Because of the rate of blood flow, which is termed Pulse Wave Velocity (PWV), blood pulses require a time delay to reach the periphery of the body from the heart, which is denoted as Pulse Transit Time (PTT).13 A lot of mathematical models of these various parameters have been studied to infer blood pressure values. Sugita14 proved that the Pulse Transit Time (PTT) difference and instantaneous phase difference obtained from two different pulse wave measurements are positively correlated with blood pressure. Thus, the PTT can be considered one of the most important indexes correlated the changes in blood pressure and has yielded many productive results. Secerbegovic15 applied ICA to extract clean PTT signals from the ROI of facial video and investigated their correlation with blood pressure. In a new blood pressure measurement model proposed by Zhou,16 the PPG signals from facial videos were obtained and the corresponding systolic and diastolic pressure peaks and waves were extracted. The least squares fitting algorithm is used to fit optimal parameters and incorporated Body Mass Index (BMI) as a correction factor. Considering that the conventional PTT-based estimation of BP is limited to the motion of the subject, Fan17 introduced an adaptive selection strategy to obtain reliable rPPG signals and developed an adaptive Gaussian model to fit the rPPG waveform for a more accurate PTT estimation. However, they still lack robustness and generalization ability when the signal is not ideal.
There are obstacles to conventional methods in some unstable situations such as head motion, alterations in facial expressions, and fluctuations in environmental illumination, so more and more researchers tried to adopt deep learning to solve the above problems. The deep learning-based methods for measuring heart rate using rPPG can be classified into two categories.
The first category uses deep learning techniques to enhance traditional methods. For instance, Qiu18 showed a framework called EVM-CNN, which is based on the EVM algorithm. This method utilized a Gaussian pyramid for spatial decomposition, band-pass filters to obtain the spatial frequency signals of interest, and then extracted heart rate-related features fed into a regression convolutional neural network for heart rate prediction. Luguev19 employed a deep spatiotemporal network called 3DCNN to directly extract pulse signals from raw facial videos for measuring HRV. Liu20 presented a central difference convolutional network with a 3D-CBAM attention mechanism (CDCA-rPPGNet) for robust heart rate measurement. This network can extract more effective features from regions of interest (ROIs) as inputs to the model and output more accurate rPPG signals by combining spatial and temporal features.
The above methods extract feature vectors from facial videos and convert them into HR. The second type of method is end-to-end deep learning, which utilizes neural networks to directly estimate heart rate from facial videos without hand-crafted features. Chen21 proposed a Convolutional Attention Network (CAN) called DeepPhys, which introduced the attention mechanism to video-based vital sign measurement. The network can automatically select and weigh the ROIs in the video, enabling accurate measurement of HR and RR even in situations where the head rotates significantly. Yu22 adopted a method of enhancing videos to address the issue of damaged rPPG signal extraction from the compressed video. The method directly recovers accurate rPPG signals from raw facial videos using spatiotemporal information. The network, called PhysNet, recovered rPPG signals with precise pulse peaks, which can be used for subsequent spectral analysis and accurate calculation of heart rate and heart rate variability. Lee23 developed a remote heart rate estimation algorithm that incorporated transductive inference technology. This algorithm can learn an adaptive model from a small amount of annotated data. The weight changes were implemented in the CNN-based convolutional encoder module, while the estimation of the rPPG signal was implemented in the LSTM-based RPPG estimator. Liu24 used a general rPPG estimator based on spatiotemporal convolutional networks to handle different types of skin inputs and adopted a spatiotemporal rPPG fusion strategy to enhance its robustness. To address the limitation of high redundancy of spatial information caused by slow changes in facial video information, Hu25 proposed a model of extracting the spatiotemporal facial features based on short segments. In addition, they integrated a spatial-temporal attention module (SAM) to mitigate the impact of head movement and enhance the robustness of HR estimation. To reduce the noise in different regions of the face due to facial expressions, Lokendra26 mentioned a novel denoising-rPPG method (AND-rPPG) for heart rate estimation. This method utilized a temporal convolution network (TCN) and introduced action units (AUs) to remove noise from the time signal, thereby improving the accuracy of heart rate estimation. Yin27 proposed a heart rate estimation model employing an attention mechanism module to focus on the skin area and suppressed the noise introduced by the background, and a spatiotemporal convolution module to improve the estimation accuracy in various environments. Li28 presented a multi-level convolutional neural network-based heart rate estimation method including low-level face feature generation (LFFG), 3D spatiotemporal stack convolution (STSC), multi-hierarchical feature fusion (MHFF), and signal predictor (SP).
In the field of video-based non-contact blood pressure measurement, innovative achievements have also been made by using deep learning methods. Patil29 utilized a camera to detect PPG signals and extracted features as inputs to a feedforward neural network for estimating blood pressure, with ICA used for preprocessing the rPPG signals. Luo30 mentioned a blood pressure estimation method using the smartphone camera to capture facial videos and detect subtle changes in facial blood flow. During filming, the camera was focused on the subject’s forehead, and the transdermal optical imaging (TOI) method was used to select the facial region for feature extraction. Then, 30 features obtained after PCA dimensionality reduction were input into a multilayer perceptron to generate a blood pressure prediction model. The JADE algorithm was used to separate the blind source signals from the green channel in the ROI. The PPG signal was then denoised and the peaks and waves of the systolic and diastolic pressures were extracted. Finally, the model for systolic and diastolic pressure was established with the introduction of BMI. Wu31 proposed an end-to-end blood pressure estimation model based on multichannel rPPG input by using a generative adversarial network (GAN) called infoGAN to enhance data. Iuchi32 studied a method for remotely estimating continuous blood pressure based on pulse waves and spatial information. The spatial pulse wave signals were transformed into spatial signals for each contour of the ROI. A convolutional neural network based on ResNet and CBAM was trained on these contours to estimate continuous blood pressure.
However, even though these methods have better generalization than the conventional methods, they still face a few limitations. Firstly, some methods need ECG signals during the estimation, which may be difficult to include in wearable cuff-less systems. Additionally, some handcrafted features should be used in the ideal configuration. Thus, most of the methods can hardly satisfy the Association for the error range of the Advancement of Medical Instrumentation (AAMI) standard.
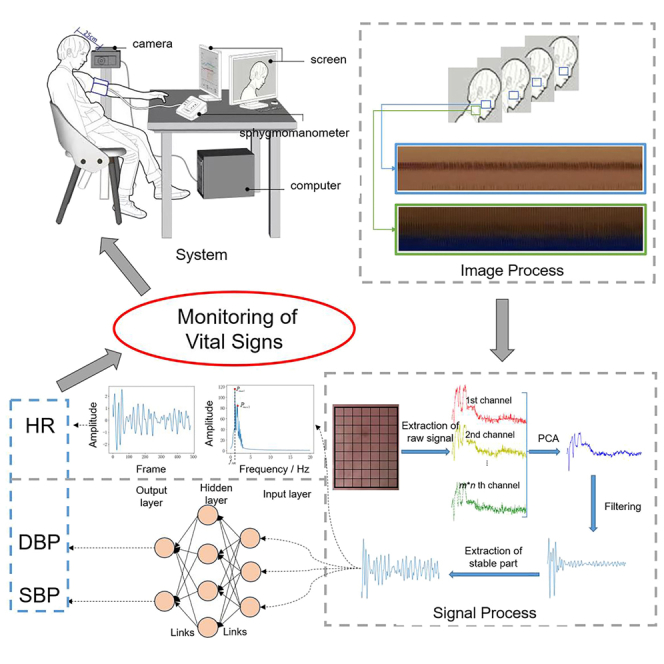
This present article aims to realize automatical and high-precise estimation of vital signs including heart rate and blood pressure only from facial videos in actual health monitoring. To solve the above problems, we proposed a method based on magnification and deep learning. First, two ROIs in the face and neck respectively are extracted, tracked, and magnified dynamically and automatically by image processing techniques to reduce the influence of motion and enhance the strength of PPG signals. Then, each ROI in a frame is divided into several blocks and the average gray value of each block forms a time series from the video. The Principal Component Analysis (PCA) is applied to realize blind source separation. The series of the principal component will be cut iteratively based on statistics to obtain the stable part which is regarded as the valid pulse wave. The heart rate is estimated synthetically by the dual waves from the face and neck, which further guarantee the accuracy of the results. Other features extracted from the wave are the input of the designed CNN, and the output is the predicted blood pressure values.
As a whole, the main contributions of this article can be summarized, as follows.
-
•
A pattern is proposed to realize a highly precise estimation of vital signs.
-
•
Dual-path time series of signals are extracted from a single facial video automatically and work collaboratively to guarantee accuracy during the estimation of vital signs.
-
•
Multiple technologies of image and signal processing are combined to extract stable phases from the original time series to reduce the influence of interferences from human skin characteristics, breathing, the external environment, and so on.
-
•
A small two-stage CNN is designed to predict the blood pressures with extracted features from the stable time series rather than the whole image to keep the effectiveness of training with limited samples.
Results
The influence of video magnification methods
The process of the method is shown in Video S1.
In order to analyze the adaptability of three popular magnification methods including color EVM, EVAM, and learning-based VMM to extract the facial pulse wave and neck pulse wave, this section sorted 288 samples from small to large according to the heart rate and divided them into 6 layers with a heart rate range of 50–60, 60–80, 80–100 and 100–120 respectively. Following the stratified sampling method, 18 samples were selected for 6 control experiments. Tables 1 and 2 show the experimental results and errors.
Table 1.
Heart rate measurement results under different video magnification methods
| Number | Reference | Facial pulse wave |
Neck pulse wave |
||||
|---|---|---|---|---|---|---|---|
| EVM | EVAM | learning-based VMM | EVM | EVAM | learning-based VMM | ||
| 1 | 50 | 50 | 50 | 50 | 50 | 50 | 50 |
| 2 | 57 | 58 | 57 | 57 | 64 | 62 | 59 |
| 3 | 58 | 55 | 56 | 56 | 50 | 52 | 55 |
| 4 | 60 | 61 | 61 | 61 | 58 | 59 | 59 |
| 5 | 61 | 63 | 62 | 62 | 73 | 70 | 67 |
| 6 | 62 | 61 | 61 | 62 | 63 | 63 | 62 |
| 7 | 62 | 63 | 63 | 63 | 65 | 64 | 63 |
| 8 | 63 | 62 | 63 | 63 | 68 | 65 | 64 |
| 9 | 64 | 64 | 64 | 64 | 60 | 63 | 63 |
| 10 | 67 | 69 | 69 | 68 | 70 | 68 | 69 |
| 11 | 70 | 72 | 71 | 72 | 60 | 65 | 67 |
| 12 | 73 | 74 | 74 | 74 | 71 | 71 | 72 |
| 13 | 75 | 75 | 76 | 76 | 80 | 78 | 77 |
| 14 | 77 | 77 | 78 | 77 | 80 | 77 | 77 |
| 15 | 79 | 79 | 79 | 79 | 78 | 78 | 78 |
| 16 | 84 | 87 | 87 | 87 | 71 | 73 | 75 |
| 17 | 94 | 94 | 94 | 94 | 88 | 91 | 92 |
| 18 | 111 | 110 | 110 | 111 | 100 | 105 | 105 |
Table 2.
Heart rate measurement errors under different video magnification methods
| Error | Reference | Facial pulse wave |
Neck pulse wave |
||||
|---|---|---|---|---|---|---|---|
| EVM | EVAM | learning-based VMM | EVM | EVAM | learning-based VMM | ||
| RMSE | 1.056 | 0.889 | 0.722 | 5.333 | 3.278 | 2.278 | 1.056 |
| MAPE | 1.576% | 1.270% | 1.055% | 7.490% | 4.636% | 3.098% | 1.576% |
It can be seen that the three methods have similar effects on facial pulse waves, but Learning based VMM is more suitable for neck pulse waves. This is mainly because compared to the face, the neck is more susceptible to breathing. The extracted neck fluctuation signal not only contains pulse wave signals but also strong respiratory signals. Inadvertent swallowing movements can also cause significant noise to the extracted pulse wave signals in the neck. Color-EVM magnifies color changes while easily magnifying noise. EVAM can suppress large linear motion interference and only magnify small changes in larger movements, Learning-based VMM can choose the frequency band of interest to achieve better results than EVAM. Furthermore, the consumption time of different methods is listed in Table 3. Considering the effectiveness and the consumption cost of the three methods, we used color-EVM to enlarge facial videos to neck videos in further experiments.
Table 3.
Consumption time of different video magnification methods (in second)
| Method | Facial pulse wave | Neck pulse wave |
|---|---|---|
| EVM | 0.33 | 0.35 |
| EVAM | 60.13 | 66.65 |
| Learning-based VMM | 15.33 | 15.61 |
Validity analysis of measurement results
Error analysis
This section calculates the RMSE and MAPE of the predicted values of heart rate and blood pressure detection methods relative to the reference values measured by Omron HEM-7124. The specific results of different methods for HR estimation are shown in Table 4. The proposed method has better performance than the baselines.
Table 4.
Consumption time of different video magnification methods (in second)
According to the standard for electronic or liquid free sphygmomanometers issued by the Association for the Advancement of Medical Instrumentation (AAMI), the heart rate measurement error of electrocardiogram devices should not exceed of the standard value or 5 bpm. The relative error rate of the two methods meets the requirements of regulations. Therefore, the heart rate value measured by the proposed method can be used instead of Omron HEM-7124 for the following blood pressure model training and testing.
The errors of the estimated blood pressures are shown in Table 5. The standard also stipulates that the average error and standard deviation should be less than and 8 mmHg respectively. The standard deviation values of the prediction results of the diastolic and systolic blood pressure test sets are 4.106 and 4.839 respectively, which means that the proposed method in this article can meet the standard.
Table 5.
Error of blood pressures
| Error | Diastolic blood | Systolic blood |
|---|---|---|
| RMSE | 3.75 | 4.11 |
| MAPE | 4.95% | 3.73% |
Correlation analysis
The Pearson correlation coefficient between the heart rate detection results obtained from the above experiment and the heart rate values measured by Omron HEM-7124 is 0.988, indicating a strong correlation. The Pearson correlation coefficients between the predicted values of the above blood pressure model and those measured by Omron HEM-7124 were calculated. Among them, the Pearson coefficients of diastolic blood pressure and systolic blood pressure are 0.921 and 0.950 respectively, both showing strong correlations.
Consistency analysis
Since the Pearson correlation coefficient can only reflect the degree of correlation between data, the consistency between two sets of data should be further evaluated. Common analysis methods including scatterplots and Bland Altman analysis in the medical field were also applied to quantitatively evaluate the consistency of HR, diastolic blood pressure, and systolic blood pressure with the results measured by Omron HEM-7124.
A scatterplot shown in Figure 1 is used to evaluate the consistency of estimation results of HR. Each input video contains a set of heart rate reference values and experimental value data, corresponding to a point on the scatterplot coordinate system. The blue line shown in Figure 2 is the line . It can be seen that all data points are distributed near the line and can be fitted using the line. The properties of the line indicate that the proposed method in this article has good consistency with Omron HEM-7124.
Figure 1.

Scatterplot of heart rate
Figure 2.

Scatterplot of blood pressure
(A) Scatterplot of diastolic blood pressure for the training data.
(B) Scatterplot of systolic blood pressure for the training data.
(C) Scatterplot of diastolic blood pressure for the test data.
(D) Scatterplot of systolic blood pressure for the test data.
The scatterplots shown in Figure 2 reflect the consistency between the training and testing results of the blood pressure network models and the reference blood pressure values measured by Omron HEM-7124. From Figures 2A and 2B, it can be seen that all data points are distributed near the straight line , indicating that the models have very good training effects on diastolic and systolic blood pressure. And Figures 2C and 2D prove the good effectiveness in the test data.
The offsets in the measurement results between the two methods are inevitable. Within the offset range, there is a confidence interval of 95%. If the difference between the two measurement results is within the 95% confidence interval, it is considered that the measurement results of the two methods have good consistency in clinical medicine. The Bland Altman plot represents the 95% confidence interval with a 1.96-fold SD confidence interval. Figure 3 shows the Bland Altman analysis of the experimental results in this article.
Figure 3.

Results of Bland Altman consistency analysis
(A) Analysis of heart rate.
(B) Analysis of diastolic blood pressure.
(C) Analysis of diastolic blood pressure.
Figure 3C shows the Bland Altman consistency analysis of the heart rate values calculated from 288 sample videos collected using the method proposed in this article and the heart rate reference values measured by Omron HEM-7124. The scatter points in the figure are all distributed within 1.96 times the SD confidence interval (−4.0,3.6), and the average difference line is located below the longitudinal zero line position, with a value of −0.2, which reflects strong consistency between the two heart rate measurement methods. Similar conclusions that there is strong consistency between the two methods in systolic diastolic and blood pressure can be obtained from Figures 3B and 3C.
Discussion
The continuous monitoring of vital signs is a highly researched topic at the current time. The increasing demand for rPPG-based devices can provide an interesting direction in this field. Keeping that in mind, our research proposed an estimation method of HR and BP via video magnification and deep learning. In this work, the proposed method gives non-contact measurements of HR and BP.
We compared the influences of methods of video magnification for the final estimation. The learning-based VMM can get the best accuracy in both waves at the cost of the highest consumption time. By contrast, EVAM can better balance the two aspects. The proposed method has better performance than the baselines in error analysis. The main reason is the design of a dual-path check, which guarantees the reliability of the results. For the baselines, the side faces of the subjects mean less information and decrease the accuracy of the results. The relative error rate of the proposed method and the device meets the requirements of regulations. Besides, the high correlation and consistency between the proposed method and the device further demonstrated the effectiveness of the method and the potential of being used in clinics and daily care instead of the device.
We believe, our work can provide a possible solution that is no-contact, more effective, comfortable, easy operation, less expensive, and assist in health care.
Limitations of the study
The number of datasets can be further extended for better training Effect. The lighting conditions in the experiment are ideal. The proposed method doesn’t consider the situation of low or uneven light intensity and adopts pointed measures, which is the focus of our next work.
STAR★Methods
Key resources table
| REAGENT or RESOURCE | SOURCE | IDENTIFIER |
|---|---|---|
| Deposited data | ||
| Raw facial video data | This paper | N/A |
| Software and algorithms | ||
| Python (version 3.8.0) | Python Software Foundation | https://www.python.org/ |
| Anaconda3 | Continuum Analytics | https://www.anaconda.com/ |
| Code for model and network training and analysis | This paper | N/A |
Resource availability
Lead contact
Further information and requests for resources should be directed to and will be fulfilled by the lead contact, Xianzeng Zhang (xzzhang@fjnu.edu.cn).
Materials availability
The study did not generate any unique reagents.
Method details
All methods can be found in the accompanying transparent methods supplemental information.
Acknowledgments
This work was sponsored by the National Natural Science Foundation of China (No.61575042), the Natural Science Foundation of Fujian Province (No. 2020J01156 and 2019J01285).
Author contributions
B.L. designed and oversaw the conduction of the study, and performed the initial analyses. J.T. drafted the initial article, and participated in the implementation of methods. J.X., L.H., N.L., and X.Z participated in the validation of statistical results, review and editing of the article, as well as administrative aspects of article submission. All authors read and approved the final article.
Declaration of interests
The authors declare no competing interests.
Published: September 6, 2023
Footnotes
Supplemental information can be found online at https://doi.org/10.1016/j.isci.2023.107845.
Contributor Information
Bin Lin, Email: linb@fjnu.edu.cn.
Xianzeng Zhang, Email: xzzhang@fjnu.edu.cn.
Supplemental information
Data and code availability
-
•
On request, the lead contact will share the original data reported in this article.
-
•
This article contains part of the original code.
-
•
Any extra data necessary to reanalyze the data given in this research is accessible upon request from the lead contact.
References
- 1.Allen J. Photoplethysmography and its application in clinical physiological measurement. Physiol. Meas. 2007;28:R1. doi: 10.1088/0967-3334/28/3/R01. [DOI] [PubMed] [Google Scholar]
- 2.Verkruysse W., Svaasand L.O., Nelson J.S. Remote plethysmographic imaging using ambient light. Opt Express. 2008;16:21434–21445. doi: 10.1364/oe.16.021434. [DOI] [PMC free article] [PubMed] [Google Scholar]
- 3.Bousefsaf F., Maaoui C., Pruski A. Peripheral vasomotor activity assessment using a continuous wavelet analysis on webcam photoplethysmographic signals. Bio Med. Mater. Eng. 2016;27:527–538. doi: 10.3233/BME-161606. [DOI] [PubMed] [Google Scholar]
- 4.Jeong I.C., Finkelstein J. Introducing contactless blood pressure assessment using a high speed video camera. J. Med. Syst. 2016;40:77. doi: 10.1007/s10916-016-0439-z. [DOI] [PubMed] [Google Scholar]
- 5.Shao D., Liu C., Tsow F., Yang Y., Du Z., Iriya R., Yu H., Tao N. Noncontact monitoring of blood oxygen saturation using camera and dual-wavelength imaging system. IEEE Trans. Biomed. Eng. 2016;63:1091–1098. doi: 10.1109/TBME.2015.2481896. [DOI] [PubMed] [Google Scholar]
- 6.Bobbia S., Macwan R., Benezeth Y., Mansouri A., Dubois J. Unsupervised skin tissue segmentation for remote photoplethysmography. Pattern Recogn. Lett. 2019;124:82–90. [Google Scholar]
- 7.Bousefsaf F., Maaoui C., Pruski A. 2014 International Conference on Control, Decision and Information Technologies (CoDIT) IEEE; 2014. Remote assessment of physiological parameters by non-contact technologies to quantify and detect mental stress states; pp. 719–723. [Google Scholar]
- 8.Poh M.Z., McDuff D.J., Picard R.W. Advancements in noncontact, multiparameter physiological measurements using a webcam. IEEE Trans. Biomed. Eng. 2011;58:7–11. doi: 10.1109/TBME.2010.2086456. [DOI] [PubMed] [Google Scholar]
- 9.Poh M.Z., McDuff D.J., Picard R.W. Non-contact, automated cardiac pulse measurements using video imaging and blind source separation. Opt Express. 2010;18:10762–10774. doi: 10.1364/OE.18.010762. [DOI] [PubMed] [Google Scholar]
- 10.Cheng J., Chen X., Xu L., Wang Z.J. Illumination variation-resistant video-based heart rate measurement using joint blind source separation and ensemble empirical mode decomposition. IEEE J. Biomed. Health Inform. 2017;21:1422–1433. doi: 10.1109/JBHI.2016.2615472. [DOI] [PubMed] [Google Scholar]
- 11.Song R., Li J., Wang M., Cheng J., Li C., Chen X. Remote photoplethysmography with an eemd-mcca method robust against spatially uneven illuminations. IEEE Sensor. J. 2021;21:13484–13494. [Google Scholar]
- 12.Slapničar G., Mlakar N., Luštrek M. Blood pressure estimation from photoplethysmogram using a spectro-temporal deep neural network. Sensors. 2019;19:3420. doi: 10.3390/s19153420. [DOI] [PMC free article] [PubMed] [Google Scholar]
- 13.Geddes L.A., Voelz M.H., Babbs C.F., Bourland J.D., Tacker W.A. Pulse transit time as an indicator of arterial blood pressure. Psychophysiology. 1981;18:71–74. doi: 10.1111/j.1469-8986.1981.tb01545.x. [DOI] [PubMed] [Google Scholar]
- 14.Sugita N., Obara K., Yoshizawa M., Abe M., Tanaka A., Homma N. 2015 37th annual international conference of the IEEE engineering in medicine and biology society (EMBC) IEEE; 2015. Techniques for estimating blood pressure variation using video images; pp. 4218–4221. [DOI] [PubMed] [Google Scholar]
- 15.Secerbegovic A., Bergsland J., Halvorsen P.S., Suljanovic N., Mujcic A., Balasingham I. 2016 IEEE 13th International Symposium on Biomedical Imaging (ISBI) IEEE; 2016. Blood pressure estimation using video plethysmography; pp. 461–464. [Google Scholar]
- 16.Zhou Y., Ni H., Zhang Q., Wu Q. The noninvasive blood pressure measurement based on facial images processing. IEEE Sensor. J. 2019;19:10624–10634. [Google Scholar]
- 17.Fan X., Ye Q., Yang X., Choudhury S.D. Robust blood pressure estimation using an rgb camera. J. Ambient Intell. Hum. Comput. 2020;11:4329–4336. [Google Scholar]
- 18.Qiu Y., Liu Y., Arteaga-Falconi J., Dong H., El Saddik A. Evm-cnn: Real-time contactless heart rate estimation from facial video. IEEE Trans. Multimed. 2019;21:1778–1787. [Google Scholar]
- 19.Luguev T., Seuß D., Garbas J.U. 2020 54th Annual Conference on Information Sciences and Systems (CISS) IEEE; 2020. Deep learning based affective sensing with remote photoplethysmography; pp. 1–4. [Google Scholar]
- 20.Liu X., Wei W., Kuang H., Ma X. Heart rate measurement based on 3d central difference convolution with attention mechanism. Sensors. 2022;22:688. doi: 10.3390/s22020688. [DOI] [PMC free article] [PubMed] [Google Scholar]
- 21.Chen W., McDuff D. Proceedings of the european conference on computer vision. ECCV); 2018. Deepphys: Video-based physiological measurement using convolutional attention networks; pp. 349–365. [Google Scholar]
- 22.Yu Z., Li X., Zhao G. Remote photoplethysmograph signal measurement from facial videos using spatio-temporal networks. arXiv. 2019 doi: 10.48550/arXiv.1905.02419. preprint at. [DOI] [Google Scholar]
- 23.Lee E., Chen E., Lee C.Y. Computer Vision–ECCV 2020: 16th European Conference. Springer; 2020. Meta-rppg: Remote heart rate estimation using a transductive meta-learner; pp. 392–409. [Google Scholar]
- 24.Liu S.Q., Yuen P.C. 2020 15th IEEE International Conference on Automatic Face and Gesture Recognition (FG 2020) IEEE; 2020. A general remote photoplethysmography estimator with spatiotemporal convolutional network; pp. 481–488. [Google Scholar]
- 25.Hu M., Qian F., Wang X., He L., Guo D., Ren F. Robust heart rate estimation with spatial–temporal attention network from facial videos. IEEE Trans. Cogn. Dev. Syst. 2022;14:639–647. [Google Scholar]
- 26.Lokendra B., Puneet G. And-rppg: A novel denoising-rppg network for improving remote heart rate estimation. Comput. Biol. Med. 2022;141 doi: 10.1016/j.compbiomed.2021.105146. [DOI] [PubMed] [Google Scholar]
- 27.Yin R.N., Jia R.S., Cui Z., Sun H.M. Pulsenet: A multitask learning network for remote heart rate estimation. Knowl. Base Syst. 2022;239 [Google Scholar]
- 28.Li B., Zhang P., Peng J., Fu H. Non-contact ppg signal and heart rate estimation with multi-hierarchical convolutional network. Pattern Recogn. 2023;139 [Google Scholar]
- 29.Patil O.R., Gao Y., Li B., Jin Z. Proceedings of the 2017 ACM international joint conference on pervasive and ubiquitous computing and proceedings of the 2017 ACM international symposium on wearable computers. 2017. Cambp: A camera-based, non-contact blood pressure monitor; pp. 524–529. [Google Scholar]
- 30.Luo H., Yang D., Barszczyk A., Vempala N., Wei J., Wu S.J., Zheng P.P., Fu G., Lee K., Feng Z.P. Smartphone-based blood pressure measurement using transdermal optical imaging technology. Circ. Cardiovasc. Imaging. 2019;12 doi: 10.1161/CIRCIMAGING.119.008857. [DOI] [PubMed] [Google Scholar]
- 31.Wu B.F., Chiu L.W., Wu Y.C., Lai C.C., Chu P.H. Proceedings of the IEEE/CVF Conference on Computer Vision and Pattern Recognition. 2022. Contactless blood pressure measurement via remote photoplethysmography with synthetic data generation using generative adversarial network; pp. 2130–2138. [DOI] [PubMed] [Google Scholar]
- 32.Iuchi K., Miyazaki R., Cardoso G.C., Ogawa-Ochiai K., Tsumura N. Proceedings of the IEEE/CVF Conference on Computer Vision and Pattern Recognition. 2022. Remote estimation of continuous blood pressure by a convolutional neural network trained on spatial patterns of facial pulse waves; pp. 2139–2145. [Google Scholar]
- 33.De Haan G., Jeanne V. Robust pulse rate from chrominance-based rppg. IEEE Trans. Biomed. Eng. 2013;60:2878–2886. doi: 10.1109/TBME.2013.2266196. [DOI] [PubMed] [Google Scholar]
- 34.Jaiswal K.B., Meenpal T. Heart rate estimation network from facial videos using spatiotemporal feature image. Comput. Biol. Med. 2022;151 doi: 10.1016/j.compbiomed.2022.106307. [DOI] [PMC free article] [PubMed] [Google Scholar]
Associated Data
This section collects any data citations, data availability statements, or supplementary materials included in this article.
Supplementary Materials
Data Availability Statement
-
•
On request, the lead contact will share the original data reported in this article.
-
•
This article contains part of the original code.
-
•
Any extra data necessary to reanalyze the data given in this research is accessible upon request from the lead contact.