

Abstract
The unbounded permutations of biological molecules, including proteins and their constituent peptides, presents a dilemma in identifying the components of complex biosamples. Sequence search algorithms used to identify peptide spectra can be expanded to cover larger classes of molecules, including more modifications, isoforms, and atypical cleavage, but at the cost of false positives or false negatives due to the simplified spectra they compute from sequence records. Spectral library searching can help solve this issue by precisely matching experimental spectra to library spectra with excellent sensitivity and specificity. However, compiling spectral libraries that span entire proteomes is pragmatically difficult. Neural networks that predict complete spectra containing a full range of annotated and unannotated ions can be used to replace these simplified spectra with libraries of fully predicted spectra, including modified peptides. Using such a network, we created predicted spectral libraries that were used to rescore matches from a sequence search done over a large search space, including a large number of modifications. Rescoring improved the separation of true and false hits by 82%, yielding an 8% increase in peptide identifications, including a 21% increase in nonspecifically cleaved peptides and a 17% increase in phosphopeptides.
Keywords: machine learning, search engine methods, tandem mass spectrometry, proteome analysis, peptides, algorithms
Graphical Abstract

Introduction
Proteomics is the large-scale study of the entire set of proteins that are found in a cell, a tissue, or an organism. This comprehensive scope presents unique challenges to the experimentalist. While a genome may contain tens of thousands of genes, the number of structurally different proteins translated from the genome exponentially increases through variations such as isoforms, mutations and post-translational modifications (PTMs). Commonly, these proteins are identified by enzymatically digesting them into their constituent peptides, injecting them into a mass spectrometer, and dissociating them, with the resulting fragment mass/charge and intensities measured to generate peptide mass spectra. Sequence search algorithms1–7 use computationally digested protein sequence records to generate theoretical peptide spectra to match to the experimental spectra. These theoretical spectra contain the mass/charge values of a limited number of possible ion types from canonical dissociation reactions, and typically the algorithms do not attempt to predict whether these ions will be realized or, if they are, their intensities. These factors can reduce the specificity of search results, particularly when searching large chemical spaces. To improve specificity and to minimize search time, the sequence search algorithms significantly limit the types of peptides being searched and modifications considered, such as requiring digestion to occur perfectly.
Due to these limitations, sequence searches are subject to the streetlight effect: they only search within a limited space, a significant constraint when looking for novel biological results. To address this issue, open searches8–15 algorithmically modify sequence searches to allow for a much larger breadth of variations in the chemical structure of proteins. However, they typically require an unmodified spectrum of the peptide being examined and the larger space searched comes with a consequence: false positive matches to the theoretical spectra of molecules that are misleading or chemically inexplicable16.
Spectral library searching12,17–20,holds at least a partial solution to this issue by matching the observed spectra to those from a library of previously identified experimental spectra. Spectral libraries, unlike the theoretical spectra generated for sequence search algorithms, contain only the ion mass/charge and intensities that are the experimentally observed products of fragmentation reactions. Due to these factors, spectral library searching has been shown to have better performance than sequence search algorithms21, but can suffer from incomplete proteome coverage since spectral libraries must be compiled and curated from existing sets of experimental spectra which may not span all known protein sequences and modifications.
To increase the proteome coverage of spectral libraries, it is possible to predict mass spectra from a peptide sequence using computational models of peptide fragmentation22,23. One such model, MassAnalyzer24,25, estimates the equilibrium constants for fragmentation reactions. However, libraries generated from MassAnalyzer predictions have not consistently produced improvements in search results21.
Approaches using AI, in contrast to an explicit model of fragmentation reactions, use a general model architecture to learn how to predict spectra by training directly on large sets of spectral data26–31. In particular, deep neural networks (DNN) have reported significant progress in predicting spectra. The DNN Prosit32,33 directly predicts the abundances of only b and y ion types. This approach is not able to predict unannotated ions and requires a dataset where ions are well annotated. A similar DNN, pDeep34–36, predicts a limited set of fragmentation ions while allowing for 21 modifications, including phosphorylation which plays a prominent role in biology, including in cellular signaling37,38. One intriguing class of networks predicts full spectra that, in contrast to previous networks, do not require annotated training spectra and predict complete spectra that include unannotated ions. Not requiring annotations not only makes training networks easier, but also allows the network to be trained for any set of modifications. PredFull39 is a seminal DNN in this class. In comparison to previous approaches, we use a transformer-based network40,41 that predicts the complete spectra of modified and unmodified peptides that are dissociated using Higher Energy Collisional Dissociation (HCD). The network was trained with the diverse, high-quality spectra in the NIST peptide spectral library42,43. The ability to predict unannotated ions may be important for HCD spectra, where 44% of all ions can be unannotated44.
The use of DNN spectrum prediction networks to improve search results is a subject of active investigation. The INFERYS45 algorithm was shown to boost peptide identifications from the Sequest HT sequence search algorithm using a DNN that predicts spectra with a limited set of ion series. The Prosit46,47 approach based on the same DNN architecture also shows boosting of search results. Both INFERYS and Prosit are largely limited to a small set of modifications that typically form during sample preparation. The Deephos48 search strategy uses a network that predicts neutral loss ions and a novel search algorithm to improve the identification of only TMT-labeled phosphopeptides, although it is not clear if the improvements shown are due to the predictions or to features of the search algorithm, including its reduced search space.
Because the network we used predicts the complete spectra of peptides that are typically found in spectral libraries, including those with PTMs and modifications like TMT, we set out to understand not only if the use of DNNs boosted the search results of typical peptide classes, but also whether it would allow us to significantly expand the chemical space being searched. To do this, we performed an exhaustive sequence search over a much larger chemical space of atypically cleaved semi-tryptic peptides decorated with a large number of modifications, where semi-tryptic peptides are those cleaved at one end by trypsin at the C-terminal side of arginine and lysine but not at any specific site on the other end. The results of the search were rescored using a predicted spectral library, and a False Discovery Rate (FDR) analysis was done on the results. Rescoring allows us to use the sequence search results as a control, isolating the effects of what is effectively a spectral library search on predicted spectra. This technique enables the extrapolation of our conclusions to the general use of spectral library searching with predicted spectra.
Methods
Data
We used NIST high-resolution mass spectral libraries49, created using Orbitrap HCD spectra from human, mouse and Chinese hamster ovary cells (cell lines CHO-K1, CHO-S, CHO-DG44). The only libraries omitted were from iTRAQ experiments. The construction of the NIST spectral libraries has been discussed previously42,50. These libraries contain both consensus spectra and “best of” spectra from a set of replicates. The libraries include several modifications: carbamidomethyl cysteine, methionine oxidation, glutamine to pyro-glutamic acid, glutamic acid to pyro-glutamic acid, N-terminal acetylation, N-terminal pyro-carbamidomethyl cysteine, serine/threonine/tyrosine phosphorylation, and TMT6plex. Phosphopeptide identifications were taken from Sharma et al.51
The creation of test and validation sets had an additional step beyond random selection to ensure that their peptides were dissimilar from those in the training set. First, subsets of the complete non-redundant list of peptides were randomly chosen to be in either the validation or test sets. Peptides that mapped only to consensus spectra were moved to the training set. Next, all of the peptides in the validation set and test set were compared against each other and against the peptides in the training set using a normalized Levenshtein score to ensure their dissimilarity. Peptides in the validation and test sets that were too similar to peptides in the training set were removed from the validation and test sets and placed into the training set. Peptides were considered similar if their score was greater than 0.7 using the normalized similarity measure, which ranges from 0 for two strings requiring the maximum number of possible edits to 1.0, which denotes an exact string match. For purposes of testing, consensus spectra were filtered from the test and validation sets after their creation.
The network’s input embedding takes a peptide of length up to 40, charges 1+ to 8+, normalized collision energy (NCE), and the previously mentioned modifications. As is typical of proteomics data, the large majority of training spectra fall in a narrower range of characteristics than the extent of the data would suggest. For the training dataset, 96% of the spectra have charge states from 2+ to 4+, NCEs ranging from 25% to 38%, and peptide length from 6 to 30 residues. For the test and validation sets, only 94% of the spectra meet those criteria. The statistics of the datasets by the total number of spectra, mean peptide length, and the percentage of phosphopeptide spectra are shown in Table 1. The requirement that the test and validation sets contain sequence dissimilar peptides tends to enrich for longer peptides. The phosphopeptide spectra in the NIST library are not consensus spectra, so there are higher percentages of them in the test and validation sets.
Table 1.
Dataset statisticsa
| training | validation | test | |
|---|---|---|---|
| all | 2295094 | 10684 | 71484 |
| non-tryptic | 161357 | 331 | 2908 |
| phosphorylated | 57268 | 743 | 4449 |
| TMT | 569200 | 1852 | 13263 |
| oxidized | 260474 | 1765 | 10790 |
| acetylated | 11170 | 40 | 201 |
| pyro-glutamic acid | 3954 | 7 | 66 |
| pyro-CMC | 861 | 1 | 22 |
| peptide length | 14 | 19 | 18 |
summary statistics for the training, validation, and test data sets. Numbers of total spectra, non-tryptic spectra and spectra with various modifications are summarized, followed by the mean peptide length for each dataset.
Software Libraries
The evaluation methods and DNN were coded in Python using the PyTorch52, Bayesian-Torch53, Lightning54, Arrow, SciPy55, Pandas56, and Numpy57 libraries. Networks were trained on NVIDIA DGX-1 nodes. The evaluation and network code can be found at https://github.com/usnistgov/masskit and https://github.com/usnistgov/masskit_ai. The network contains 21M parameters. While use of the network is more efficient using a GPU, our libraries can run under a CPU as detailed in the documentation.
Losses and Metrics
The network takes the peptide sequence, precursor charge, modifications, and normalized collision energy as input. It then outputs a predicted spectra as an array of intensities indexed by mass/charge with fixed bin sizes of 0.1 Da as we found that smaller bin sizes lengthened training and did not improve scores. The loss used for training the network is a standard cosine similarity C applied to the predicted and library spectra expressed as fixed bin arrays. The evaluation metric used is the Stein-Scott58 dot product
| (1) |
where Qi are query spectrum ion intensities and Lj are library spectrum ion intensities. M is the set of all matched ions between the query and library spectra. Per convention, S ranges from 0–999, where 999 indicates a perfect match. When used as a similarity metric for evaluation, S is calculated using interval arithmetic where each interval corresponds to the peak width of each ion in each spectrum. Interval arithmetic is used for evaluation as it more precisely represents ppm resolution and allows for peaks of 0 width generated during upscaling, a procedure discussed below.
Annotating and Upscaling Predicted Spectra
To evaluate the ability of the network to predict various ion types, we generated theoretical spectra using the corresponding peptide sequence, precursor charge, and modifications for each test experimental spectrum. These theoretical spectra consisted of immonium ions, internal ions, parent ions, b1+, y1+, y2+, y3+, and a1+ ions. Neutral losses of water and ammonia were annotated for ion series of charge 1 and the parent ions. For phosphopeptides, the neutral losses for the ion series included H3PO4 and HPO3. These theoretical ions were matched to the experimental spectra. Predicted spectra were then generated and matched to the experimental spectra and any annotations on the experimental ions were applied to the matching predicted ions. If multiple experimental ions matched a predicted ion, the experimental ion with the closest intensity to the predicted ion was selected as a tiebreaker.
Upscaling.
This annotation mechanism also allows us to improve the mass/charge resolution of many predicted ions by first matching predicted spectra directly to theoretical spectra. When a match between a theoretical and predicted ion is unambiguous, the mass/charge of the theoretical ion replaces the mass/charge of the predicted ion, yielding a resolution that is equal to that of the theoretical ion calculations, +/− 0 ppm. 80% of the predicted ions with intensity > 5% of maximum were upscaled in our test set.
Sequence Search Evaluation
The test set, minus spectra with mass > 4200 daltons, were searched with Mascot 2.62 against the UniProt59 Chinese hamster, mouse and human proteomes, including isoforms. Decoy databases were created using OpenMS60 DecoyDatabase. Search settings different from the default were: semi-tryptic cleavage, 2 missed cleavages allowed, 20 ppm precursor ion tolerance, 0.02 Da product ion tolerance, 1 13C allowed, ESI-QUAD-type fragmentation, fixed modification of carbamidomethyl (C) and variable modifications of oxidation (M), acetyl (protein N-term), phospho (ST), phospho (Y), gln->pyro-glu, glu->pyro-glu, TMT6plex (K), TMT6plex (N-term), and pyro-carbamidomethyl.
For each query spectrum, we deleted any decoy matches that were the reverse of the query sequence, including and not including the C-terminal residue of both peptide sequences. For each peptide/spectrum match (PSM), the network was used to predict a spectrum for each matched peptide, using the same NCE as the query. A corrected S score was calculated between each predicted spectrum and the corresponding query spectrum. As shown in Figure S1, a correction was required as the significant threshold of the S score is dependent on the number of matched ions.
The 1% FDR score thresholds for the Mascot ions score and the corrected S score are calculated assuming matches with identical peptide sequence, charge, modifications and modification positions are true matches (T) and decoy matches are false matches (F). The FDR was determined by effectively searching the original and decoy databases separately and taking the top PSMs above threshold. To avoid overestimating the FDR, we omitted false hits to the original sequences. The expression used to calculate the FDR was F/(T+F)61.
Results and Discussion
Prediction Performance
Using the DNN, we predicted spectra that correspond to those from our test set, yielding a median similarity S of 695. Figure 1A displays an example non-tryptic peptide spectrum at the median score, where almost all major ions have been predicted with largely accurate intensities. Figure 1B is a representative phosphopeptide spectrum scoring at the test set’s 10th percentile of S scores, 536, showing that the majority of major ions are well predicted. Figure 2A is a histogram of all test set S scores. The network accurately predicts a wide variety of ion types, including ions generated from unknown mechanisms, that are from peptides dissimilar to those found in the training set. When comparing score values to other studies, it is important to note that, unlike some previous studies, the test set is sequence dissimilar to the training set. Additionally, all ions are included when scoring (not just an abridged set) and the score S is computed on the square roots of the intensities to avoid over-emphasizing high intensity ions. As detailed in Figures S2–S4, the results on the test set indicate that the network can make useful predictions on a wide range of peptide sizes, charges, and NCE values. Spectra with poor scores tend to have long amino acid repeats.
Figure 1.

Mirror plots of (A) a non-tryptic spectrum with score near the median prediction score and (B) a phosphopeptide spectrum with score near the bottom 10th percentile score. The blue spectrum at the top of each mirror plot is the experimental spectrum from the test set, annotated by ion series, including immonium ions (IQA, etc.), parent ions (p), and ions containing carbon-13 (+i). The red spectrum below is the matching predicted spectrum. The predicted phosphopeptide spectrum contains neutral loss ions that are useful for identifying and localizing phosphosites, as well as internal ions (Int/), immonium ions, and unannotated ions.
Figure 2.
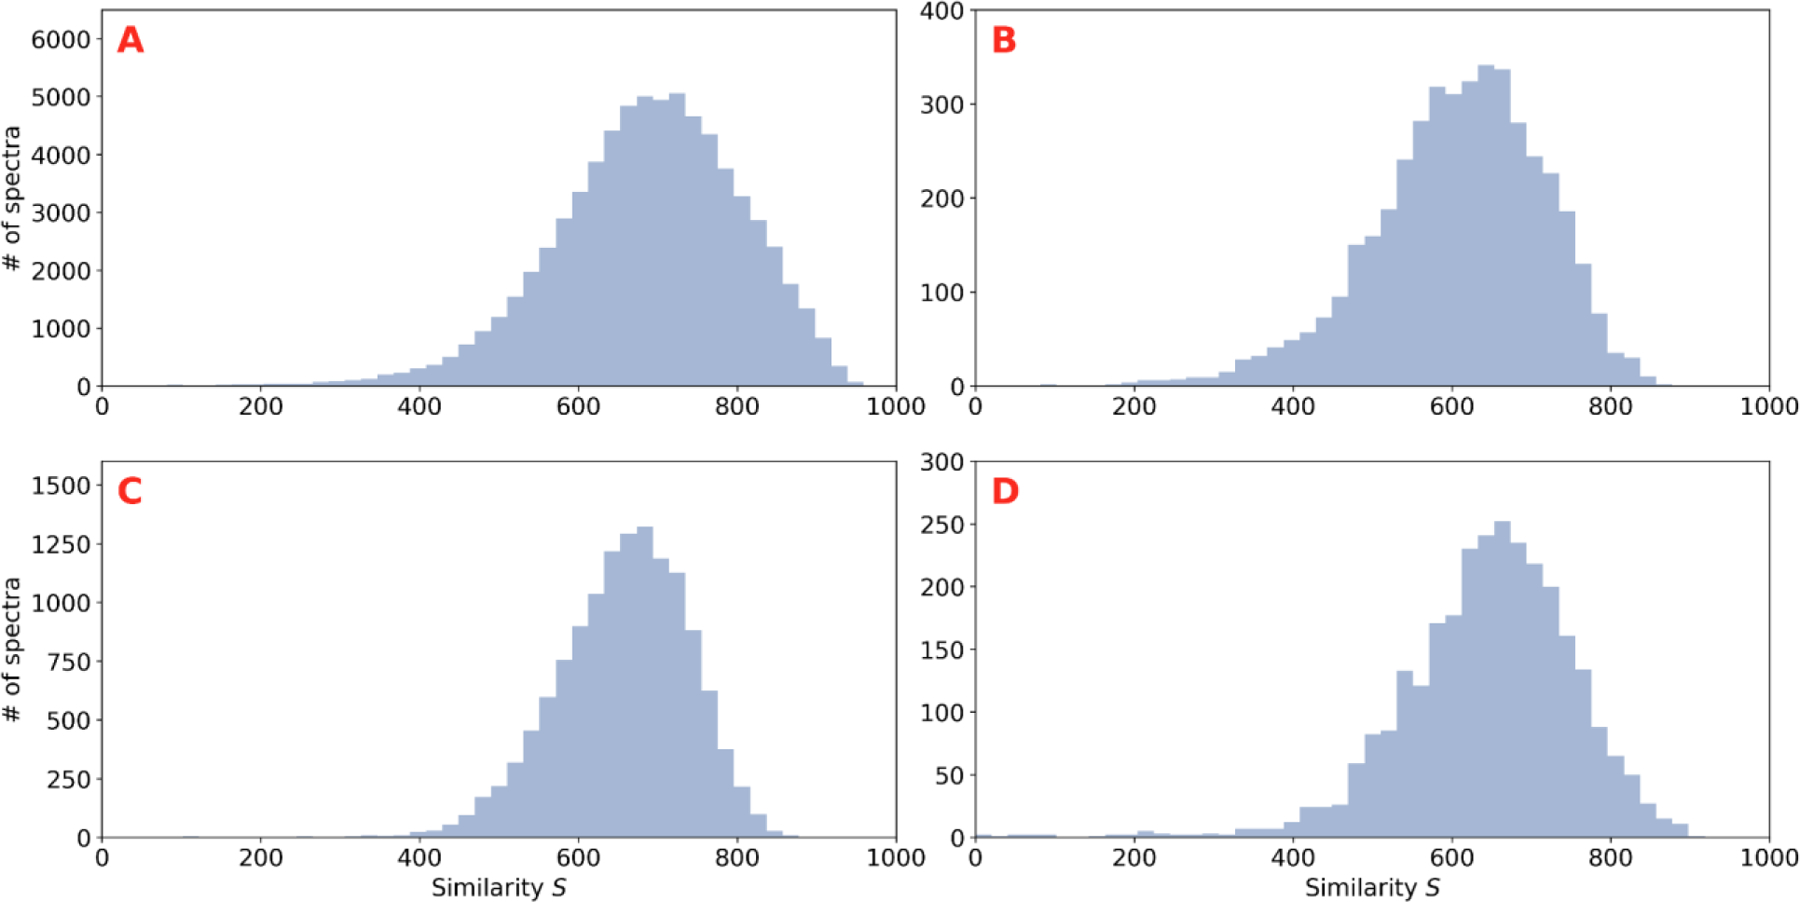
(A) Histogram of the similarity score S calculated between the experimental spectra and predicted spectra in the test set. (B) Histogram of S for the subset of the test set that contains the spectra of phosphopeptides. (C) Histogram of S for TMT derivatized peptides. (D) Histogram of S for non-tryptic peptides.
Of particular biological interest is the identification and localization of phosphorylation PTMs using spectra. A histogram of the similarity score S for phosphopeptides in the test set is shown in Figure 2B. The median score for phosphopeptide predictions is 617, with 90% of the predicted spectra scoring above 468. This indicates that the network predicts phosphopeptide spectra slightly worse than non-phosphopeptide spectra, which may be due to the fact that the training set contains only approximately 57,000 phosphopeptide spectra.
Peptide derivatization by TMT is a widely used technique in quantitative proteomics. The test set contains a number of TMT derivatized peptides, and a histogram of the similarity score S of these spectra is shown in Figure 2C. The predicted TMT spectra have a median score of 662 with 90% of the spectra scoring above 547, indicating that the prediction network may be useful in experiments that quantify protein abundance using TMT.
Non-tryptic peptides do not have arginine or lysine at their C-terminus. These peptides, found in our test set at the C-terminus of proteins or due to imperfect cleavage by trypsin, mimic nonspecifically cleaved peptides found in nature, including in the immunopeptidome. Figure 2D is a histogram of the S score for these peptides. The spectra predicted for these peptides have a median S score of 654 where 90% of the predictions score above 512, indicating the usefulness of the model for real world experiments where enzymes do not cleave perfectly, when other enzymes are used for protein digestion, and when analyzing naturally occurring peptides, such as those presented as antigens to the immune system.
Using Spectral Predictions to Rescore Sequence Search Results by Spectral Library Matching
Since we have found that the predicted spectra can closely model real spectra, we next set out to see if the predicted spectra could be used to improve the number of identified spectra when searching a large chemical space consisting of semi-tryptic peptides, multiple possible modifications, and multiple organisms. The search was performed using a popular sequence search algorithm, Mascot, and rescored using the same procedure as a spectral library search. As described in the methods, we searched the test set against the human, mouse and Chinese hamster proteomes. We also searched against reversed versions of these proteomes, which served as a decoy set to calculate the FDR rate of the searches. After combining all of the top PSMs from these searches, we predicted spectra for each match, using the NCE of the query spectrum when generating the predictions. For each PSM we calculated a corrected S score between the predicted spectrum and the query spectrum. The correction, detailed in the Supporting Information, adjusts the similarity score S by subtraction so that the score threshold is independent of the number of ions, and the correction can be negative to indicate lack of significance. Each PSM where the peptide sequence, charge, modifications, and modification locations of the match were identical to the query was designated a true match and all other matches were designated false.
Figure 3A depicts the histogram of the Mascot ions score for both true matches and false matches. Figure 3B shows the same histogram for the corrected S score. Decoy matches are not included in these histograms although they have the same general distribution as the false matches. The corrected S score performs several times better than the ions score in separating true matches from false matches. To compute this difference, we fit normal distributions to each true and false peak using maximum likelihood estimation, and then calculated the resolution as (μt - μf)/(σt + σf) where μt and σt are the mean and standard deviation of the true peak and μf and σf are the mean and standard deviation of the false peak. The improvement in resolution was 82% after rescoring.
Figure 3.

(A) Histogram of the Mascot ions score for both true and false matches to the test set spectra, searching against the human, mouse, and Chinese hamster proteome. (B) histogram of the corrected S score as applied to predicted spectra for the same search results as (A). The separation between true and false matches is improved by 82%.
To understand the effect of unannotated ions in the matches to predicted spectra, we computed corrected S scores using predicted spectra filtered of all unannotated ions. This resulted in an increase in resolution of only 24%, indicating the importance of these unannotated ions. This lower separation can be seen in Figure S5, which is a histogram of the corrected S score for predicted spectra that contain only annotated ions. Inspection of predicted spectra that score poorly after filtering reveal spectra with intense unannotated peaks and low intensity annotated peaks.
We then performed an FDR analysis of the corrected S score and ions score. To accomplish this, we swept the score threshold for both scores and calculated the FDR by using the top true match and top decoy match above the threshold for each test spectrum, taken from all matches returned by Mascot of the test spectra to the three proteomes and their decoys. The results are shown in Figure 4. The number of true matches above threshold for the corrected S score exceeds the true matches for the ions score except at very small values of the FDR.
Figure 4.

FDR analysis done before and after rescoring using test spectra as the queries. True matches are from the human, mouse, and Chinese hamster proteome and defined as those that match the peptide sequence, charge, and modifications of the query. Spectra were predicted for each Mascot sequence search match and a corrected Stein-Scott dot product S calculated to rescore the matches.
At 1% FDR, the ions score cutoff is 23 and the corrected S score threshold is 263. Table 2 describes increases and decreases in identifications of true spectra for various subsets of peptides. For unphosphorylated spectra, the net result of rescoring is to gain 8.2% more identifications. Examining phosphopeptides, 16.8% more identifications are made in net after rescoring, losing 2.4% of the search only identifications. TMT derivatized and non-tryptic peptides have a net increase of 9.2% and 20.9%, respectively.
Table 2:
Numbers of peptides identified before and after rescoring at 1% FDRa
| both | rescore only | % increase | search only | % decrease | |
|---|---|---|---|---|---|
| all | 60321 | 6337 | 10.3 | 1093 | 1.8 |
| unphosphorylated | 58010 | 5883 | 10.0 | 1037 | 1.8 |
| phosphorylated | 2311 | 454 | 19.2 | 56 | 2.4 |
| TMT | 11333 | 1114 | 9.8 | 68 | 0.6 |
| non-tryptic | 2210 | 509 | 22.7 | 35 | 1.6 |
“both” means true positive for both the sequence search and the rescoring, “rescore only” means true positive only after rescoring, and “search only” means true positive only before rescoring.
To investigate the causes of these gains, we examined the types of ion series present in true matches before and after rescoring. Unphosphorylated and phosphorylated peptides were examined separately in part due to the importance of neutral losses in identifying phosphopeptides.
Table 3 contains ion annotations for both phosphorylated and unphosphorylated spectra identified by Mascot searching before and after rescoring. The ion series omitted from the table showed no major changes. The values in the table are calculated only on matches to true peptides.
Table 3.
Mean Counts of Ion Types in True Matches for Search Results Before and After Rescoringa
| unphosphorylated | phosphorylated | |||||
|---|---|---|---|---|---|---|
| both | rescore only | search only | both | rescore only | search only | |
| peptide length | 18.2 | 18.4 | 21.0 | 20.7 | 21.9 | 28.1 |
| # ions | 61.4 | 63.0 | 61.7 | 81.5 | 89.1 | 81.5 |
| unannotated | 22.0 | 32.1 | 30.1 | 30.3 | 42.0 | 36.7 |
| y ions | 18.5 | 14.8 | 15.0 | 26.6 | 26.2 | 24.2 |
| b ions | 8.9 | 5.9 | 6.2 | 11.7 | 8.0 | 10.1 |
| a ions | 1.7 | 1.3 | 0.9 | 1.3 | 1.3 | 0.6 |
| neutral loss | 4.3 | 2.7 | 3.2 | 16.4 | 16.0 | 13.4 |
| internal | 6.9 | 5.2 | 6.2 | 6.5 | 6.4 | 5.0 |
| immonium | 2.3 | 2.5 | 1.8 | 2.7 | 3.0 | 1.9 |
| parent | 1.1 | 1.2 | 1.6 | 2.4 | 2.3 | 2.9 |
| parent intensity | 191.6 | 204.9 | 369.1 | 197.9 | 199.1 | 295.1 |
“both” means true positive for both the sequence search and the rescoring, “rescore only” means true positive only after rescoring, and “search only” means true positive only before rescoring.
For unphosphorylated spectra, the “rescore” spectra have larger numbers of unannotated ions compared to the set of spectra that scored well before and after rescoring. Predicted spectra ought to work better when matching spectra with large numbers of unannotated ions since sequence searches like Mascot do not calculate unannotated ions and can assume they are mismatches, lowering scores. As noted previously, almost all existing peptide spectra prediction models do not predict this type of ion. There are also fewer y, b, neutral loss and internal ions present in the rescore only set. The specificity of sequence search scores is dependent on the number of theoretical ions considered: the more the number of theoretical ions, the more potential false positive matches. Sequence search engines attempt to be parsimonious in the number of theoretical ions considered, but these numbers still tend to be in excess of the number of ions actually in the spectrum. Library spectra do not have this issue.
The unphosphorylated spectra that are positive in the “search only” set come from longer peptides and, as shown by the maximum parent intensity, dominated by intense parent ions. This may be due to the somewhat poorer prediction performance of the network for longer peptides, as indicated in Figure S4.
Like the unphosphorylated spectra, the phosphorylated spectra that are identified only after rescoring have a larger fraction of unannotated ions and fewer b ions. The small set of phosphopeptide spectra that are identified by “search only” are longer peptides with more intense parent ions. As with the unphosphorylated peptides, this may be due to the poorer prediction performance of the model for longer peptides.
Conclusions
In order to better identify peptides from complex biosamples that may be atypically cleaved or have multiple possible modifications, we used a deep neural network to predict complete HCD mass spectra that closely model experimental spectra. An important feature of this approach that is different from most other neural networks used to predict spectra is that predicting complete spectra does not require annotating training spectra, making it easier to train and predict modified spectra, including biologically relevant PTMs like phosphorylation. The ability of our network to generalize to multiple modifications indicates that it may be adequate to train a single large network instead of training many small networks.
Training with the NIST peptide spectral libraries generalized the network to a wide range of peptide lengths, charges, modifications, and NCE’s. This includes TMT modified peptides and non-tryptically cleaved peptides. The utility of the network was further improved by algorithmically upscaling 80% of the significant ions to a resolution at the limit of calculation.
By rescoring the identifications from a sequence search over a large chemical space using spectral library search methods, we show that spectral library searching using predicted spectra should significantly outperform sequence searches. In particular, the score separation between true and false matches increases by 82%, allowing for extensive exploration of chemical space. Matching predicted spectra that consist solely of annotated ions yields a score separation of 24%, revealing that most of the improvement in score separation is due to unannotated ions. Sequence searches and most peptide spectral prediction networks do not calculate these unannotated ions.
Our test set consists of high quality library spectra previously identified via sequence searches and whose peptides are sequence dissimilar to the training set, making improvements in identification difficult. However, by rescoring the sequence search of our test set, we show a net 8% increase in identifications of all peptides, a 21% increase in non-tryptic peptides and a 17% increase in identified phosphopeptides at 1% FDR. An analysis of the improved identifications indicates that the increase for phosphorylated and unphosphorylated peptides comes in large part from matching unannotated ions, not from canonical ion series. The increase for unphosphorylated peptides also appears due to fewer false positive matches to theoretical ions not actually present in the query or library spectra. These results are consistent with the general architecture of sequence search algorithms, as they match to theoretical spectra of typically unit intensity that rely entirely on the presence or absence of backbone cleavages at standard sites, while spectral searches focus on the full range intensities of any possible ion type. Predicting the complete spectra of modified and unmodified peptides, including ion types due to unknown or unannotated mechanisms, results in substantial improvements in the identification of peptide spectra in a large chemical space.
The main obstacle to the use of spectral libraries in proteomics has been incomplete coverage of the proteome, particularly for modifications. We have found that the use of AI predictions to supplement experimental spectral libraries, which we denote as “AIomics”, may overcome the barrier of limited coverage of the proteome by not only searching larger areas of the proteome but also by significantly improving the ability to discriminate between true and false hits. While these supplemented libraries should be useful in improving identifications from more extensive sequence searches and screening false positives from open searches, these results indicate that the benefits of directly searching mass spectral libraries can now be realized generally for deep exploration of the proteome.
For applications where the prediction uncertainty and set of modifications supported by the network are sufficient for regular use, it is possible to generate libraries that consist entirely of predicted spectra as there is no requirement to have experimental spectra when doing the predictions. We can conclude from our results that it will help in identification via searching, but whether this predicted-only approach works for particular applications such as Data Independent Acquisition (DIA) remains to be tested, but is a question of interest as predicting full spectra may allow the deconvolution of mixture spectra without requiring an experimental spectral library.
A specific application that may benefit from our method is the detection of the spectra of naturally occurring peptides, including immunopeptide spectra. Immunopeptides, especially MHC class I, are short, nonspecifically cleaved peptides that can originate from pathogens or neoplasms. Because the search space of immunopeptide spectra is very large and the number of ions in each spectra is relatively small, identification of these spectra is challenging. As described in the Results, the prediction performance of our network on non-tryptic peptide spectra approaches the performance on tryptic peptide spectra, making it likely that our method can help improve the detection of naturally occurring peptides.
There are multiple pragmatic benefits to the approach taken in this study: A single DNN can be trained using unannotated spectra to predict the complete spectra of peptides with many different modifications and types of cleavage. This DNN can be used centrally to augment experimental spectral libraries, eliminating any need for the special hardware and software typically required to run AI networks quickly. Finally, these augmented libraries can be searched by existing spectral library search algorithms, including those that demonstrate high performance17,62.
Supplementary Material
Figure S1. Stein-Scott correction.
Figures S2–S4. Variation of the similarity score S over features of the test set.
Figure S5. Score histograms for predicted spectra containing only annotated ions.
Acknowledgements
We are grateful to the NIST FARSAIT program for their support. We thank Dr. William E. Wallace for many useful comments and Dr. Sergey L. Sheetlin for helping us use the NIST peptide spectral library. The authors also appreciate the efforts of the reviewers in improving this paper. This research was conducted in part through the support of a NIST cooperative agreement with Georgetown University. This article is dedicated to the memory of Sanford P. Markey.
Footnotes
The authors declare no competing financial interests. All commercial instruments, software, and materials used in the study are for experimental purposes only. Such identification does not intend recommendation or endorsement by the National Institute of Standards and Technology, nor does it intend that the materials, software, or instruments used are necessarily the best available for the purpose.
Supporting Information
The following supporting information is available free of charge at ACS website http://pubs.acs.org
(PDF)
References
- (1).Eng JK; Jahan TA; Hoopmann MR Comet: An Open-Source MS/MS Sequence Database Search Tool. PROTEOMICS 2013, 13 (1), 22–24. 10.1002/pmic.201200439. [DOI] [PubMed] [Google Scholar]
- (2).Perkins DN; Pappin DJC; Creasy DM; Cottrell JS Probability-Based Protein Identification by Searching Sequence Databases Using Mass Spectrometry Data. Electrophoresis 1999, 20 (18), 3551–3567. . [DOI] [PubMed] [Google Scholar]
- (3).Shilov IV; Seymour SL; Patel AA; Loboda A; Tang WH; Keating SP; Hunter CL; Nuwaysir LM; Schaeffer DA The Paragon Algorithm, a Next Generation Search Engine That Uses Sequence Temperature Values and Feature Probabilities to Identify Peptides from Tandem Mass Spectra. Mol. Cell. Proteomics 2007, 6 (9), 1638–1655. 10.1074/mcp.T600050-MCP200. [DOI] [PubMed] [Google Scholar]
- (4).Eng JK; McCormack AL; Yates JR An Approach to Correlate Tandem Mass Spectral Data of Peptides with Amino Acid Sequences in a Protein Database. J. Am. Soc. Mass Spectrom 1994, 5 (11), 976–989. 10.1016/1044-0305(94)80016-2. [DOI] [PubMed] [Google Scholar]
- (5).Craig R; Beavis RC TANDEM: Matching Proteins with Tandem Mass Spectra. Bioinformatics 2004, 20 (9), 1466–1467. 10.1093/bioinformatics/bth092. [DOI] [PubMed] [Google Scholar]
- (6).Kim S; Pevzner PA MS-GF+ Makes Progress towards a Universal Database Search Tool for Proteomics. Nat. Commun 2014, 5 (1), 5277. 10.1038/ncomms6277. [DOI] [PMC free article] [PubMed] [Google Scholar]
- (7).Cox J; Mann M MaxQuant Enables High Peptide Identification Rates, Individualized p.p.b.-Range Mass Accuracies and Proteome-Wide Protein Quantification. Nat. Biotechnol 2008, 26 (12), 1367–1372. 10.1038/nbt.1511. [DOI] [PubMed] [Google Scholar]
- (8).Tu C; Sheng Q; Li J; Ma D; Shen X; Wang X; Shyr Y; Yi Z; Qu J Optimization of Search Engines and Postprocessing Approaches to Maximize Peptide and Protein Identification for High-Resolution Mass Data. J. Proteome Res 2015, 14 (11), 4662–4673. 10.1021/acs.jproteome.5b00536. [DOI] [PMC free article] [PubMed] [Google Scholar]
- (9).Tang WH; Halpern BR; Shilov IV; Seymour SL; Keating SP; Loboda A; Patel AA; Schaeffer DA; Nuwaysir LM Discovering Known and Unanticipated Protein Modifications Using MS/MS Database Searching. Anal. Chem 2005, 77 (13), 3931–3946. 10.1021/ac0481046. [DOI] [PubMed] [Google Scholar]
- (10).Solntsev SK; Shortreed MR; Frey BL; Smith LM Enhanced Global Post-Translational Modification Discovery with MetaMorpheus. J. Proteome Res 2018, 17 (5), 1844–1851. 10.1021/acs.jproteome.7b00873. [DOI] [PubMed] [Google Scholar]
- (11).Na S; Bandeira N; Paek E Fast Multi-Blind Modification Search through Tandem Mass Spectrometry. Mol. Cell. Proteomics 2012, 11 (4), M111.010199. 10.1074/mcp.M111.010199. [DOI] [PMC free article] [PubMed] [Google Scholar]
- (12).Bittremieux W; Laukens K; Noble WS Extremely Fast and Accurate Open Modification Spectral Library Searching of High-Resolution Mass Spectra Using Feature Hashing and Graphics Processing Units. J. Proteome Res 2019, 18 (10), 3792–3799. 10.1021/acs.jproteome.9b00291. [DOI] [PMC free article] [PubMed] [Google Scholar]
- (13).Yu F; Teo GC; Kong AT; Haynes SE; Avtonomov DM; Geiszler DJ; Nesvizhskii AI Identification of Modified Peptides Using Localization-Aware Open Search. Nat. Commun 2020, 11 (1), 4065. 10.1038/s41467-020-17921-y. [DOI] [PMC free article] [PubMed] [Google Scholar]
- (14).Yu F; Li N; Yu W PIPI: PTM-Invariant Peptide Identification Using Coding Method. J. Proteome Res 2016, 15 (12), 4423–4435. 10.1021/acs.jproteome.6b00485. [DOI] [PubMed] [Google Scholar]
- (15).Devabhaktuni A; Lin S; Zhang L; Swaminathan K; Gonzales C; Olsson N; Pearlman S; Rawson K; Elias JE TagGraph Reveals Vast Protein Modification Landscapes from Large Tandem Mass Spectrometry Data Sets. Nat. Biotechnol 2019, 37 (4), 469–479. 10.1038/s41587-019-0067-5. [DOI] [PMC free article] [PubMed] [Google Scholar]
- (16).Matthiesen R Solution to Dark Matter Identified by Mass-Tolerant Database Search. In Mass Spectrometry Data Analysis in Proteomics; Matthiesen R, Ed.; Methods in Molecular Biology; Springer: New York, NY, 2020; pp 231–240. 10.1007/978-1-4939-9744-2_9. [DOI] [PubMed] [Google Scholar]
- (17).Lam H; Deutsch EW; Eddes JS; Eng JK; King N; Stein SE; Aebersold R Development and Validation of a Spectral Library Searching Method for Peptide Identification from MS/MS. Proteomics 2007, 7 (5), 655–667. 10.1002/pmic.200600625. [DOI] [PubMed] [Google Scholar]
- (18).Deutsch EW; Perez-Riverol Y; Chalkley RJ; Wilhelm M; Tate S; Sachsenberg T; Walzer M; Käll L; Delanghe B; Böcker S; Schymanski EL; Wilmes P; Dorfer V; Kuster B; Volders P-J; Jehmlich N; Vissers JPC; Wolan DW; Wang AY; Mendoza L; Shofstahl J; Dowsey AW; Griss J; Salek RM; Neumann S; Binz P-A; Lam H; Vizcaíno JA; Bandeira N; Röst H Expanding the Use of Spectral Libraries in Proteomics. J. Proteome Res 2018, 17 (12), 4051–4060. 10.1021/acs.jproteome.8b00485. [DOI] [PMC free article] [PubMed] [Google Scholar]
- (19).Burke MC; Mirokhin YA; Tchekhovskoi DV; Markey SP; Heidbrink Thompson J; Larkin C; Stein SE The Hybrid Search: A Mass Spectral Library Search Method for Discovery of Modifications in Proteomics. J. Proteome Res 2017, 16 (5), 1924–1935. 10.1021/acs.jproteome.6b00988. [DOI] [PubMed] [Google Scholar]
- (20).Shiferaw GA; Vandermarliere E; Hulstaert N; Gabriels R; Martens L; Volders P-J COSS: A Fast and User-Friendly Tool for Spectral Library Searching. J. Proteome Res 2020, 19 (7), 2786–2793. 10.1021/acs.jproteome.9b00743. [DOI] [PubMed] [Google Scholar]
- (21).Zhang X; Li Y; Shao W; Lam H Understanding the Improved Sensitivity of Spectral Library Searching over Sequence Database Searching in Proteomics Data Analysis. PROTEOMICS 2011, 11 (6), 1075–1085. 10.1002/pmic.201000492. [DOI] [PubMed] [Google Scholar]
- (22).Schütz F; Kapp EA; Simpson RJ; Speed TP Deriving Statistical Models for Predicting Peptide Tandem MS Product Ion Intensities. Biochem. Soc. Trans 2003, 31 (6), 1479–1483. 10.1042/bst0311479. [DOI] [PubMed] [Google Scholar]
- (23).Li W; Ji L; Goya J; Tan G; Wysocki VH SQID: An Intensity-Incorporated Protein Identification Algorithm for Tandem Mass Spectrometry. J. Proteome Res 2011, 10 (4), 1593–1602. 10.1021/pr100959y. [DOI] [PMC free article] [PubMed] [Google Scholar]
- (24).Zhang Z Prediction of Low-Energy Collision-Induced Dissociation Spectra of Peptides. Anal. Chem 2004, 76 (14), 3908–3922. 10.1021/ac049951b. [DOI] [PubMed] [Google Scholar]
- (25).Zhang Z Prediction of Low-Energy Collision-Induced Dissociation Spectra of Peptides with Three or More Charges. Anal. Chem 2005, 77 (19), 6364–6373. 10.1021/ac050857k. [DOI] [PubMed] [Google Scholar]
- (26).Tiwary S; Levy R; Gutenbrunner P; Salinas Soto F; Palaniappan KK; Deming L; Berndl M; Brant A; Cimermancic P; Cox J High-Quality MS/MS Spectrum Prediction for Data-Dependent and Data-Independent Acquisition Data Analysis. Nat. Methods 2019, 16 (6). 10.1038/s41592-019-0427-6. [DOI] [PubMed] [Google Scholar]
- (27).Yang Y; Liu X; Shen C; Lin Y; Yang P; Qiao L In Silico Spectral Libraries by Deep Learning Facilitate Data-Independent Acquisition Proteomics. Nat. Commun 2020, 11 (1). 10.1038/s41467-019-13866-z. [DOI] [PMC free article] [PubMed] [Google Scholar]
- (28).Lin Y-M; Chen C-T; Chang J-M MS2CNN: Predicting MS/MS Spectrum Based on Protein Sequence Using Deep Convolutional Neural Networks. BMC Genomics 2019, 20 (S9), 906. 10.1186/s12864-019-6297-6. [DOI] [PMC free article] [PubMed] [Google Scholar]
- (29).Degroeve S; Martens L MS2PIP: A Tool for MS/MS Peak Intensity Prediction. Bioinformatics 2013, 29 (24). 10.1093/bioinformatics/btt544. [DOI] [PMC free article] [PubMed] [Google Scholar]
- (30).Guan S; Moran MF; Ma B Prediction of LC-MS/MS Properties of Peptides from Sequence by Deep Learning. Mol. Cell. Proteomics 2019, 18 (10). 10.1074/mcp.TIR119.001412. [DOI] [PMC free article] [PubMed] [Google Scholar]
- (31).Elias JE; Gibbons FD; King OD; Roth FP; Gygi SP Intensity-Based Protein Identification by Machine Learning from a Library of Tandem Mass Spectra. Nat. Biotechnol 2004, 22 (2). 10.1038/nbt930. [DOI] [PubMed] [Google Scholar]
- (32).Gessulat S; Schmidt T; Zolg DP; Samaras P; Schnatbaum K; Zerweck J; Knaute T; Rechenberger J; Delanghe B; Huhmer A; Reimer U; Ehrlich H-C; Aiche S; Kuster B; Wilhelm M Prosit: Proteome-Wide Prediction of Peptide Tandem Mass Spectra by Deep Learning. Nat. Methods 2019, 16 (6). 10.1038/s41592-019-0426-7. [DOI] [PubMed] [Google Scholar]
- (33).Ekvall M; Truong P; Gabriel W; Wilhelm M; Käll L Prosit Transformer: A Transformer for Prediction of MS2 Spectrum Intensities. J. Proteome Res 2022, 21 (5), 1359–1364. 10.1021/acs.jproteome.1c00870. [DOI] [PMC free article] [PubMed] [Google Scholar]
- (34).Zhou X-X; Zeng W-F; Chi H; Luo C; Liu C; Zhan J; He S-M; Zhang Z PDeep: Predicting MS/MS Spectra of Peptides with Deep Learning. Anal. Chem 2017, 89 (23), 12690–12697. 10.1021/acs.analchem.7b02566. [DOI] [PubMed] [Google Scholar]
- (35).Zeng W-F; Zhou X-X; Zhou W-J; Chi H; Zhan J; He S-M MS/MS Spectrum Prediction for Modified Peptides Using PDeep2 Trained by Transfer Learning. Anal. Chem 2019, 91 (15), 9724–9731. 10.1021/acs.analchem.9b01262. [DOI] [PubMed] [Google Scholar]
- (36).Tarn C; Zeng W-F PDeep3: Toward More Accurate Spectrum Prediction with Fast Few-Shot Learning. Anal. Chem 2021. 10.1021/acs.analchem.0c05427. [DOI] [PubMed] [Google Scholar]
- (37).Chalmers MJ; Kolch W; Emmett MR; Marshall AG; Mischak H Identification and Analysis of Phosphopeptides. J. Chromatogr. B Analyt. Technol. Biomed. Life. Sci 2004, 803 (1), 111–120. 10.1016/j.jchromb.2003.09.006. [DOI] [PubMed] [Google Scholar]
- (38).Quadroni M; James P Phosphopeptide Analysis. In Proteomics in Functional Genomics: Protein Structure Analysis; Jollès P, Jörnvall H, Eds.; Birkhäuser: Basel, 2000; pp 199–213. 10.1007/978-3-0348-8458-7_13. [DOI] [Google Scholar]
- (39).Liu K; Li S; Wang L; Ye Y; Tang H Full-Spectrum Prediction of Peptides Tandem Mass Spectra Using Deep Neural Network. Anal. Chem 2020, 92 (6). 10.1021/acs.analchem.9b04867. [DOI] [PMC free article] [PubMed] [Google Scholar]
- (40).Lapin J; Dong Q; Mak T; Slotta D; Geer L Characterizing the Out-of-Distribution Behavior of a Deep Machine Learning Model for Proteomics MS/MS Spectra Prediction; 70th ASMS Conference on Mass Spectrometry and Allied Topics, 2022.
- (41).Lapin J; Dong Q; Mak T; Slotta D; Geer L Uncertainty Quantification for Prediction of MS/MS Spectra via Deep Learning; 69th ASMS Conference on Mass Spectrometry and Allied Topics, 2021.
- (42).Sheetlin S; Wang G; Tchekhovskoi D; Zhang Z; Stein S Filtering and Optimization of Peptide Tandem Mass Spectral Libraries; 68th ASMS Conference on Mass Spectrometry and Allied Topics, 2020.
- (43).Stein S Mass Spectral Reference Libraries: An Ever-Expanding Resource for Chemical Identification. Anal. Chem 2012, 84 (17), 7274–7282. 10.1021/ac301205z. [DOI] [PubMed] [Google Scholar]
- (44).Michalski A; Neuhauser N; Cox J; Mann M A Systematic Investigation into the Nature of Tryptic HCD Spectra. J. Proteome Res 2012, 11 (11), 5479–5491. 10.1021/pr3007045. [DOI] [PubMed] [Google Scholar]
- (45).Zolg DP; Gessulat S; Paschke C; Graber M; Rathke‐Kuhnert M; Seefried F; Fitzemeier K; Berg F; Lopez‐Ferrer D; Horn D; Henrich C; Huhmer A; Delanghe B; Frejno M INFERYS Rescoring: Boosting Peptide Identifications and Scoring Confidence of Database Search Results. Rapid Commun. Mass Spectrom 2021. 10.1002/rcm.9128. [DOI] [PubMed] [Google Scholar]
- (46).Gabriel W; The M; Zolg DP; Bayer FP; Shouman O; Lautenbacher L; Schnatbaum K; Zerweck J; Knaute T; Delanghe B; Huhmer A; Wenschuh H; Reimer U; Médard G; Kuster B; Wilhelm M Prosit-TMT: Deep Learning Boosts Identification of TMT-Labeled Peptides. Anal. Chem 2022, 94 (20), 7181–7190. 10.1021/acs.analchem.1c05435. [DOI] [PubMed] [Google Scholar]
- (47).Wilhelm M; Zolg DP; Graber M; Gessulat S; Schmidt T; Schnatbaum K; Schwencke-Westphal C; Seifert P; de Andrade Krätzig N; Zerweck J; Knaute T; Bräunlein E; Samaras P; Lautenbacher L; Klaeger S; Wenschuh H; Rad R; Delanghe B; Huhmer A; Carr SA; Clauser KR; Krackhardt AM; Reimer U; Kuster B Deep Learning Boosts Sensitivity of Mass Spectrometry-Based Immunopeptidomics. Nat. Commun 2021, 12 (1), 3346. 10.1038/s41467-021-23713-9. [DOI] [PMC free article] [PubMed] [Google Scholar]
- (48).Na S; Choi H; Paek E Deephos: Predicted Spectral Database Search for TMT-Labeled Phosphopeptides and Its False Discovery Rate Estimation. Bioinformatics 2022, 38 (11), 2980–2987. 10.1093/bioinformatics/btac280. [DOI] [PubMed] [Google Scholar]
- (49).Libraries of Peptide Tandem Mass Spectra. https://chemdata.nist.gov/dokuwiki/doku.php?id=peptidew:cdownload (accessed 2020-07-20).
- (50).Dong Q; Liang Y; Yan X; Markey SP; Mirokhin YA; Tchekhovskoi DV; Bukhari TH; Stein SE The NISTmAb Tryptic Peptide Spectral Library for Monoclonal Antibody Characterization. mAbs 2018, 10 (3), 354–369. 10.1080/19420862.2018.1436921. [DOI] [PMC free article] [PubMed] [Google Scholar]
- (51).Sharma K; D’Souza RCJ; Tyanova S; Schaab C; Wiśniewski JR; Cox J; Mann M Ultradeep Human Phosphoproteome Reveals a Distinct Regulatory Nature of Tyr and Ser/Thr-Based Signaling. Cell Rep. 2014, 8 (5), 1583–1594. 10.1016/j.celrep.2014.07.036. [DOI] [PubMed] [Google Scholar]
- (52).Paszke A; Gross S; Massa F; Lerer A; Bradbury J; Chanan G; Killeen T; Lin Z; Gimelshein N; Antiga L; Desmaison A; Kopf A; Yang E; DeVito Z; Raison M; Tejani A; Chilamkurthy S; Steiner B; Fang L; Bai J; Chintala S PyTorch: An Imperative Style, High-Performance Deep Learning Library. 2019. 10.48550/arXiv.1912.01703. [DOI] [Google Scholar]
- (53).Ranganath Krishnan; Pi Esposito; Subedar M. Bayesian-Torch: Bayesian Neural Network Layers for Uncertainty Estimation, 2022. 10.5281/ZENODO.5908307. [DOI] [Google Scholar]
- (54).Falcon W; Borovec J; Wälchli A; Eggert N; Schock J; Jordan J; Skafte N; Ir1dXD; Bereznyuk V; Harris E; Tullie Murrell; Yu P; Præsius S; Addair T; Zhong J; Lipin D; Uchida S; Shreyas Bapat; Schröter H; Dayma B; Karnachev A; Akshay Kulkarni; Shunta Komatsu; Martin B; Jean-Baptiste SCHIRATTI; Mary H; Byrne D; Cristobal Eyzaguirre; Cinjon; Bakhtin A PyTorchLightning/Pytorch-Lightning: 0.7.6 Release, 2020. 10.5281/ZENODO.3828935. [DOI] [Google Scholar]
- (55).Virtanen P; Gommers R; Oliphant TE; Haberland M; Reddy T; Cournapeau D; Burovski E; Peterson P; Weckesser W; Bright J; van der Walt SJ; Brett M; Wilson J; Millman KJ; Mayorov N; Nelson ARJ; Jones E; Kern R; Larson E; Carey CJ; Polat İ; Feng Y; Moore EW; VanderPlas J; Laxalde D; Perktold J; Cimrman R; Henriksen I; Quintero EA; Harris CR; Archibald AM; Ribeiro AH; Pedregosa F; van Mulbregt P SciPy 1.0: Fundamental Algorithms for Scientific Computing in Python. Nat. Methods 2020, 17 (3), 261–272. 10.1038/s41592-019-0686-2. [DOI] [PMC free article] [PubMed] [Google Scholar]
- (56).McKinney W Data Structures for Statistical Computing in Python; Austin, Texas, 2010; pp 56–61. 10.25080/Majora-92bf1922-00a. [DOI] [Google Scholar]
- (57).Harris CR; Millman KJ; van der Walt SJ; Gommers R; Virtanen P; Cournapeau D; Wieser E; Taylor J; Berg S; Smith NJ; Kern R; Picus M; Hoyer S; van Kerkwijk MH; Brett M; Haldane A; del Río JF; Wiebe M; Peterson P; Gérard-Marchant P; Sheppard K; Reddy T; Weckesser W; Abbasi H; Gohlke C; Oliphant TE Array Programming with NumPy. Nature 2020, 585 (7825), 357–362. 10.1038/s41586-020-2649-2. [DOI] [PMC free article] [PubMed] [Google Scholar]
- (58).Stein SE; Scott DR Optimization and Testing of Mass Spectral Library Search Algorithms for Compound Identification. J. Am. Soc. Mass Spectrom 1994, 5 (9), 859–866. 10.1016/1044-0305(94)87009-8. [DOI] [PubMed] [Google Scholar]
- (59).The UniProt Consortium; Bateman A; Martin M-J; Orchard S; Magrane M; Agivetova R; Ahmad S; Alpi E; Bowler-Barnett EH; Britto R; Bursteinas B; Bye-A-Jee H; Coetzee R; Cukura A; Da Silva A; Denny P; Dogan T; Ebenezer T; Fan J; Castro LG; Garmiri P; Georghiou G; Gonzales L; Hatton-Ellis E; Hussein A; Ignatchenko A; Insana G; Ishtiaq R; Jokinen P; Joshi V; Jyothi D; Lock A; Lopez R; Luciani A; Luo J; Lussi Y; MacDougall A; Madeira F; Mahmoudy M; Menchi M; Mishra A; Moulang K; Nightingale A; Oliveira CS; Pundir S; Qi G; Raj S; Rice D; Lopez MR; Saidi R; Sampson J; Sawford T; Speretta E; Turner E; Tyagi N; Vasudev P; Volynkin V; Warner K; Watkins X; Zaru R; Zellner H; Bridge A; Poux S; Redaschi N; Aimo L; Argoud-Puy G; Auchincloss A; Axelsen K; Bansal P; Baratin D; Blatter M-C; Bolleman J; Boutet E; Breuza L; Casals-Casas C; de Castro E; Echioukh KC; Coudert E; Cuche B; Doche M; Dornevil D; Estreicher A; Famiglietti ML; Feuermann M; Gasteiger E; Gehant S; Gerritsen V; Gos A; Gruaz-Gumowski N; Hinz U; Hulo C; Hyka-Nouspikel N; Jungo F; Keller G; Kerhornou A; Lara V; Le Mercier P; Lieberherr D; Lombardot T; Martin X; Masson P; Morgat A; Neto TB; Paesano S; Pedruzzi I; Pilbout S; Pourcel L; Pozzato M; Pruess M; Rivoire C; Sigrist C; Sonesson K; Stutz A; Sundaram S; Tognolli M; Verbregue L; Wu CH; Arighi CN; Arminski L; Chen C; Chen Y; Garavelli JS; Huang H; Laiho K; McGarvey P; Natale DA; Ross K; Vinayaka CR; Wang Q; Wang Y; Yeh L-S; Zhang J; Ruch P; Teodoro D UniProt: The Universal Protein Knowledgebase in 2021. Nucleic Acids Res. 2021, 49 (D1), D480–D489. 10.1093/nar/gkaa1100. [DOI] [PMC free article] [PubMed] [Google Scholar]
- (60).Sturm M; Bertsch A; Gröpl C; Hildebrandt A; Hussong R; Lange E; Pfeifer N; Schulz-Trieglaff O; Zerck A; Reinert K; Kohlbacher O OpenMS – An Open-Source Software Framework for Mass Spectrometry. BMC Bioinformatics 2008, 9 (1), 163. 10.1186/1471-2105-9-163. [DOI] [PMC free article] [PubMed] [Google Scholar]
- (61).Elias JE; Gygi SP Target-Decoy Search Strategy for Increased Confidence in Large-Scale Protein Identifications by Mass Spectrometry. Nat. Methods 2007, 4 (3), 207–214. 10.1038/nmeth1019. [DOI] [PubMed] [Google Scholar]
- (62).Wang L; Liu K; Li S; Tang H A Fast and Memory-Efficient Spectral Library Search Algorithm Using Locality-Sensitive Hashing. Proteomics 2020, 20 (21–22), e2000002. 10.1002/pmic.202000002. [DOI] [PMC free article] [PubMed] [Google Scholar]
Associated Data
This section collects any data citations, data availability statements, or supplementary materials included in this article.
Supplementary Materials
Figure S1. Stein-Scott correction.
Figures S2–S4. Variation of the similarity score S over features of the test set.
Figure S5. Score histograms for predicted spectra containing only annotated ions.