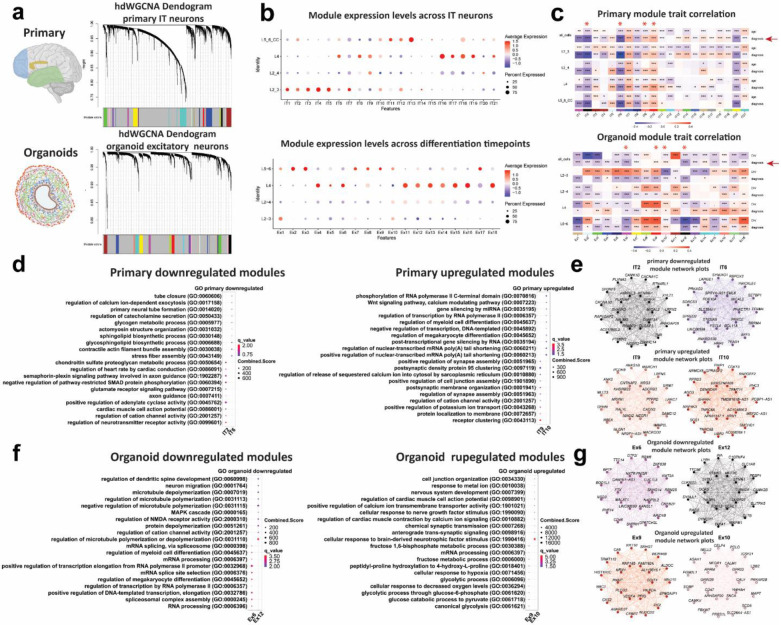
Figure 5. Weighted gene co-expression networks (WGCNA) of organoid and primary dup15q excitatory neurons.
a) WGCNA dendrogram of primary IT neurons and organoid excitatory neurons. Each leaf represents a single gene, colors on the bottom represent assignment of co-expression modules. b) Primary IT neurons and organoid excitatory module expression across different cell-types. c) Module trait correlation analysis. Red Asterix indicates down or upregulated modules that are associated with the dup15q genotype. d) primary IT neuron gene ontology (GO) of down and upregulated dup15q associated modules. e) Individual module network plots of primary IT neurons highlighting the top 25 hub genes for each network. f) Organoid excitatory neuron gene ontology (GO) of down and upregulated dup15q associated modules. g) Individual module network plots of organoid excitatory neurons highlighting the top 25 hub genes for each network.

