KMT2A translocations, the commonest abnormalities in acute lymphoblastic leukemia (ALL) in <1-year-old infants, are associated with poor outcomes,1-5 yet the prognostic significance of KMT2A-rearranged (KMT2A-R) versus KMT2A-germline (KMT2A-G) status and KMT2A partner genes is poorly understood in the context of demographic and clinical covariates. We investigated these variables in the Children’s Oncology Group (COG) P9407 trial for newly diagnosed infant ALL (clinicaltrials gov. Identifier: NCT00002756). This trial, designed to reduce early relapses by induction intensification, enrolled 221 infants (209 treatment-eligible) from June 1996-June 2006, and was amended in cohorts 2 and 3 for toxicities and hematopoietic stem cell transplantation lacking benefit.3 Specimens were collected under Pediatric Oncology Group (POG) 9900 or COG AALL03B1 with separate consent and individual Institutional Review Board approvals.3
Of 209 (199 treatment-eligible) cases analyzed, 157 (75.1%) (148/199 treatment-eligible; 74.4%) were KMT2A-R, and the rest were KMT2A-G. Partner genes in 5’-KMT2Apartner-3’ fusions were assigned to five categories similar to Interfant-99/Interfant-062,4 and COG AALL06315: AFF1 (n=78, 49.7%; 73/78 treatment-eligible); MLLT1 (n=33, 21.0%; 31/33 treatment-eligible); MLLT3 (n=14, 8.9%; 13/14 treatment-eligible); ‘other’ (n=20, 12.7%; all treatment-eligible); ‘unknown’ (n=12, 7.6%; 11/12 treatment eligible). ‘Other’ included all non-AFF1/non-MLLT1/non-MLLT3 partner genes: EPS15 (n=4), MLLT10 (n=1), ACER1 (n=1), ACTN4 (n=1), non-AFF1/non-MLLT1/non-MLLT3 not further classified (n=13). ‘Unknown’ included non-AFF1 not further classified (n=5; 4/5 treatment-eligible) and KMT2A-R not further classified (n=7; all treatment-eligible). COG P9407 used leukemia classification methods of the trial era including karyotype, fluorescence in situ hybridization, Southern blot and/or conventional polymerase chain reaction (PCR), and panhandle PCR analyses for unknown partner genes.6 While advanced genomics may detect covert rearrangements and improve partner gene assignments,7, 8 the 75.1% KMT2A-R in this study is comparable to 79%, 74%, and 70% in other large infant ALL clinical trials.2,4,5
Limitations notwithstanding, breakpoint heterogeneity and partner gene diversity were uncovered: one case had a 5’-KMT2A exon 9-AFF1 exon 11-3’ transcript outside the usual AFF1 exon 3-6 breakpoint region.9 Another had the partner genes ACTN4 and RYR1, both from 19q13.2, in 5’-KMT2A-partner-3’ and 5’-partner-KMT2A-3’ fusions, suggesting a new unbalanced t(11;19). ACTN4 and RYR1 have not occurred as partner genes in KMT2A-R infant ALL, but ACTN4 was reported in separate cases of treatment-related ALL and treatment-related MDS.10 ACER1 from 19p13.3 was reported in one case of infant ALL.11
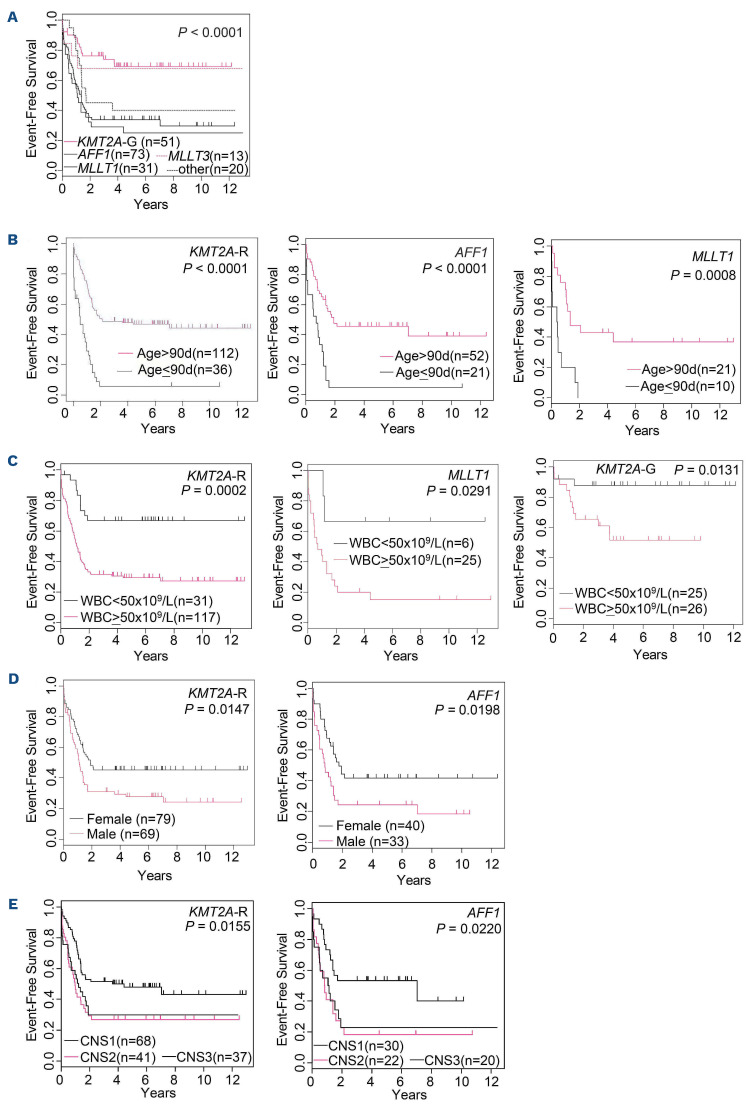
Five-year event-free survival (EFS) was: MLLT1, 25±9%; AFF1, 34±7%; ‘other’, 40±14%; MLLT3, 68±17%; KMT2A-G, 69±9% (log-rank test; P<0.0001) (Figure 1A). After treatment modifications ameliorated excessive toxicities, in cohort 3 5-year EFS was: MLLT1, 15±10%; AFF1, 33±10%; ‘other’, 39±15%; MLLT3, 73±27%; KMT2A-G, 70±13% (P=0.0004) (Online Supplementary Figure S1A), suggesting consistent impact of genetic subtypes.
The COG uses ≤90 days to define high-risk KMT2A-R infant ALL.5 Our microarray studies had revealed AFF1 case separation at ~90 days, with elevated expression of B-cell maturation genes in older versus interleukin, HSP, and HLA genes in younger infants,12 providing biological grounds for this cut-off. Consistently, in ≤90-day-old versus >90-dayold infants, 5-year EFS was worse among KMT2A-R overall (6±4% vs. 47±6%; P<0.0001); AFF1 (5±5% vs. 46±9%; P<0.0001); and MLLT1 (0% vs. 37±12%; P=0.0008) (Figure 1B). Using National Cancer Institute risk groups of white blood cell (WBC) count <50x109/L versus ≥50x109/L,13 5-year EFS was 76±7% versus 33±5% (P<0.0001) in treatment-eligible overall (Table 1); 67±10% versus 29±5% (P=0.0002) in all KMT2A-R; 67±22% versus 15±8% in MLLT1 (P=0.029); and 88±9% versus 52±14% in KMT2A-G (P=0.013) (Figure 1C).
Using Interfant-99 risk groups,2 5-year EFS was: high-risk (KMT2A-R with age <6 months and WBC count >300x109/L), 24±9%; intermediate-risk (IR) (KMT2A-R without these features), 41±6%; low-risk (LR) (KMT2A-G), 69±9% (overall P<0.0001; high-risk vs. IR; P=0.047) (Online Supplementary Figure S1B), suggesting better KMT2A-R separation when analyzed by partner gene, age ≤/>90 days, or WBC count </≥50x109/L (Figure 1A-C).
Figure 1.
Kaplan-Meier plots of event-free survival in COG P9407 trial. Event-free survival (EFS) in treatment-eligible infants estimated by Kaplan-Meier method as a function of: (A) KMT2A-G and KMT2A partner genes (11 treatment-eligible in category ‘unknown’ partner gene excluded); (B) age </>90 days in KMT2A-R overall (left), AAF1 (middle), and MLLT1 (right); (C) white blood cell (WBC) count </>50×109/L in KMT2A-R overall (left), MLLT1 (middle), and KMT2A-G (right); (D) male vs. female sex in KMT2A-R overall (left), and AAF1 (right); (E) central nervous system (CNS) status in KMT2A-R overall, and AAF1 (right). CNS1 (CNS-negative), CNS2 (positive cytomorphology but <5 WBC/µL), CNS3 (>5 WBC/µL and positive cytomorphology). (A-E) EFS calculated as time from diagnosis to first event (induction failure, relapse, secondary malignancy, remission death). Patients having no event were censored at last contact. Numbers of patients are indicated in the plots. P values calculated by log-rank test are at top right in the plots.
Male sex adversely affected 5-year EFS in KMT2A-R overall (28±6% vs. 45±7%, girls; P=0.0147) and AFF1 (24±9% vs. 42±10%, girls; P=0.0198) (Figure 1D). Five-year EFS for CNS1, CNS2, and CNS3 was 54±6%, 41±8%, and 33±10% (P=0.025) in treatment-eligible overall (Table 1); 48±7%, 27±8%, and 30±9% (P=0.0155) in all KMT2A-R; and 53±12%, 18±10%, and 23±12% (P=0.022) in AFF1 (Figure 1E).
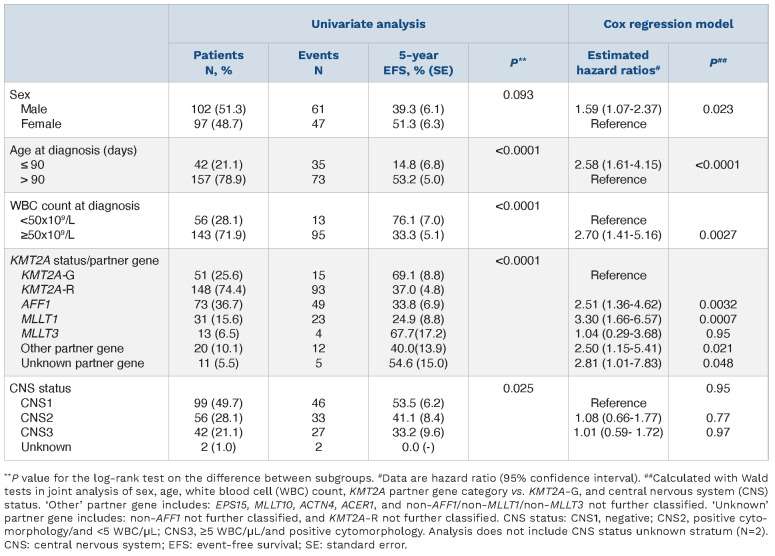
The impact of KMT2A-R versus KMT2A-G, partner genes, and demographic and clinical covariates was further studied using multivariable Cox regression models. After adjusting for sex, age, WBC, and central nervous system (CNS) disease at diagnosis, AFF1 (hazard ratio [HR]=2.51; P=0.0032), MLLT1 (HR=3.30; P=0.0007), ‘other’ (HR=2.50; P=0.021), and ‘unknown’ (HR=2.81; P=0.048) partner genes were significant for high risk, and MLLT3 had similar risk (HR=1.04; P=0.95) compared to KMT2A-G as reference. Age ≤90 days (HR=2.58; P<0.0001), WBC count ≥50x109/L (HR=2.70; P=0.0027), and male sex (HR=1.59; P=0.023) were associated with significantly higher risk (Table 1).
Separate multivariable analysis of KMT2A-R subtypes without KMT2A-G (Online Supplementary Table S1) revealed similar effects of age, WBC count, sex, and CNS disease, with all except CNS disease independently impacting outcome. Using AFF1 as reference, MLLT3 had lower observed risk (HR=0.41; P=0.15), and MLLT1 had higher observed risk (HR=1.34; P=0.27), but KMT2A-R subtypes did not reach significance. We also explored a model containing age as a continuous variable; age proved to be significant, and effects of all other covariates were similar to both models described above (Online Supplementary Table S1). Another model controlling for cohort 3 after therapy adjustments did not show an effect of treatment; KMT2A partner genes, age, WBC count, and sex retained independent impact on prognosis (Online Supplementary Table S1).
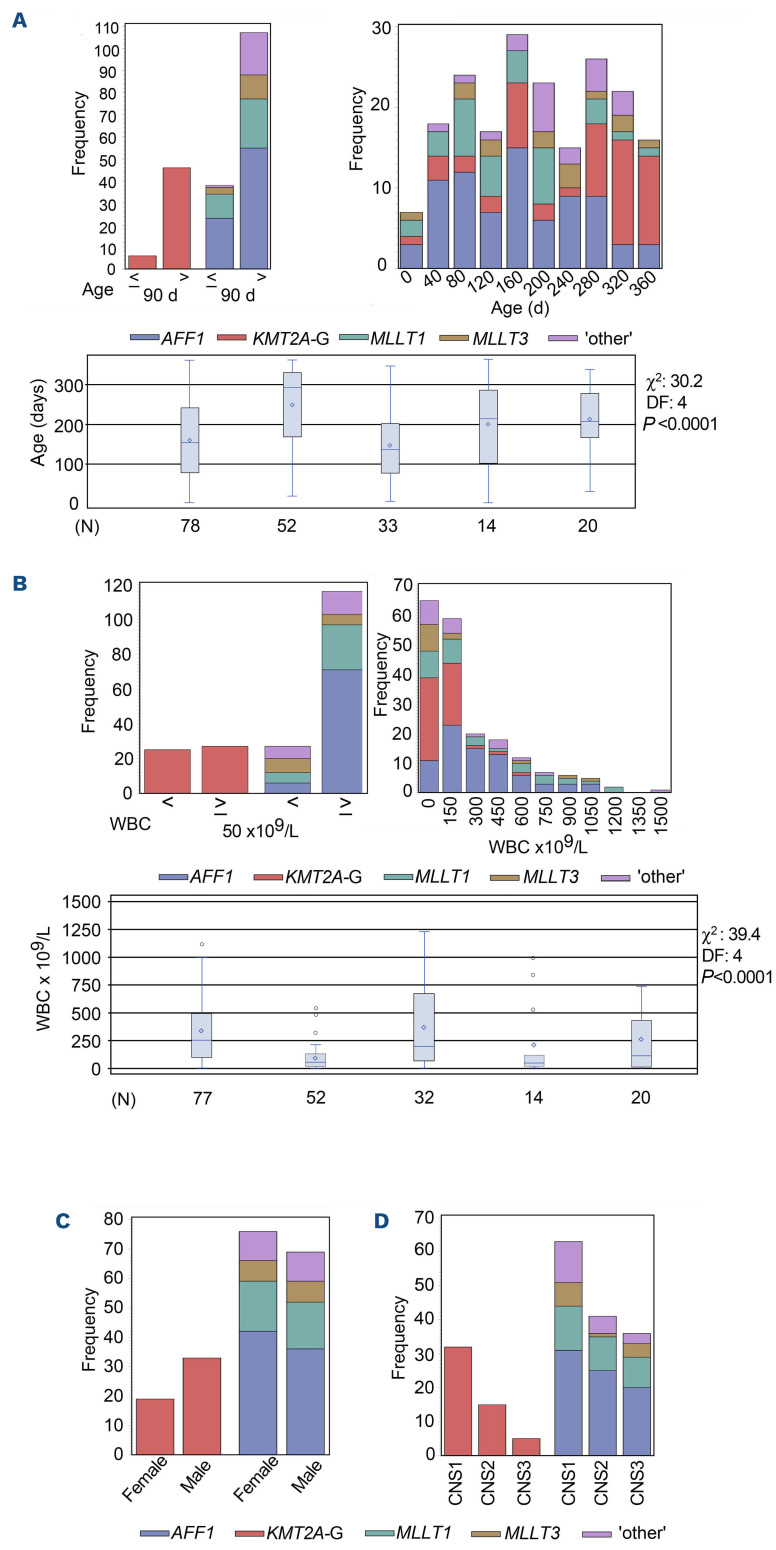
We then asked whether demographic or clinical covariates differed by genetic subtype. Age distribution differed among AFF1, MLLT1, MLLT3, ‘other’, and KMT2A-G (P<0.0001) (Figure 2A). Age ≤90 days was more common in KMT2A-R overall (40/157; 25.5%) than KMT2A-G (6/52; 11.5%) (P=0.036). Nineteen of 20 ‘other’ (i.e., all non-AFF1/non-MLLT1/non-MLLT3) (95%) occurred in >90-day-old infants versus 88 of 125 (70.4%) with any of these partner genes (P=0.026); 55 of 78 (70.5%) AFF1 (P=0.022); and 22 of 33 (66.6%) MLLT1 (P=0.020) (Online Supplementary Table S2).
Table 1.
Univariate and multivariable analyses of prognostic factors.
Figure 2.
Correlations of demographic and clinical covariates with KMT2A-G and KMT2A partner genes. Distributions among KMT2A-G and AFF1, MLLT1, MLLT3, and ‘other’ KMT2A-R genetic subtypes for all treatment-eligible and treatment-ineligible infants plotted by: (A) age at diagnosis ≤90 days (d) vs. >90 d (top left), and age as a continuous variable (top right). Box and whisker plots (bottom) indicate that distribution by age in days as a continuous variable differs among genetic subtypes (χ2 statistic 30.2; degrees of freedom (DF) 4; P<0.0001). Error bars represent range; horizontal lines, quartiles; and small diamond, the mean. (B) Presenting white blood cell (WBC) count <50x109/L vs. ≥50x109/L (top left), and as a continuous variable (top right). Box and whisker plots (bottom) indicate that WBC distribution as a continuous variable differs among genetic subtypes (χ2 statistic 39.4; DF 4; P<0.0001). (A, B) Distributions among genetic subtypes were compared by Kruskal-Wallis χ2 square-test; (C) sex; (D) central nervous system (CNS) status at diagnosis. (A-D) Cases in ‘unknown’ partner gene category were excluded.
WBC count differed among AFF1, MLLT1, MLLT3, ‘other’, and KMT2A-G (P<0.0001) (Figure 2B). WBC count was ≥50x109/L in 123 of 155 (79.4%) KMT2A-R versus 27 of 52 (51.9%) KMT2A-G (P=0.0003). WBC count was ≥50x109/L in higher proportions of AFF1 (71/77; 92.2%) versus any non-AFF1 partner gene (47/71; 66.2%) (P<0.0001); AFF1 versus MLLT3 (6/14; 42.9%) (P<0.0001); MLLT1 (26/32; 81.3%) versus MLLT3 (P=0.015); and any non-MLLT3 partner gene (110/129; 85.3%) versus MLLT3 (P=0.0008) (Online Supplementary Table S2).
The 45.9% male (n=72)/54.1% (n=85) female KMT2A-R differed from 63.5% male (n=33)/36.5% female (n=19) KMT2A-G (P=0.037). The 46.2% (n=36) male/53.8% (n=42) female AFF1 did not differ statistically from KMT2A-G (P=0.073) or any other partner subtypes (Figure 2C; Online Supplementary Table S2).
CNS1 occurred in 32 of 52 (61.5%) KMT2A-G versus 71 of 155 (45.8%) KMT2A-R overall (P=0.056); 32 of 77 (41.6%) AFF1 (P=0.032); and 13 of 33 (39.4%) MLLT1 (P=0.074). A higher proportion of KMT2A-G were CNS1 or CNS2 (47/52; 90.4%) versus KMT2A-R overall (117/155; 75.5%) (P=0.029); AFF1 (57/77; 74.0%) (P=0.024); and MLLT1 (23/33; 69.7%) (P=0.020) (Figure 2D; Online Supplementary Table S2).
In summary, this study demonstrates the impact of KMT2A partner genes on prognosis, and partner gene associations and interactions with demographic and clinical covariates. Univariate and multivariable analyses identify KMT2A-R subtypes (AFF1, MLLT1, ‘other’) with significantly decreased survival, and survival for MLLT3 equivalent to KMT2A-G, establishing independent prognostic significance of KMT2A partner genes compared to KMT2A-G. A separate multivariable model excluding KMT2A-G revealed non-significantly increased and decreased observed risks versus AFF1 for MLLT1 and MLLT3, respectively. The study further shows that age, WBC count, sex, and CNS disease are unevenly distributed and, in univariate analyses, partition EFS within genetic subtypes. Moreover, age, WBC count, and sex have independent prognostic significance in all multivariable models tested. Therefore, KMT2A partner genes, demographic and clinical covariates, and outcome in infant ALL are interrelated.
MLLT10 and the YEATS-domain-containing proteins MLLT1 and MLLT3 are DOT1L complex members. MLLT3 and AFF1 are Super Elongation Complex (SEC) members.14 Yet AFF1, MLLT1, and ‘other’ partner genes proved high-risk compared to KMT2A-G whereas, similar to pediatric AML,15 MLLT3 was favorable.
In contrast, CCG 1953 and Interfant-99 suggested poorer outcomes for all KMT2A-R including MLLT3,1,2 and Inter-fant-06 found higher risk for t(4;11)+t(11;19) together and t(9;11)+‘other’ together.4 Survival was worse among KMT2A-G with WBC count ≥50x109/L in our study, but not WBC count >300x109/L in Interfant-99/Interfant-06.16 In our study male sex adversely impacted EFS in KMT2A-R and AFF1 in univariate analysis, and in multivariable models, whereas Interfant-06 found higher EFS in boys than girls for KMT2A-R and KMT2A-G together by univariate analysis but no difference by sex in multivariable analysis.4
The disproportionate ≤90-day-old infants among AFF1 and MLLT1, and >90-day-old infants among ‘other’ here, and the 67% of t(11;19), but 31% of t(9;11) in <6-month-old infants in Interfant-99,2 agree with variable leukemia latencies by partner gene in murine models.17
Improved understanding of the spectrum of KMT2A partner genes relative to their complex interplay with demographic and clinical covariates is critical to discern high-risk infants. KMT2A fusion proteins involving members of the AF4 (AFF1) and ENL (MLLT1, MLLT3) protein families constitutively activate transcription by forming AEP (AF4/ENL/P-TEFβ) complexes, whereas different KMT2A fusion proteins alter transcription by varied mechanisms.18 Considering the partner gene heterogeneity and paucity of infant ALL with some ‘other’ partner genes, advanced genomics classification7,8 and pooling across trials are essential to discern and validate the prognostic importance of partner genes and demographic and clinical covariates, especially as transcription-targeting agents18 continue advancing.
Supplementary Material
Acknowledgments
SPH is the Jeffrey E. Perelman Distinguished Chair in the Department of Pediatrics. CAF was the Joshua Kahan Endowed Chair in Pediatric Leukemia Research. The authors would like to thank Dr. Mignon Loh for critical review and comments, and Juliet Kilcoyne for assistance with figure preparation.
Funding Statement
Funding: This investigation was supported by SCOR grant 7372-07 to CAF, CLW, MD, GHR and SPH from the Leukemia & Lymphoma Society, USA; R01CA80175 to CAF from the National Cancer Institute (NCI), National Institutes of Health (NIH), USA; and grants to Children’s Oncology Group (COG) including U10CA98543 (COG Chair’s Grant), U10CA98413 (COG Statistics and Data Center), U24CA114766 (COG Specimen Banking), U10CA180886 (NCTN Operations Center Grant), U10CA180899 (NCTN Statistics and Data Center), and U24CA196173 (COG Biospecimen Bank Grant) from the NCI, NIH, USA, and a grant from the St. Baldrick’s Foundation, USA.
References
- 1.Hilden JM, Dinndorf PA, Meerbaum SO, et al. Analysis of prognostic factors of acute lymphoblastic leukemia in infants: report on CCG 1953 from the Children's Oncology Group. Blood. 2006;108(2):441-451. [DOI] [PMC free article] [PubMed] [Google Scholar]
- 2.Pieters R, Schrappe M, De Lorenzo P, et al. A treatment protocol for infants younger than 1 year with acute lymphoblastic leukaemia (Interfant-99): an observational study and a multicentre randomised trial. Lancet. 2007;370(9583):240-250. [DOI] [PubMed] [Google Scholar]
- 3.Dreyer ZE, Hilden JM, Jones TL, et al. Intensified chemotherapy without SCT in infant ALL: results from COG P9407 (Cohort 3). Pediatr Blood Cancer. 2015;62(3):419-426. [DOI] [PMC free article] [PubMed] [Google Scholar]
- 4.Pieters R, De Lorenzo P, Ancliffe P, et al. Outcome of infants younger than 1 Year with acute lymphoblastic leukemia treated with the Interfant-06 Protocol: results from an international phase III randomized study. J Clin Oncol. 2019;37(25):2246-2256. [DOI] [PubMed] [Google Scholar]
- 5.Brown PA, Kairalla JA, Hilden JM, et al. FLT3 inhibitor lestaurtinib plus chemotherapy for newly diagnosed KMT2A-rearranged infant acute lymphoblastic leukemia: Children's Oncology Group trial AALL0631. Leukemia. 2021;35(5):1279-1290. [DOI] [PMC free article] [PubMed] [Google Scholar]
- 6.Robinson BW, Felix CA. Panhandle PCR approaches to cloning MLL genomic breakpoint junctions and fusion transcript sequences. Methods Mol Biol. 2009;538:85-114. [DOI] [PubMed] [Google Scholar]
- 7.Andersson AK, Ma J, Wang J, et al. The landscape of somatic mutations in infant MLL-rearranged acute lymphoblastic leukemias. Nat Genet. 2015;47(4):330-337. [DOI] [PMC free article] [PubMed] [Google Scholar]
- 8.Meyer C, Lopes BA, Caye-Eude A, et al. Human MLL/KMT2A gene exhibits a second breakpoint cluster region for recurrent MLL-USP2 fusions. Leukemia. 2019;33(9):2306-2340. [DOI] [PMC free article] [PubMed] [Google Scholar]
- 9.Nilson I, Reichel M, Ennas MG, et al. Exon/intron structure of the human AF-4 gene, a member of the AF-4/LAF-4/FMR-2 gene family coding for a nuclear protein with structural alterations in acute leukaemia. Br J Haematol. 1997;98(1):157-169. [DOI] [PubMed] [Google Scholar]
- 10.Yang JJ, Park TS, Lee ST, et al. Molecular characterization and clinical course of MLL-ACTN4 rearrangement in therapy-related hematologic malignancies. Haematologica. 2014;99(4):e49-51. [DOI] [PMC free article] [PubMed] [Google Scholar]
- 11.Meyer C, Burmeister T, Groger D, et al. The MLL recombinome of acute leukemias in 2017. Leukemia. 2018;32(2):273-284. [DOI] [PMC free article] [PubMed] [Google Scholar]
- 12.Kang H, Wilson CS, Harvey RC, et al. Gene expression profiles predictive of outcome and age in infant acute lymphoblastic leukemia: a Children's Oncology Group study. Blood. 2012;119(8):1872-1881. [DOI] [PMC free article] [PubMed] [Google Scholar]
- 13.Smith M, Arthur D, Camitta B, et al. Uniform approach to risk classification and treatment assignment for children with acute lymphoblastic leukemia. J Clin Oncol. 1996;14(1):18-24. [DOI] [PubMed] [Google Scholar]
- 14.Luo Z, Lin C, Guest E, et al. The super elongation complex family of RNA polymerase II elongation factors: gene target specificity and transcriptional output. Mol Cell Biol. 2012;32(13):2608-2617. [DOI] [PMC free article] [PubMed] [Google Scholar]
- 15.Balgobind BV, Raimondi SC, Harbott J, et al. Novel prognostic subgroups in childhood 11q23/MLL-rearranged acute myeloid leukemia: results of an international retrospective study. Blood. 2009;114(12):2489-2496. [DOI] [PMC free article] [PubMed] [Google Scholar]
- 16.van der Linden MH, Boer JM, Schneider P, et al. Clinical and molecular genetic characterization of wild-type MLL infant acute lymphoblastic leukemia identifies few recurrent abnormalities. Haematologica. 2016;101(3):e95-98. [DOI] [PMC free article] [PubMed] [Google Scholar]
- 17.Wong P, Iwasaki M, Somervaille TC, So CW, Cleary ML. Meis1 is an essential and rate-limiting regulator of MLL leukemia stem cell potential. Genes Dev. 2007;21(21):2762-2774. [DOI] [PMC free article] [PubMed] [Google Scholar]
- 18.Yokoyama A. Leukemogenesis via aberrant self-renewal by the MLL/AEP-mediated transcriptional activation system. Cancer Sci. 2021;112(10):3935-3944. [DOI] [PMC free article] [PubMed] [Google Scholar]
Associated Data
This section collects any data citations, data availability statements, or supplementary materials included in this article.


