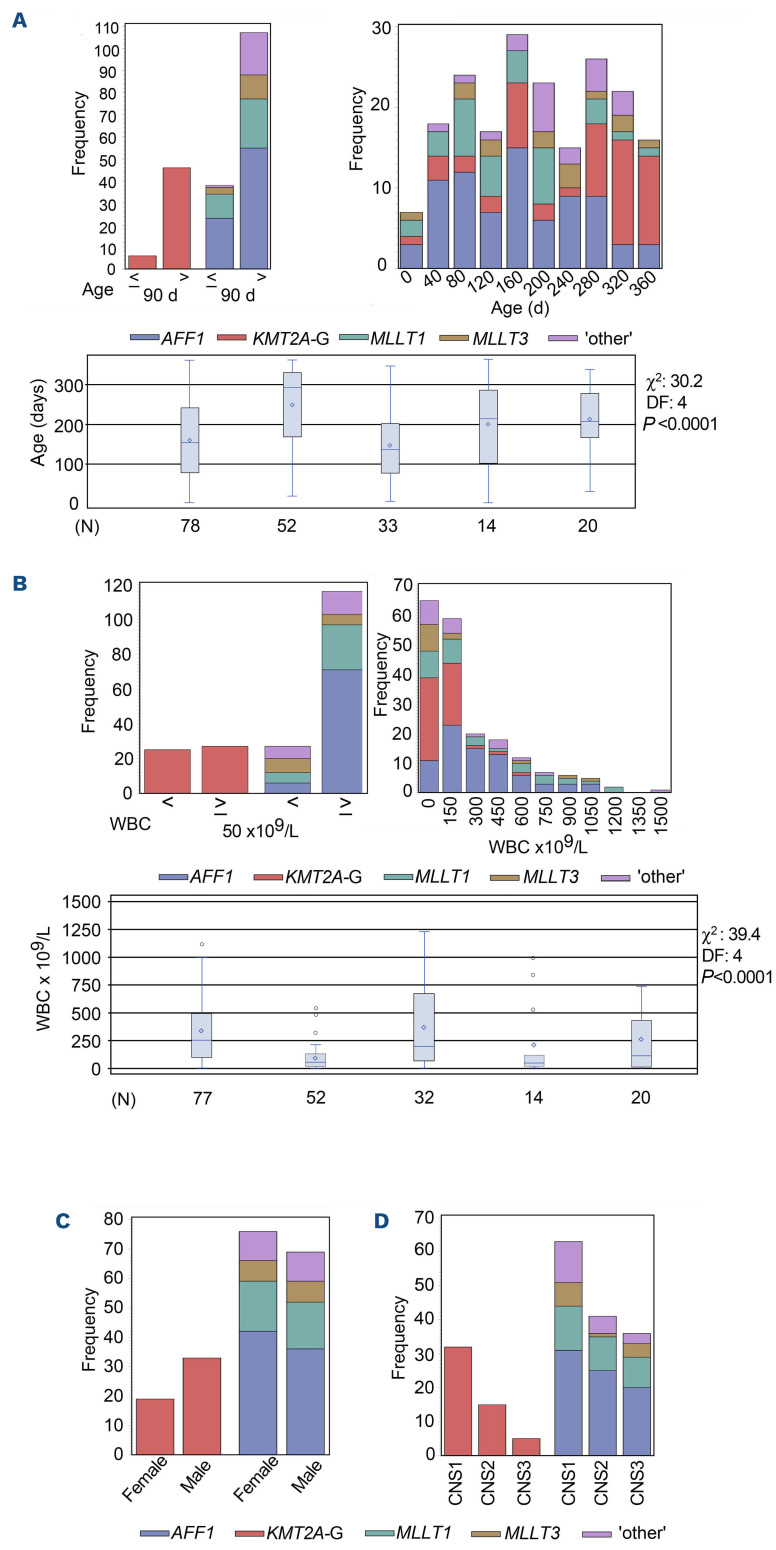
Figure 2.
Correlations of demographic and clinical covariates with KMT2A-G and KMT2A partner genes. Distributions among KMT2A-G and AFF1, MLLT1, MLLT3, and ‘other’ KMT2A-R genetic subtypes for all treatment-eligible and treatment-ineligible infants plotted by: (A) age at diagnosis ≤90 days (d) vs. >90 d (top left), and age as a continuous variable (top right). Box and whisker plots (bottom) indicate that distribution by age in days as a continuous variable differs among genetic subtypes (χ2 statistic 30.2; degrees of freedom (DF) 4; P<0.0001). Error bars represent range; horizontal lines, quartiles; and small diamond, the mean. (B) Presenting white blood cell (WBC) count <50x109/L vs. ≥50x109/L (top left), and as a continuous variable (top right). Box and whisker plots (bottom) indicate that WBC distribution as a continuous variable differs among genetic subtypes (χ2 statistic 39.4; DF 4; P<0.0001). (A, B) Distributions among genetic subtypes were compared by Kruskal-Wallis χ2 square-test; (C) sex; (D) central nervous system (CNS) status at diagnosis. (A-D) Cases in ‘unknown’ partner gene category were excluded.

