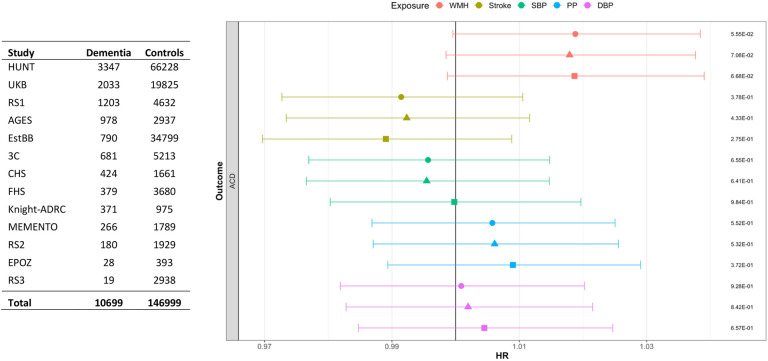
Figure 4: Forest plot showing the meta-analysis results of risk factor wGRSs (per standard deviation increase) with incident ACD.
Circle represents the model not adjusted for education level. Triangle represents the model adjusted for education. Square represents the model after further adjustment for interim stroke (prevalent stroke excluded). Association p-values are shown on the far right. ACD: all-cause-dementia. HUNT: Trøndelag health study, UKB: UK Biobank, RS: Rotterdam study, AGES: Age, Gene/Environment Susceptibility - Reykjavik study, EstBB: Estonian Biobank, 3C: Three-city, CHS: Cardiovascular Health Study, FHS: Framingham Heart Study, Knight-ADRC: Alzheimer’s Disease Research Centre, EPOZ: Epidemiological Prevention Study of Zoetermeer.

