

Abstract
Immunity at birth is considered immature. Following birth, our immune function is considered to grow and reach maturation over time. To obtain granular information of leukocyte functions and transcriptomic profiles in pediatric cohort, we examined leukocyte profiles in infants, preschool and school children using single cell RNA sequencing of their peripheral blood mononuclear cells (PBMCs). Monocytes and natural killer (NK) cells showed immaturity in infants. Their innate and adaptive immunity was developed by preschool age. Adaptive immune cells showed different maturation patterns. CD4, CD8 naïve T cells and plasma cells continued to mature untill school age. In CD8 naïve T cells, innate immunity was upregulated in infants, in support of our knowledge that they manifests more innate cell-like phenotype soon after birth. Many signaling pathways have been differentially up- and/or down-regulated in infants, preschool and school children. Their contribution to the development of the immune system needs to be delineated.
Keywords: Pediatric immune system, single cell RNA sequencing, maturation
Background
Immunity at birth is characterized as “immature” in comparison to adult immune systems. This is based on a number of studies that has compared the function of fetal/neonatal leukocytes to that of adult leukocytes1–4. In fact, early life is clinically associated with a strikingly elevated risk of infection5. As various organs continue to develop after birth, leukocytes presumably experience development towards maturity.
However, studies describing how leukocytes change over time by studying pediatric cohorts are rather limited. For example, Schmiedeberg et al. described T cells from infants as hyporeactive compared to adult T cells6, but did not study preschool and school aged children. During the COVID-19 pandemic, infants were the most vulnerable to SARS-CoV2 virus among pediatric cohorts7, suggesting that the function of immune cells would differ by age. Single cell RNA sequencing (scRNA seq) is an unbiased technique to characterize homogeneous immune cell populations. Here, we examined leukocyte transcriptomic profiles in infants, preschool and school aged children using scRNA seq.
Methods
PBMC purification
In this study, we examined leukocyte signatures in patients who underwent elective procedures between August 2020 and September 2021. The study was approved by the Institutional Review Board at Boston Children’s Hospital, and written informed consent was obtained from all patients’ family. If indicated, we also obtained assent. The study was registered in ClinicalTrials.gov (Trial number NCT04103268) and carried out in accordance with Declaration of Helsinki. We enrolled patients from 1 month of age to less than 18 years old who were otherwise healthy. We excluded patients with significant comorbidities such as immune deficiency, with an active infection, or a recent history of infection. Peripheral blood mononuclear cells (PBMCs) were isolated from blood using Ficoll-Paque Plus (Sigma-Aldrich, St. Louis, MO) per the company protocol. Then, PBMCs were suspended in the cell storage buffer and stored in the liquid nitrogen until scRNAseq.
3’RNA library preparation and sequencing
Following a fast thaw in 37°C water bath, cell viability was checked using Thermo Fischer Countess II FL with NucBlue staining. Any samples below 70% viability were subjected to dead cell removal via Annexin V bead conjugation to improve quality. Single cell RNA libraries were generated using the Chromium Single Cell 3’ kit (10x Genomics, Pleasanton, CA). The cells were counted and loaded onto the Chromium Controller. Loading was performed to target capture of ~3000 Gel beads-in-emulsion (GEMs) per sample for downstream analysis, and samples were processed through the Chromium Controller following the standard manufacturer’s specifications. The sequencing libraries were evaluated for quality on the Agilent TapeStation (Agilent Technologies, Palo Alto, CA), and quantified using Qubit 2.0 Fluorometer (Invitrogen, Carlsbad, CA). Pooled libraries were quantified using qPCR (Applied Biosystems, Carlsbad, CA) prior to loading onto an Illumina sequencing platform. The samples were sequenced at a configuration compatible with the recommended guidelines as outlines by 10x Genomics. Raw sequence data (.bcl files) were converted into fastq files and de-multiplexed using the 10x Genomics’ cellranger mkfastq command. Subsequent UMI and cell barcode deconvolution along with mapping to respective genome were performed using 10x Genomics’s Cell Ranger software package to generate the final digital gene expression matrices and cloupe files.
Single cell analysis
Cloupe files from each patient were merged using 10x Genomics Cloud analysis system. Cell population was annotated using canonical markers as described in Result section. Differentially expressed genes (DEGs) were defined by Log2>1 and P< 0.05. Up- and down-regulated DEGs were identified and subjected to biological function and KEGG pathway analysis using the Database for Annotation, Visualization, and Integrated Discovery (DAVID)8,9.
Statistical analysis
Statistical analysis was performed using PRISM9 software (GraphPad, La Jolla, CA). Detailed statistical analysis was described in the corresponding figure legends. Statistical significance was considered significant when P< 0.05.
Results
Transcriptomic signature of PBMCs from children
To study the immunological profiles of pediatric cohort, we conducted scRNA seq analysis of PBMCs from nine children, consisting of three infants, three pre-school aged children, and three school aged children. The basic profile of healthy participants is shown in Suppl Table 1. Single-cell suspensions were converted to barcoded scRNAseq libraries using 10x Genomics. The sequencing data was processed by Cell Ranger software and passed stringent filtering. All nine samples were sequenced, and 68,236 cells were used for subsequent analysis.
Using t-distributed stochastic neighbor embedding (t-SNE), we identified monocytes, granulocytes, natural killer (NK) cells, T cells and B cells via the expression of canonical lineage markers (Fig. 1a, Suppl. Fig. 1–4). Monocytes, T cells, and B cells were further classified into their subsets. The heatmap comparing each cell type is shown in Fig. 1b. When the Ficoll-Paque density purification method is used, the majority of granulocytes is accumulated in normal density granulocyte fraction10. However, granulocytes are also accumulated in PBMC fraction as low-density granulocytes11,12. Accordingly, we identified granulocytes in our PBMC fraction. For the remaning analysis, we focused on non-granulocyte leukocytes because we did not collect granulocytes in the normal-density fraction for sequencing. We first compared the percentage of each cell composition in PBMCs for infants, preschool and school aged children (Fig. 1c–d). CD4 effector/memory T cells were seen more in school aged children (Fig. 1d) compared to infants. CD8 naïve T cells were observed more in infants (Fig. 1d). This is consistent with the finding from others that CD8 naïve T cells circulate less in older subjects13. NK cells were more prevalent in school aged children within PBMCs compared to infants (Fig. 1d).
Figure 1. Annotation of PBMCs and comparison across infants, preschool and school children.

(a) Blood PBMCs were purified using Ficoll-Paque method and subjected to single cell RNA sequencing. Granulocytes, monocytes, NK cells, T cells and B cells were annotated. Infant, preschool and school children t-SNE were shown.
(b) The heatmap for classical monocytes, intermediate/non-classical monocytes, NK cells, CD4 naïve T cells, CD4 effector T cells, CD8 naïve T cells, CD8 effector T cells, immature B cells, mature B cells and plasma cells.
(c) The percentage of each cell type within PBMCs was shown for infant, preschool and school children. Each age group was consisted of three patients, and the average value from three patients was shown.
(d) The percentage of each cell type within PBMCs was shown for infant, preschool and school children. Each group was consisted of three patients. Data was shown as mean +/− S.D. of three patients in the violin plot. One-way ANOVA with Bonferroni post hoc analysis was performed for statistical analysis. * p< 0.05.
We described each cell type individually below. We compared transcriptomic signatures of each cell type among three age groups (infants, pre-school and school age) to delineate age-dependent changes.
Monocyte analysis
We annotated monocytes based on CD14, S100A12, FCGR3A (CD16), FCGR1B, CD33 and CD68 expression (Suppl Fig. 1a). Monocytes are often classified into classical monocytes (CD14+CD16−), and intermediate/non-classical monocytes (CD14+/CD16+) on flow cytometry basis14. Classical monocytes are released from the bone marrow and mature into intermediate/non-classical monocytes15. Accordingly, we classified monocytes into classical monocytes and intermediated/non-classical monocytes here (Suppl Fig. 1b–c).
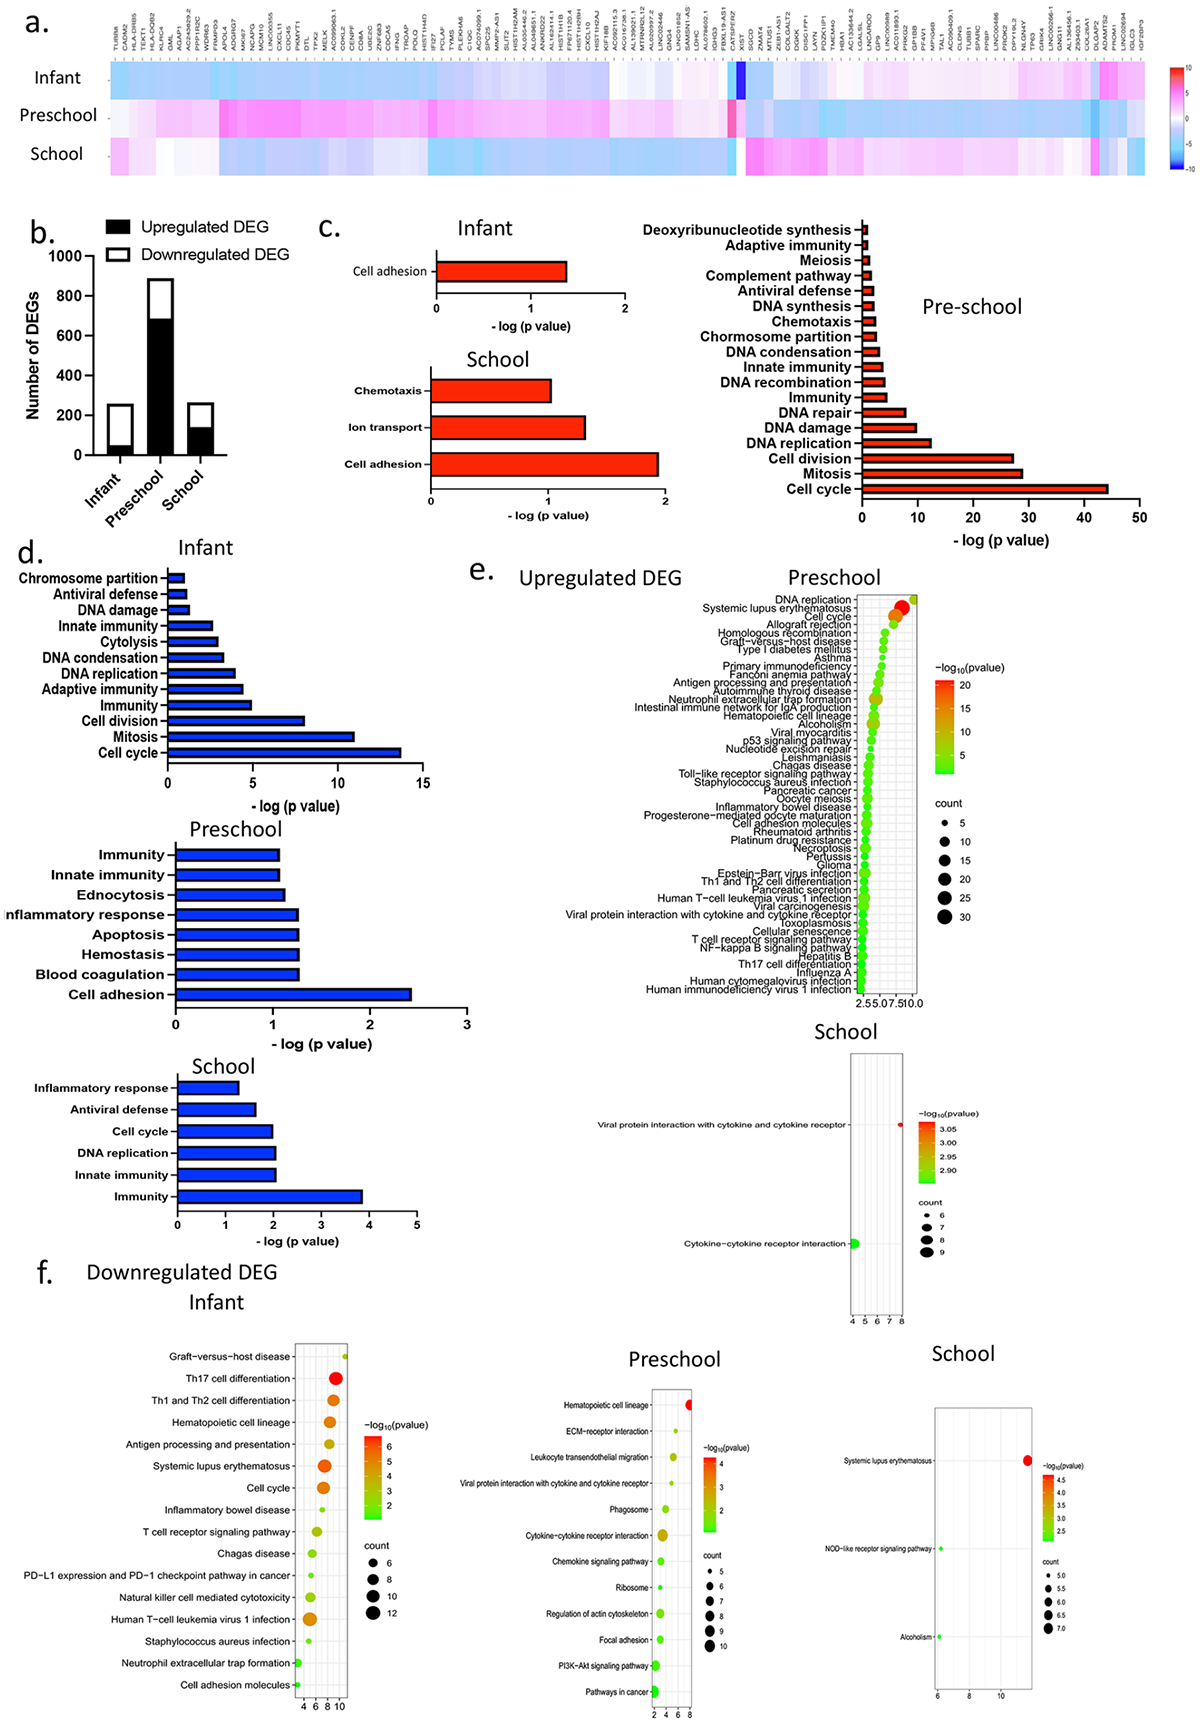
Classical monocytes are the major monocyte population (Fig. 1d). Classical monocytes are highly phagocytic and important scavenger cells16. The heatmap showed that each age-group had a unique gene expression pattern (Fig. 2a). First, we determined up-regulated and down-regulated DEGs in the infant group, preschool group and school group. DEGs were seen least in infants (Fig. 2b). Biological functions were examined using ontology analysis. Infants showed a downregulation of chemotaxis, innate and adaptive immunity, and antiviral defense (Fig. 2d). In contrast, preschool children had an upregulation of innate immunity and antiviral defense (Fig. 2c). In school age, host-virus interaction was upregulated. These suggested that classical monocytes were immature as their host defense cells in infants, but they seemed to gain their functionality by pre-school age.
Figure 2. Classical monocyte ontology analysis.

(a) The heatmap of classic monocytes comparing infant, preschool and school children.
(b) The number of DEGs for each age group.
(c) Biological ontology analysis of upregulated DEGs in classical monocytes.
(d) Biological ontology analysis of downregulated DEGs in classical monocytes.
(e) Enrichment bubble plot of upregulated DEGs.
(f) Enrichment bubble plot of downregulated DEGs.
Next, we examined signaling pathways that classical monocytes differentially use at each age group on Kyoto Encyclopedia of Genes and Genomes (KEGG) pathway analysis and presented in enrichment plots (Fig. 2e–f). Janus kinase-signal transducers and activators of transcription (JAK-STAT) signal contributes to 1) maturation of monocytes into functional phagocytes and 2) activation of proinflammatory genes. In the previous investigation, JAK-STAT signal was significantly activated in fetal classical monocytes compared to adult classical monocytes17. JAK-STAT signal was downregulated in pre-school patients (Fig. 2f). In addition, infants showed the downregulation of antigen processing and presentation (Fig. 2f). This may indicate that monocyte maturation has occurred by preschool, which is consistent with our biological ontology analysis above (Fig. 2d). NOD-like receptor (NLR) signaling pathway was upregulated in the pre-school group (Fig. 2e) but downregulated in the school age group (Fig. 2f). NLR signaling pathway is involved in inflammatory response, cell death and neutrophil extracellular traps (NETs) in general18,19. The role of NLR signal in monocytes includes preferential differentiation of monocytes toward monocyte-derived dendritic cells (DCs) over monocyte-derived macrophages20. NOD2 receptor converts monocytes into patrolling monocytes (non-classical monocytes)21. Sphingolipid signaling pathway was upregulated in the school age group (Fig. 2e). The role of sphingolipids in monocytes includes monocyte-to-macrophage differentiation using monocytic cell line22,23,24. Whether or not NLR and sphingolipid signaling pathways affect monocyte differentiation at preschool and school age needs to be determined in the future.
Intemediate monocyte function includes the production of reactive oxygen species (ROS), antigen presentation, assist of T cell proliferation25. Non-classical monocytes patrol the endothelium for injury16. Regarding intermediate/non-classical monocytes, a unique transcriptomic profile for each age group was observed on the heatmap (Fig. 3a). The number of DEGs was highest in the preschool group (Fig. 3b). Different from the pattern seen in classical monocytes, The number of DEGs for intermediate/non-classical monocytes was least in infants as in classical monocytes, but also low in school aged children. We annotated biological functions. Similar to classical monocytes, intermediate/non-classical monocytes in infants had downregulation of innate, adaptive immunity and antiviral defense (Fig. 3d). In contrast, innate and adaptive immunity was upregulated in preschool children (Fig. 3c). In KEGG pathway analysis, we observed upregulation of antigen precessing and presentation in preschool, while downregulated in infants, compatible with the biological annotation result (Fig. 3e). This suggests that intermediate/non-classical monocytes were undergoing maturation in infants (Fig. 3f), similar to classical monocytes. With surprise, innate immunity was downregulated in school aged children (Fig. 3d). Innate immunity gene consisted of interferon induced genes (IFIT2, IFITM3) and complement (C1qb, C1qc). Age-dependent change of interferon basal production has been noted in the context of COVID study26. In the study, it was attenuated in young adults. Because interferon stimulated genes (ISGs) are critical for antiviral defense and acquired immunity27, it is critical to determine their detailed profiles in different age groups.
Figure 3. Intermediate/non-classical monocyte ontology analysis.
(a) The heatmap of intermediate/non-classical monocytes comparing infant, preschool and school children.
(b) The number of DEGs for each age group.
(c) Biological ontology analysis of up-regulated DEGs in intermediate/non-classical monocytes
(d) Biological ontology analysis of down-regulated DEGs in intermediate/non-classical monocytes
(e) Enrichment bubble plot of upregulated DEGs.
(f) Enrichment bubble plot of downregulated DEGs.
NK cell analysis
We annotated NK cells based on NKG7, GZMB, GNLY and CD160 expression patterns (Suppl Fig. 2a). NK cells are cytotoxic innate lymphocytes that can lyse virally infected cells. NK cell cytotoxicity results from several biological steps; recognition of and binding to a target cell, lysis of the target, and repetition of lytic sequence by recycling. The cytolytic function of NK cells was reported impaired at the neonate period28. However, it reaches adult level in early infants. NK cells also produce cytokines such as IFNγ that shape innate and adaptive immune responses29. In our analysis, a limited number of genes was identified as DEGs in NK cells (Suppl Fig. 2b) different from classical monocytes and intermediate/non-classical monocytes (Fig. 2b and Fig. 3b). We annotated biological functions. Preschool children showed the upregulation of innate and adaptive immunity (Suppl Fig. 2c). This may go along with the knowledge that NK cells functionally mature in early infancy. In constrast, their downregulation was observed in school aged children (Suppl Fig. 2d). Next, KEGG pathway analysis was performed. We observed significant ontology of upregulated DEGs only in preschool children and of downregulated DEGs only in school aged children (Suppl Fig. 2e–f). In mice, NK cell activity reaches its maximum during the first 6 to 8 weeks of life and decrease thereafter30. Thus, our result may potentially indicate that NK cells have their peak earlier in life. NETs formation was upregulated in pre-school children (Suppl Fig. 2e) and downregulated in school aged children (Suppl Fig. 2f). The result was consistent with biological annotation described above. NK cells trigger the formation of NETs by neutrophils through the production of IFNγ31. IFNγ production in NK cells is triggered by a number of stimuli via various pathways including IL-2, IL-12, IL-18 receptor signaling pathways32. NK cells consist of CD56dim and CD56bright cells. CD56dim NK cells produced more IFNγ than CD56bright NK cells33. In our analysis of intermediate/non-classical monocytes above, we observed that ISGs were downregulated in school-aged children. Thus, determining IFN profiles in different age groups is important.
B cell analysis
We annotated immature B cells, mature B cells and plasma cells based on CD19, CD79a, Il7r, and IGKC expression patterns (Suppl Fig. 3a–d).
Immature B cells exist the bone marrow and undergoes maturation in the spleen34. The transcriptomic profiles of immature B cells were compared among infants, preschool children and school aged children. The heatmap profile showed similarity among the three groups (Suppl Fig. 3e). The number of DEGs was low, but highest in infants (Suppl Fig. 3f). As expected, adaptive immunity was downregulated in infants (Suppl Fig. 3h), while upregulated in school age (Suppl Fig. 3g). KEGG pathway analysis of downregulated DEGs for infants showed apoptosis and Toll-like receptor (TLR) signaling (Suppl Fig. 3i). Because TLR signaling augments innate and adaptive immune functions of B cells35, our result was in line with the downregulated innate and adaptive immunity in infants. Self-reactive immature B cells undergo apoptosis for cloncal tolerance36. Whether or not infant immature B cells have limited B cell receptors (BCRs) or are less sensitive to signals needs to be determined.
Mature B cells are specialized cells to produce antibody. They are also capable of producing cytokines37. Mature B cell transcriptomic heatmap showed that the three age groups had distinct profiles (Fig. 4a). Up- and down-regulated DEGs were determined for infants, preschool and school groups. The infant group had the highest number of DEGs among them, similar to immature B cells (Fig. 4b). Biological annotation showed a downregulation of innate and adaptive immunity in infants (Fig. 4d), while preschool children had an upregulation of immunity (Fig. 4c). This is in line with the upregulation of TLR signaling pathway in preschool aged children (Fig. 4e). Phosphoinositide 3-kinase (PI3K)-Akt signals were also upregulated in the infant group (Fig. 4e). PI3K-Akt signal is critical for B cell development, differentiation, and survival28,38. PI3K signaling is an essential component of tonic B cell receptor (BCR) signaling and required for B cell maintenance and survival of naïve mature B cells39,40. In addition, hypoxia-inducible factor-1 (HIF-1) and Ras-related protein 1 (Rap1) signaling was also upregulated in the infant group (Fig. 4e). HIF-1α activity is essential for normal B cell development41. HIF activity is high in pro-B and pre-B cells and decreases at the immature B cell stage. The role of HIF-1α in mature B cell development remains to be determined. Rap is the small GTPase and regulates cell proliferation, differentiation, and adhesion through integrin. In B cells, Rap is also critical for pro-B cell/pre-B cell development42, but its role in mature B cells needs further investigation. Similar to immature B cells, apoptosis was downregulated in infants (Fig. 4f). Preschooler’s mature B cells showed upregulation of IL-17 signaling pathway (Fig. 4e). IL-17 enhances chemotaxis of B cells43. B cell express IL-17RA receptors, and therefore respond to Th17-derived cytokine stimulation44. Advanced glycation end products (AGE)-receptor for advanced glycation end products (RAGE) signal was upregulated in school-aged children (Fig. 4e). AGEs are heterogeneous glycated products, lipids and nucleotides. The major receptor for AGEs is RAGE. At this point, the role of this signal in B cell function is not clear.
Figure 4. Mature B cell ontology annotation.

(a) The heatmap of mature B cells comparing infant, preschool and school children.
(b) The number of DEGs for each age group.
(c) Biological ontology analysis of up-regulated DEGs in mature B cells
(d) Biological ontology analysis of down-regulated DEGs in mature B cells
(e) Enrichment bubble plot of upregulated DEGs.
(f) Enrichment bubble plot of downregulated DEGs.
Plasma cells are differentiated from B cells and produce a large quantity of antibodies in response to antigens45. We observed relatively higher number of plasma cells in infant group (Fig. 1c–d), although it was not statistically significant. This result is in line with the study of plasma cell number by others46,47. Massive plasma cell production is considered as a result of early (first) antigen stimulation of naïve B cells47. The heatmap showed that transcriptomic signatures differed among the three age groups (Fig. 5a). The number of DEGs was highest in infants (Fig. 5b), consistent with the result for immature and mature B cells (Suppl Fig. 3f, Fig. 4b). As expected, the biological annotation showed that innate and adaptive immunity was downregulated in infants (Fig. 5d), while adaptive immunity was upregulated in school aged children (Fig. 5c). Next, we performed KEGG pathway analysis. PI3K-Akt and Rap signaling was upregulated in infant plasma cells, as in infant mature B cells (Fig. 5e). PI3K signals regulate plasma cell differentiation48. This is in line with the fact that infants produce a large number of plasma cells. Different from mature B cells, Wnt signaling was upregulated in infant plasma cells (Fig. 5e). Wnt signal allows the accumulation of β-catenine, which travels to the nucleus for transcription regulation49. Although Wnt signaling is indispensable for normal B cell development50, B cell-specific deletion of β-catenin showed a modest defect in plasma cell generation50, suggesting the critical role of β-catenine, therefore, Wnt signaling in plasma cells. The importance of Wnt signaling in plasma cell production was also shown in myeloma cells. Multiple myeloma uses aberrant canonical Wnt signaling for its survival51,52. Of note, Wnt signaling is downregulated in school age children. Hippo pathway was downregulated in infants (Fig. 5f) and upregulated in older children (Fig. 5e). Hippo pathway regulates the size of organ53, but it is also involved in lymphocyte development. Mst1 is a Ser/Thr kinase in Hippo pathway. Mst1 KO mice had an enhanced production of plasma cells with an increase expression of Blimp1, IRF4, Bcl-2 and XBP54. IRF4 and Blimp1 are critical for plasma cell generation50, which supports the role of Hippo pathway in plasma cell homeostasis. Whether or not Hippo pathway plays a major role in plasma cell production over Wnt signaling in school aged children deserves future investigation. Relaxin signaling pathway was also downregulated in infants (Fig. 5f) but upregulated in older children (Fig. 5e). Although the role of relaxin in T cell development has been reported55, its involvement in B cells is not known. Cytokine-cytokine receptor interaction is also upregulated in pre-school and school children (Fig. 5e).
Figure 5. Plasma cell ontology.

(a) The heatmap of plasma cells comparing infant, preschool and school children.
(b) The number of DEGs for each age group.
(c) Biological ontology analysis of up-regulated DEGs in plasma cells
(d) Biological ontology analysis of down-regulated DEGs in plasma cells
(e) Enrichment bubble plot of upregulated DEGs.
(f) Enrichment bubble plot of downregulated DEGs.
Plasma cells are most known as antibody producing cells, but also produce cytokines56. CXCR3 expression is induced by IFNγ. CXCR3 expressing plasma cells produce IgG157. Overall, there are many signaling pathways involved in B cells on a steady state. Plasma cells continue to mature toward school age, but how each signaling pathway plays a role in B cell functional maturation during development remains to be determined.
T cells
We annotated T cell population using CD3D, CD8A, CD8B, CD4, GZMB, CD27 and CCR7. T cells was annotated as CD3D, CD3E positive cells. CD4 naïve cells were annotated as CD4, CCR7, CD27 positive cells, CD4 effector/memory cells as CD4, CCR7−, CD27− cells, CD8 naïve cells as CD8A, CD8B, CCR7, CD27 positive cells, and CD8 effector/memory cells as CD8A, CD8B, GZMB positive cells. (Suppl Fig, 4a–e).
CD4 naïve T cells are important players to achieve a regulated effective immune response. Following the interaction with antigen-MHC complex, they are differentiated into specific subtypes (Th1, Th2, Th17, Treg)58. Naïve T cells have a very distinct transcriptomic signature for each age group on the heatmap (Fig. 6a). Then, up- and down-regulated DEGs for each age group were determined. The number of DEGs in CD4 naïve T cells was much higher than monocytes, NK cells and B cells (Fig. 6b). Infants had more downregulated DEGs than upregulated DEGs, but preschool children had more upregulated DEGs. Biological annotation showed that infants had the downregulation of innate/adaptive immunity, antiviral defense, and chemotaxis (Fig. 6d), and immunity was upregulated in preschool and school children (Fig. 6c). Adaptive immunity was upregulated only in school age children (Fig. 6d), which may indicate that adaptive immunity continues to develop towards school age. Next, KEGG pathway analysis was performed. Uniquely, the infant group had a number of signaling pathways upregulated, including Wnt, Hippo, mTOR (mammalian target of rapamycin), Rap1 and PI3K-Akt signaling pathways (Fig. 6e). Rap1 signaling is connected with adhesion molecules and its activation is linked to T cell activation59. mTOR signals integrate environmental cues for T cell maintenance and activation, which assists CD4 naïve T cell differentiation into effector T cells60. T cell receptor (TCR) signals can activate PI3K-Akt signal, followed by mTOR signal activation61. Environmental cues can be integrated by non-mTOR signals. Cues detected by Toll-like receptors (TLRs) are relayed into Hippo signaling62. Hippo signaling pathway regulates CD4 T cell activation and proliferation62. In contrast, Wnt signaling limits proliferation and differentiation63. Thus, our data showed that both activating and inhibitory signals of proliferation and differentiation were upregulated in infants. As expected from biology annotation of downregulated innate and adaptive immunity in infants, Th1/Th2/Th17 differentiation was also downregulated in infants (Fig. 6f). In the future, it is necessary to determine how various signalings including PI3K-Akt, mTOR, and Hippo signaling pathways characterize naïve CD4 T cells. Although PI3K-Akt and Wnt signals, for example, induces Th differentiation, the fact that Th1/2/17 differentiation was downregulated indicated that these signals might have other functions. JAK-STAT signal is also involved in naïve CD4 differentiation64. JAK-STAT signaling was upregulated in school children (Fig. 6e) but downregulated in preschool children (Fig. 6f). Whether or not naïve CD4 T cells use different signals at different ages is another topic of investigation.
Figure 6. CD4 Naïve T cell ontology analysis.

(a) The heatmap of CD4 naïve T cells comparing infant, preschool and school children.
(b) The number of DEGs for each age group.
(c) Biological ontology analysis of up-regulated DEGs in CD4 naïve T cells
(d) Biological ontology analysis of down-regulated DEGs in CD4 naïve T cells
(e) Enrichment bubble plot of upregulated DEGs.
(f) Enrichment bubble plot of downregulated DEGs.
Naïve T cells are differentiated into effector T cells, and subset cells also become memory cells that have long lasting survival. The heatmap of effector/memory CD4 T cells was shown in Fig. 7a. Similar to naïve CD4 T cells, a distinct transcriptomic profile was observed for each age group. The number of up- and down-regulated DEGs was higher in preschool and school aged children compared to infants (Fig. 7b). Biological ontology annotation showed that infants had the downregulation of innate immunity, adaptive immunity and antiviral defense (Fig. 7d), but antiviral defense was upregulated in preschool (Fig. 7c). KEGG pathway analysis of up- and down-regulated DEGs was shown in Fig. 7e–f. As in the heatmap, the ontology in infants and school children shared a number of pathways. For example, JAK-STAT signal was upregulated in infant and school (Fig. 7e) but downregulated in preschool (Fig. 7f). Whether or not the upregulation of JAK-STAT signaling pathway related genes bring similar phenotypes to infants and school aged children is unclear. For example, dela Pena-Ponce et al. examined JAK-STAT signaling function of infant CD4+ T cells65. In this study, researchers did not differentiate naïve and effector CD4 T cells, but they found that CD4+ T cells effectively activated STAT6 in response to IL-4 but did not respond adequately to IL-2 and IL-12 at 1 year. Although JAK-STAT signaling genes were upregulated in infants, it might be a compensatory response to its reduced function.
Figure 7. CD4 Effector T cell ontology analysis.

(a) The heatmap of CD4 effector T cells comparing infant, preschool and school children.
(b) The number of DEGs for each age group.
(c) Biological ontology analysis of up-regulated DEGs in CD4 effector/memory T cells
(d) Biological ontology analysis of down-regulated DEGs in CD4 effector/memory T cells
(e) Enrichment bubble plot of upregulated DEGs.
(f) Enrichment bubble plot of downregulated DEGs.
CD8 naïve and effector/memory cell transcriptomic profiles in children were shown in Fig. 8 and Fig. 9. As seen in the heatmap (Fig. 8a and Fig. 9a), each age group has a distinct transcriptomic profile. The number of up- and down-regulated DEGs was shown in Fig. 8b and Fig. 9b. CD8 naïve T cells in infants showed downregulation of innate immunity as in other cell types (Fig. 8c). However, CD8 naïve T cells showed upregulation of innate immunity as well. CD8 T cells at birth show innate cell like functions with less antigen presenting cell (APC) help66. Over time, CD8 T cells can get an efficient help from APC with diverse repertoire. In fact, our data suggested the downregulation of innate immunity in school age children (Fig. 8d), suggesting that CD8 T cells may continue to develop till school age. A number of signaling pathways were up- and/or down-regulated throughout (Fig. 8e–f). In conjunction with potentially changing functionality of CD8 naïve T cells, it would be important to delineate the role of each pathway. Similar to CD8 naïve T cells, innate immunity was upregulated in CD8 effector/memory T cells (Fig. 9c). Adaptive immunity was upregulated in school age children (Fig. 9c). This may also reflect continuously changing CD8 immunological phenotype. Downregulated DEG ontology for effector CD8 T cells was shown in Fig. 9d. Details of upregulated and downregulated signaling pathways in the role of CD8 effector/memory T cells are shown in Fig. 9e–f.
Figure 8. CD8 Naïve T cell ontology analysis.

(a) The heatmap of CD8 naïve T cells comparing infant, preschool and school children.
(b) The number of DEGs for each age group.
(c) Biological ontology analysis of up-regulated DEGs in CD8 naïve T cells
(d) Biological ontology analysis of down-regulated DEGs in CD8 naïve T cells
(e) Enrichment bubble plot of upregulated DEGs.
(f) Enrichment bubble plot of downregulated DEGs.
Figure 9. CD8 Effector/memory T cell ontology analysis.

(a) The heatmap of CD8 effector T cells comparing infant, preschool and school children.
(b) The number of DEGs for each age group.
(c) Biological ontology analysis of up-regulated DEGs in CD8 effector/memory T cells
(d) Biological ontology analysis of down-regulated DEGs in CD8 effector/memory T cells
(e) Enrichment bubble plot of upregulated DEGs.
(f) Enrichment bubble plot of downregulated DEGs.
Discussion
In this manuscript, we have described leukocyte population and transcriptomic signature changes of monocytes, NK cells, B cells and T cells from infants to school age children using scRNA seq. We found that 1) Both classical monocytes and intermediate/non-classical monocytes were functionally immature in infants, but gained their functionality by pre-school age, 2) As it is known that NK cells become mature in early infancy, they had a very limited number of DEGs across different age groups, 3) B cells and plasma cells showed upregulation of immunity even at school age, and 4) T cells also showed upregulation of immunity at school age, similar to B and plasma cells. These results are consistent with the finding in the COVID that infants were susceptible to severe COVID among children. Pathway analysis showed clear differences in signaling pathways among infants, preschool and school children and also demonstrated that children’s immune cells continue to undergo changes. A number of signal pathways was associated with different age groups. However, a number of pathways needs functional delineation in the future as details are described in the result section. Examples include; NLR and sphingolipid signaling pathways affect monocyte differentiation at preschool and school age? What is the role of Rap and RAGE-AGE in mature B cells?
Our motivation was to delineate leukocyte functional changes in infants, preschool, and school age groups by including patients with limited comorbidity. Our population was largely on white/Caucasian background. However, we recognize that a small number of samples per each group can pose a limitation to this study. Thus, it is critical to expand this type of study in the future, which will also help to address the role of race/ethnicity/gender.
In conclusion, we have shown that leukocytes except NK cells from infants had downregulation of immunity, which seems to be upregulated in preschool and/school age.
Supplementary Material
Supplementary Figure 1. Monocyte annotation
(a) Genes for monocyte annotation and their expression
(b) Comparison of classic monocytes for infants, preschool and school children
(c) Comparison of intermediate/non-classical monocytes for infants, preschool and school children
Supplementary Figure 2. NK cell annotation
(a) Genes for NK cell annotation and their expression
(b) The number of DEGs for each age group.
(c) Biological ontology analysis of up-regulated DEGs in NK cells
(d) Biological ontology analysis of down-regulated DEGs in NK cells
(e) Enrichment bubble plot of upregulated DEGs.
(f) Enrichment bubble plot of downregulated DEGs.
Supplementary Figure 3. B cell and plasma cell annotation
(a) Genes for B cell and plasma cell annotation and their expression
(b) Comparison of immature B cells for infants, preschool and school children
(c) Comparison of mature B cells for infants, preschool and school children
(d) Comparison of plasma cells for infants, preschool and school children
(e) The heatmap of immature B cells comparing infant, preschool and school children.
(f) The number of DEGs for each age group.
(g) Biological ontology analysis of up-regulated DEGs in immature B cells
(h) Biological ontology analysis of down-regulated DEGs in immature B cells
(i) Enrichment bubble plot of downregulated DEGs for infant immature B cells
Supplementary Figure 4. T cell annotation
(a) Genes for T cell annotation and their expression
(b) Comparison of CD4 naïve T cells for infants, preschool and school children
(c) Comparison of CD4 effector/memory T cells for infants, preschool and school children
(d) Comparison of CD8 naïve T cells for infants, preschool and school children
(e) Comparison of CD8 effector/memoryT cells for infants, preschool and school children
Financial Support:
This project was supported by R21HD099194 (K.Y. and S.K.) and CHMC Anesthesia Foundation (K.Y. and S.K.).
Footnotes
Publisher's Disclaimer: This is a PDF file of an unedited manuscript that has been accepted for publication. As a service to our customers we are providing this early version of the manuscript. The manuscript will undergo copyediting, typesetting, and review of the resulting proof before it is published in its final form. Please note that during the production process errors may be discovered which could affect the content, and all legal disclaimers that apply to the journal pertain.
Conflict of Interest:
None
References
- 1.Prabhu SB et al. Comparison of Human Neonatal and Adult Blood Leukocyte Subset Composition Phenotypes. PLoS One 11, e0162242, doi: 10.1371/journal.pone.0162242 (2016). [DOI] [PMC free article] [PubMed] [Google Scholar]
- 2.Lawrence SM, Eckert J, Makoni M & Pereira HA Is the Use of Complete Blood Counts with Manual Differentials an Antiquated Method of Determining Neutrophil Composition in Newborns? Ann Clin Lab Sci 45, 403–413 (2015). [PubMed] [Google Scholar]
- 3.Sanchez-Schmitz G et al. Neonatal monocytes demonstrate impaired homeostatic extravasation into a microphysiological human vascular model. Sci Rep 10, 17836, doi: 10.1038/s41598-020-74639-z (2020). [DOI] [PMC free article] [PubMed] [Google Scholar]
- 4.Li K et al. Age-dependent changes of total and differential white blood cell counts in children. Chin Med J (Engl) 133, 1900–1907, doi: 10.1097/CM9.0000000000000854 (2020). [DOI] [PMC free article] [PubMed] [Google Scholar]
- 5.Kollmann TR, Levy O, Montgomery RR & Goriely S Innate immune function by Toll-like receptors: distinct responses in newborns and the elderly. Immunity 37, 771–783, doi: 10.1016/j.immuni.2012.10.014 (2012). [DOI] [PMC free article] [PubMed] [Google Scholar]
- 6.Schmiedeberg K et al. T Cells of Infants Are Mature, but Hyporeactive Due to Limited Ca2+ Influx. PLoS One 11, e0166633, doi: 10.1371/journal.pone.0166633 (2016). [DOI] [PMC free article] [PubMed] [Google Scholar]
- 7.Dong XC et al. [Epidemiological characteristics of confirmed COVID-19 cases in Tianjin]. Zhonghua Liu Xing Bing Xue Za Zhi 41, 638–641, doi: 10.3760/cma.j.cn112338-20200221-00146 (2020). [DOI] [PubMed] [Google Scholar]
- 8.Sherman BT et al. DAVID: a web server for functional enrichment analysis and functional annotation of gene lists (2021 update). Nucleic Acids Res 50, W216–W221, doi: 10.1093/nar/gkac194 (2022). [DOI] [PMC free article] [PubMed] [Google Scholar]
- 9.Huang da W, Sherman BT & Lempicki RA Systematic and integrative analysis of large gene lists using DAVID bioinformatics resources. Nat Protoc 4, 44–57, doi: 10.1038/nprot.2008.211 (2009). [DOI] [PubMed] [Google Scholar]
- 10.Schenz J, Obermaier M, Uhle S, Weigand MA & Uhle F Low-Density Granulocyte Contamination From Peripheral Blood Mononuclear Cells of Patients With Sepsis and How to Remove It - A Technical Report. Front Immunol 12, 684119, doi: 10.3389/fimmu.2021.684119 (2021). [DOI] [PMC free article] [PubMed] [Google Scholar]
- 11.Hong CW Current Understanding in Neutrophil Differentiation and Heterogeneity. Immune Netw 17, 298–306, doi: 10.4110/in.2017.17.5.298 (2017). [DOI] [PMC free article] [PubMed] [Google Scholar]
- 12.Cabrera LE et al. Characterization of low-density granulocytes in COVID-19. PLoS Pathog 17, e1009721, doi: 10.1371/journal.ppat.1009721 (2021). [DOI] [PMC free article] [PubMed] [Google Scholar]
- 13.Zheng Y et al. A human circulating immune cell landscape in aging and COVID-19. Protein Cell 11, 740–770, doi: 10.1007/s13238-020-00762-2 (2020). [DOI] [PMC free article] [PubMed] [Google Scholar]
- 14.Cormican S & Griffin MD Human Monocyte Subset Distinctions and Function: Insights From Gene Expression Analysis. Front Immunol 11, 1070, doi: 10.3389/fimmu.2020.01070 (2020). [DOI] [PMC free article] [PubMed] [Google Scholar]
- 15.Patel AA et al. The fate and lifespan of human monocyte subsets in steady state and systemic inflammation. J Exp Med 214, 1913–1923, doi: 10.1084/jem.20170355 (2017). [DOI] [PMC free article] [PubMed] [Google Scholar]
- 16.Sampath P, Moideen K, Ranganathan UD & Bethunaickan R Monocyte Subsets: Phenotypes and Function in Tuberculosis Infection. Front Immunol 9, 1726, doi: 10.3389/fimmu.2018.01726 (2018). [DOI] [PMC free article] [PubMed] [Google Scholar]
- 17.Krow-Lucal ER, Kim CC, Burt TD & McCune JM Distinct functional programming of human fetal and adult monocytes. Blood 123, 1897–1904, doi: 10.1182/blood-2013-11-536094 (2014). [DOI] [PMC free article] [PubMed] [Google Scholar]
- 18.Ting JP, Willingham SB & Bergstralh DT NLRs at the intersection of cell death and immunity. Nat Rev Immunol 8, 372–379, doi: 10.1038/nri2296 (2008). [DOI] [PubMed] [Google Scholar]
- 19.Tall AR & Westerterp M Inflammasomes, neutrophil extracellular traps, and cholesterol. J Lipid Res 60, 721–727, doi: 10.1194/jlr.S091280 (2019). [DOI] [PMC free article] [PubMed] [Google Scholar]
- 20.Coillard A, Guyonnet L, De Juan A, Cros A & Segura E TLR or NOD receptor signaling skews monocyte fate decision via distinct mechanisms driven by mTOR and miR-155. Proc Natl Acad Sci U S A 118, doi: 10.1073/pnas.2109225118 (2021). [DOI] [PMC free article] [PubMed] [Google Scholar]
- 21.Lessard AJ et al. Triggering of NOD2 Receptor Converts Inflammatory Ly6C(high) into Ly6C(low) Monocytes with Patrolling Properties. Cell Rep 20, 1830–1843, doi: 10.1016/j.celrep.2017.08.009 (2017). [DOI] [PubMed] [Google Scholar]
- 22.Olivera A & Rivera J Sphingolipids and the balancing of immune cell function: lessons from the mast cell. J Immunol 174, 1153–1158, doi: 10.4049/jimmunol.174.3.1153 (2005). [DOI] [PubMed] [Google Scholar]
- 23.Stevens VL, Owens NE, Winton EF, Kinkade JM Jr. & Merrill AH Jr. Modulation of retinoic acid-induced differentiation of human leukemia (HL-60) cells by serum factors and sphinganine. Cancer Res 50, 222–226 (1990). [PubMed] [Google Scholar]
- 24.Okazaki T, Bielawska A, Bell RM & Hannun YA Role of ceramide as a lipid mediator of 1 alpha,25-dihydroxyvitamin D3-induced HL-60 cell differentiation. J Biol Chem 265, 15823–15831 (1990). [PubMed] [Google Scholar]
- 25.Kapellos TS et al. Human Monocyte Subsets and Phenotypes in Major Chronic Inflammatory Diseases. Front Immunol 10, 2035, doi: 10.3389/fimmu.2019.02035 (2019). [DOI] [PMC free article] [PubMed] [Google Scholar]
- 26.Pierangeli A et al. Comparison by Age of the Local Interferon Response to SARS-CoV-2 Suggests a Role for IFN-epsilon and -omega. Front Immunol 13, 873232, doi: 10.3389/fimmu.2022.873232 (2022). [DOI] [PMC free article] [PubMed] [Google Scholar]
- 27.Schoggins JW Interferon-Stimulated Genes: What Do They All Do? Annu Rev Virol 6, 567–584, doi: 10.1146/annurev-virology-092818-015756 (2019). [DOI] [PubMed] [Google Scholar]
- 28.Yabuhara A, Kawai H & Komiyama A Development of natural killer cytotoxicity during childhood: marked increases in number of natural killer cells with adequate cytotoxic abilities during infancy to early childhood. Pediatr Res 28, 316–322, doi: 10.1203/00006450-199010000-00002 (1990). [DOI] [PubMed] [Google Scholar]
- 29.Guilmot A, Hermann E, Braud VM, Carlier Y & Truyens C Natural killer cell responses to infections in early life. J Innate Immun 3, 280–288, doi: 10.1159/000323934 (2011). [DOI] [PubMed] [Google Scholar]
- 30.Herberman RB, Nunn ME & Lavrin DH Natural cytotoxic reactivity of mouse lymphoid cells against syngeneic acid allogeneic tumors. I. Distribution of reactivity and specificity. Int J Cancer 16, 216–229, doi: 10.1002/ijc.2910160204 (1975). [DOI] [PubMed] [Google Scholar]
- 31.Bertin FR, Laurance S, Lemarie C, Blostein M Natural killer cells induce the formation of neutrophil extracellular traps (NETs) in venous thrombosis. Blood 128, 1424 (2016). [DOI] [PubMed] [Google Scholar]
- 32.Mah AY & Cooper MA Metabolic Regulation of Natural Killer Cell IFN-gamma Production. Crit Rev Immunol 36, 131–147, doi: 10.1615/CritRevImmunol.2016017387 (2016). [DOI] [PMC free article] [PubMed] [Google Scholar]
- 33.Mahapatra S et al. High-resolution phenotyping identifies NK cell subsets that distinguish healthy children from adults. PLoS One 12, e0181134, doi: 10.1371/journal.pone.0181134 (2017). [DOI] [PMC free article] [PubMed] [Google Scholar]
- 34.LeBien TW & Tedder TF B lymphocytes: how they develop and function. Blood 112, 1570–1580, doi: 10.1182/blood-2008-02-078071 (2008). [DOI] [PMC free article] [PubMed] [Google Scholar]
- 35.Buchta CM & Bishop GA Toll-like receptors and B cells: functions and mechanisms. Immunol Res 59, 12–22, doi: 10.1007/s12026-014-8523-2 (2014). [DOI] [PubMed] [Google Scholar]
- 36.Flores-Fernandez R et al. Prolactin Rescues Immature B Cells from Apoptosis-Induced BCR-Aggregation through STAT3, Bcl2a1a, Bcl2l2, and Birc5 in Lupus-Prone MRL/lpr Mice. Cells 10, doi: 10.3390/cells10020316 (2021). [DOI] [PMC free article] [PubMed] [Google Scholar]
- 37.Vazquez MI, Catalan-Dibene J & Zlotnik A B cells responses and cytokine production are regulated by their immune microenvironment. Cytokine 74, 318–326, doi: 10.1016/j.cyto.2015.02.007 (2015). [DOI] [PMC free article] [PubMed] [Google Scholar]
- 38.Abdelrasoul H, Werner M, Setz CS, Okkenhaug K & Jumaa H PI3K induces B-cell development and regulates B cell identity. Sci Rep 8, 1327, doi: 10.1038/s41598-018-19460-5 (2018). [DOI] [PMC free article] [PubMed] [Google Scholar]
- 39.Srinivasan L et al. PI3 kinase signals BCR-dependent mature B cell survival. Cell 139, 573–586, doi: 10.1016/j.cell.2009.08.041 (2009). [DOI] [PMC free article] [PubMed] [Google Scholar]
- 40.Jellusova J et al. Context-specific BAFF-R signaling by the NF-kappaB and PI3K pathways. Cell Rep 5, 1022–1035, doi: 10.1016/j.celrep.2013.10.022 (2013). [DOI] [PMC free article] [PubMed] [Google Scholar]
- 41.Burrows N et al. Dynamic regulation of hypoxia-inducible factor-1alpha activity is essential for normal B cell development. Nat Immunol 21, 1408–1420, doi: 10.1038/s41590-020-0772-8 (2020). [DOI] [PMC free article] [PubMed] [Google Scholar]
- 42.Chu H, Awasthi A, White GC 2nd, Chrzanowska-Wodnicka M & Malarkannan S Rap1b regulates B cell development, homing, and T cell-dependent humoral immunity. J Immunol 181, 3373–3383, doi: 10.4049/jimmunol.181.5.3373 (2008). [DOI] [PMC free article] [PubMed] [Google Scholar]
- 43.Halwani R et al. IL-17 Enhances Chemotaxis of Primary Human B Cells during Asthma. PLoS One 9, e114604, doi: 10.1371/journal.pone.0114604 (2014). [DOI] [PMC free article] [PubMed] [Google Scholar]
- 44.Xie S et al. IL-17 activates the canonical NF-kappaB signaling pathway in autoimmune B cells of BXD2 mice to upregulate the expression of regulators of G-protein signaling 16. J Immunol 184, 2289–2296, doi: 10.4049/jimmunol.0903133 (2010). [DOI] [PMC free article] [PubMed] [Google Scholar]
- 45.Pioli PD Plasma Cells, the Next Generation: Beyond Antibody Secretion. Front Immunol 10, 2768, doi: 10.3389/fimmu.2019.02768 (2019). [DOI] [PMC free article] [PubMed] [Google Scholar]
- 46.Washburn AH Plasma cells in the circulation in infants and children. Am J Dis Child 113, 633–638, doi: 10.1001/archpedi.1967.02090210047001 (1967). [DOI] [PubMed] [Google Scholar]
- 47.Blanco E et al. Age-associated distribution of normal B-cell and plasma cell subsets in peripheral blood. J Allergy Clin Immunol 141, 2208–2219 e2216, doi: 10.1016/j.jaci.2018.02.017 (2018). [DOI] [PubMed] [Google Scholar]
- 48.Omori SA et al. Regulation of class-switch recombination and plasma cell differentiation by phosphatidylinositol 3-kinase signaling. Immunity 25, 545–557, doi: 10.1016/j.immuni.2006.08.015 (2006). [DOI] [PubMed] [Google Scholar]
- 49.van de Wetering M, de Lau W & Clevers H WNT signaling and lymphocyte development. Cell 109 Suppl, S13–19, doi: 10.1016/s0092-8674(02)00709-2 (2002). [DOI] [PubMed] [Google Scholar]
- 50.Yu Q et al. Role of beta-catenin in B cell development and function. J Immunol 181, 3777–3783, doi: 10.4049/jimmunol.181.6.3777 (2008). [DOI] [PMC free article] [PubMed] [Google Scholar]
- 51.van Andel H, Kocemba KA, Spaargaren M & Pals ST Aberrant Wnt signaling in multiple myeloma: molecular mechanisms and targeting options. Leukemia 33, 1063–1075, doi: 10.1038/s41375-019-0404-1 (2019). [DOI] [PMC free article] [PubMed] [Google Scholar]
- 52.Qiang YW, Endo Y, Rubin JS & Rudikoff S Wnt signaling in B-cell neoplasia. Oncogene 22, 1536–1545, doi: 10.1038/sj.onc.1206239 (2003). [DOI] [PubMed] [Google Scholar]
- 53.Meng Z, Moroishi T & Guan KL Mechanisms of Hippo pathway regulation. Genes Dev 30, 1–17, doi: 10.1101/gad.274027.115 (2016). [DOI] [PMC free article] [PubMed] [Google Scholar]
- 54.Bagherzadeh Yazdchi S et al. Hippo Pathway Kinase Mst1 Is Required for Long-Lived Humoral Immunity. J Immunol 202, 69–78, doi: 10.4049/jimmunol.1701407 (2019). [DOI] [PMC free article] [PubMed] [Google Scholar]
- 55.Piccinni MP et al. Relaxin favors the development of activated human T cells into Th1-like effectors. Eur J Immunol 29, 2241–2247, doi: (1999). [DOI] [PubMed] [Google Scholar]
- 56.Dang VD, Hilgenberg E, Ries S, Shen P & Fillatreau S From the regulatory functions of B cells to the identification of cytokine-producing plasma cell subsets. Curr Opin Immunol 28, 77–83, doi: 10.1016/j.coi.2014.02.009 (2014). [DOI] [PubMed] [Google Scholar]
- 57.Muehlinghaus G et al. Regulation of CXCR3 and CXCR4 expression during terminal differentiation of memory B cells into plasma cells. Blood 105, 3965–3971, doi: 10.1182/blood-2004-08-2992 (2005). [DOI] [PubMed] [Google Scholar]
- 58.Luckheeram RV, Zhou R, Verma AD & Xia B CD4(+)T cells: differentiation and functions. Clin Dev Immunol 2012, 925135, doi: 10.1155/2012/925135 (2012). [DOI] [PMC free article] [PubMed] [Google Scholar]
- 59.Katagiri K, Hattori M, Minato N & Kinashi T Rap1 functions as a key regulator of T-cell and antigen-presenting cell interactions and modulates T-cell responses. Mol Cell Biol 22, 1001–1015, doi: 10.1128/MCB.22.4.1001-1015.2002 (2002). [DOI] [PMC free article] [PubMed] [Google Scholar]
- 60.Chi H Regulation and function of mTOR signalling in T cell fate decisions. Nat Rev Immunol 12, 325–338, doi: 10.1038/nri3198 (2012). [DOI] [PMC free article] [PubMed] [Google Scholar]
- 61.Han JM, Patterson SJ & Levings MK The Role of the PI3K Signaling Pathway in CD4(+) T Cell Differentiation and Function. Front Immunol 3, 245, doi: 10.3389/fimmu.2012.00245 (2012). [DOI] [PMC free article] [PubMed] [Google Scholar]
- 62.Hong L, Li X, Zhou D, Geng J & Chen L Role of Hippo signaling in regulating immunity. Cell Mol Immunol 15, 1003–1009, doi: 10.1038/s41423-018-0007-1 (2018). [DOI] [PMC free article] [PubMed] [Google Scholar]
- 63.Gattinoni L et al. Wnt signaling arrests effector T cell differentiation and generates CD8+ memory stem cells. Nat Med 15, 808–813, doi: 10.1038/nm.1982 (2009). [DOI] [PMC free article] [PubMed] [Google Scholar]
- 64.Twohig JP et al. Activation of naive CD4(+) T cells re-tunes STAT1 signaling to deliver unique cytokine responses in memory CD4(+) T cells. Nat Immunol 20, 458–470, doi: 10.1038/s41590-019-0350-0 (2019). [DOI] [PMC free article] [PubMed] [Google Scholar]
- 65.Dela Pena-Ponce MG et al. Increasing JAK/STAT Signaling Function of Infant CD4(+) T Cells during the First Year of Life. Front Pediatr 5, 15, doi: 10.3389/fped.2017.00015 (2017). [DOI] [PMC free article] [PubMed] [Google Scholar]
- 66.Fike AJ, Kumova OK & Carey AJ Dissecting the defects in the neonatal CD8(+)T-cell response. J Leukoc Biol 106, 1051–1061, doi: 10.1002/JLB.5RU0319-105R (2019). [DOI] [PMC free article] [PubMed] [Google Scholar]
Associated Data
This section collects any data citations, data availability statements, or supplementary materials included in this article.
Supplementary Materials
Supplementary Figure 1. Monocyte annotation
(a) Genes for monocyte annotation and their expression
(b) Comparison of classic monocytes for infants, preschool and school children
(c) Comparison of intermediate/non-classical monocytes for infants, preschool and school children
Supplementary Figure 2. NK cell annotation
(a) Genes for NK cell annotation and their expression
(b) The number of DEGs for each age group.
(c) Biological ontology analysis of up-regulated DEGs in NK cells
(d) Biological ontology analysis of down-regulated DEGs in NK cells
(e) Enrichment bubble plot of upregulated DEGs.
(f) Enrichment bubble plot of downregulated DEGs.
Supplementary Figure 3. B cell and plasma cell annotation
(a) Genes for B cell and plasma cell annotation and their expression
(b) Comparison of immature B cells for infants, preschool and school children
(c) Comparison of mature B cells for infants, preschool and school children
(d) Comparison of plasma cells for infants, preschool and school children
(e) The heatmap of immature B cells comparing infant, preschool and school children.
(f) The number of DEGs for each age group.
(g) Biological ontology analysis of up-regulated DEGs in immature B cells
(h) Biological ontology analysis of down-regulated DEGs in immature B cells
(i) Enrichment bubble plot of downregulated DEGs for infant immature B cells
Supplementary Figure 4. T cell annotation
(a) Genes for T cell annotation and their expression
(b) Comparison of CD4 naïve T cells for infants, preschool and school children
(c) Comparison of CD4 effector/memory T cells for infants, preschool and school children
(d) Comparison of CD8 naïve T cells for infants, preschool and school children
(e) Comparison of CD8 effector/memoryT cells for infants, preschool and school children