

Abstract
Purpose:
[13C]Bicarbonate formation from hyperpolarized [1-13C]pyruvate via pyruvate dehydrogenase, a key regulatory enzyme, represents the cerebral oxidation of pyruvate and the integrity of mitochondrial function. The present study is to characterize the chronology of cerebral mitochondrial metabolism during secondary injury associated with acute TBI by longitudinally monitoring [13C]bicarbonate production from hyperpolarized [1-13C]pyruvate in rodents.
Methods:
Male Wistar rats were randomly assigned to undergo a controlled-cortical impact (CCI, n = 31) or sham surgery (n = 22). Seventeen of the CCI and nine of the sham rats longitudinally underwent a 1H/13C-integrated MR protocol that includes a bolus injection of hyperpolarized [1-13C]pyruvate at 0 (2 hrs), 1, 2, 5, and 10 days post-surgery. Separate CCI and sham rats were used for histological validation and enzyme assays.
Results:
In addition to elevated lactate, we observed significantly reduced bicarbonate production in the injured site. Unlike the immediate appearance of hyperintensity on T2-weighted MRI, the contrast of bicarbonate signals between the injured region and the contralateral brain peaked at 24 hrs post-injury, then fully recovered to the normal level at day 10. A subset of TBI rats demonstrated markedly increased bicarbonate in normal-appearing contralateral brain regions post-injury.
Conclusion:
This study demonstrates that aberrant mitochondrial metabolism occurring in acute TBI can be monitored by detecting [13C]bicarbonate production from hyperpolarized [1-13C]pyruvate, suggesting that [13C]bicarbonate is a sensitive in-vivo biomarker of the secondary injury processes.
Keywords: traumatic brain injury, metabolic imaging, hyperpolarization, mitochondrial dysfunction, pyruvate dehydrogenase
Introduction
Traumatic brain injury (TBI) contributes to approximately 30% of all injury-related deaths in the United States with over 50 % of survivors sustaining long-term disability.1–3 A major challenge of treating patients with TBI are the compounding secondary injury effects following the primary mechanical damage. Secondary injury can develop over minutes to months after the primary injury through events such as mitochondrial damage, hypoxia, inflammation, and delayed cell death with the associated metabolic shifts.4 The longitudinal nature of secondary damage can often lead to life-long disabilities, cognitive impairment, mood disorders, and neurodegenerative disease development.5,6 Understanding the timing of secondary TBI damage can provide precise windows of therapeutic intervention to prevent or reduce subsequent injuries, thus directly impacting long-term patient outcome. While a number of pathological alterations in TBI are potential biomarkers, no current clinical imaging modalities are sensitive enough to routinely resolve the details of metabolic shifts in different brain sub-regions with secondary injury. Therefore, an appreciation of the chronological metabolic changes that occur after TBI may help provide insight into these secondary impairments.
Current methods measuring metabolic activity, such as microdialysis, that indirectly assess energy metabolism, are highly invasive, or do not address regional alterations of TBI metabolism. Studies using [18F]fluorodeoxy-glucose positron emission tomography ([18F]FDG PET) observed increased glucose uptake after TBI.7 However, the metabolic fate of [18F]FDG remains unclear owing to its limited metabolism to [18F]FDG-6-phosphate in glycolysis. Proton (1H) magnetic resonance spectroscopy (MRS) offers a non-invasive methodology to detect gross metabolic changes in the brain.8,9 1H MR spectroscopic imaging (MRSI) has mapped regional N-acetylaspartate (NAA), creatine, glutamate, and choline levels in child and adult brains post-traumatic injury.10–12 Though these metabolites are correlated to longitudinal neuropsychological deficits, they lack insight into the underlying metabolic changes that may occur after TBI.13 In contrast, carbon-13 (13C) nuclear magnetic resonance (NMR) studies with steady-state infusion of 13C-labeled glucose can track detailed glucose utilization, with previous studies reporting early hyperglycolysis within the injured brain regions by observing an increase in lactate and elevated pentose phosphate pathway activity.14,15 Although 13C-MRSI offers a window into further downstream metabolic activities such as the tricarboxylic acid (TCA) cycle activity and the potential to map chronological changes in metabolic flux in the brain after injury in-vivo, the signal-to-noise ratio (SNR) is compromised by the low gyromagnetic ratio of 13C nuclei, even with a long acquisition time.
Dissolution dynamic nuclear polarization (dDNP) of 13C-labeled substrates combats this issue by raising the SNR to unprecedented levels and, in combination with 13C-MRSI, provides unique non-invasive measurements of critical in-vivo dynamic metabolic processes. In particular, hyperpolarized [1-13C]pyruvate has been used to assess lactate dehydrogenase (LDH) and pyruvate dehydrogenase (PDH) activities in the brain by detecting their products, [1-13C]lactate and [13C]bicarbonate, respectively, Figure 1A. The formation of acetyl-CoA and [13C]CO2 (detected as [13C]bicarbonate) from [1-13C]pyruvate is a key irreversible regulatory enzymatic step that connects glycolysis and the TCA cycle. Previously, metabolic imaging studies with hyperpolarized [1-13C]pyruvate reported increased lactate production in the damaged brain region following a controlled cortical impact (CCI) rat model up to seven days.16 In addition, DeVience, et al. reported reduced [13C]bicarbonate production from hyperpolarized [1-13C]pyruvate immediately after a CCI.17 A recent preliminary patient study demonstrated the translatability and sensitivity of this method to cerebral metabolic changes after mild TBI.18 In particular, decreased [13C]bicarbonate production was found in the brain nearest the site of trauma, suggesting that [13C]bicarbonate is a viable biomarker for monitoring the mitochondrial dysfunction during the secondary injury process. In the present study, we focused on longitudinally assessment of [13C]bicarbonate production from hyperpolarized [1-13C]pyruvate in rodents following a CCI to characterize the chronology of cerebral mitochondrial metabolism during secondary injury associated with acute TBI.
Figure 1. Metabolic Assessment of Brain Injury using Hyperpolarized [1-13C]Pyruvate.

(A) Changes in brain lactate dehydrogenase (LDH) and pyruvate dehydrogenase (PDH) activity following traumatic brain injury is assessable by detection of hyperpolarized [1-13C]lactate and [13C]bicarbonate production from intravenously injected hyperpolarized [1-13C]pyruvate. T2-weighted 1H MRI and 13C-labeled metabolites (pyruvate, lactate, and bicarbonate) at baseline (B) and 24-hr post-injury (C). Representative intracranial 13C spectra at baseline (D) and post-injury (E). The spectra are displayed in absorption mode after correcting the 0th-order phase for bicarbonate.
Methods
Animal Preparation and TBI model
Wistar rats (7 – 9 weeks old) were randomly assigned to two groups for the study: TBI (n = 31) and sham (n = 22). To avoid the metabolic variation induced by menstrual cycle, male rats were used.19,20 A CCI model was used for the TBI group as the model induces TBI in a highly reproducible manner, offers flexibility to control injury severity, and provides a relatively low mortality rate. Following anesthesia (isoflurane induction: 4 – 4.5 %, maintenance: 2 – 3 %, in a 70% nitrous oxide, 30% oxygen carrier mix), each rat underwent craniotomy overlaying the right hemisphere of the brain to expose the dura. The 3.0-mm round impactor tip of a standardized CCl apparatus (Leica MyNeuroLab Impact One™ stereotaxic impactor, Leica Biosystems Richmond Inc., Richmond, IL, USA) was angled to be perpendicular to the cortical surface and accelerated to 4.4 m/s with a vertical deformation depth of 1.0 mm and an impact duration of 100 ms, consistently inducing mild-to-moderate TBI.21 Sham surgery included removal of skull cap with no direct injury to brain. The bregma and lambda coordinates for craniotomy were identical between the groups. Body temperature was maintained at 37 °C during the surgical procedure using a homeothermic heating system (RightTemp, Kent Scientific Corp., Torrington, CT, USA). Respiration rate was monitored by visual inspection. Rats recovered from anesthesia until ambulatory in a temperature-controlled chamber (28 °C ambient air). Following the surgery, the animals were regularly monitored for post-operative symptoms, including seizures, loss of consciousness, nasal bleeding, and hemorrhage; Such events would have prompted early removal from the study via euthanasia, but none of the rats exhibited any of these symptoms. All animal procedures followed the Guide for Care and Use of Laboratory Animals of US National Research Council and were approved by the University of Texas Southwestern Medical Center Institutional Animal Care and Use Committee (Protocol#: 2017–101802). All animal experiments are in accordance with the Animal Research: Reporting In Vivo Experiments (ARRIVE) guidelines.
Sample Preparation and Dissolution Dynamic Nuclear Polarization (dDNP)
A mixture of 14-M neat [1-13C]-labeled pyruvic acid (MilliporeSigma, Burlington MA, USA) and 15-mM trityl radical OX063 (Oxford Instruments, UK) was polarized using a SPINlab™ DNP polarizer (GE Healthcare, Waukesha WI, USA), which operates at 0.8 K in a 5 T magnet, by irradiating with microwaves (94.076 GHz). A research fluid path (GE Healthcare) was assembled for each dissolution with 36 μL of the pyruvate sample in the sample vial and 16-mL dissolution media containing 0.1 g/L of disodium ethylenediaminetetraacetate (Na2EDTA) in the dissolution syringe. After ~3 hrs of polarization, each sample was dissolved in the heated (130 °C) dissolution media, immediately mixed with 650 μL of neutralization media (0.72-M NaOH, 0.4-M Trizma base, and 0.1-g/L Na2EDTA in water solution), resulting in ~6.0 mL of ~80-mM hyperpolarized [1-13C]pyruvate solution with pH of 7.0 – 7.5.
MR Protocols
Seventeen of the CCI and nine of the sham rats underwent a 1H/13C-integrated MR protocol at 0 (2 hrs), 1, 2, 5, and 10 days post-surgery (Figure 2). Due to technical difficulties of operating the polarizer and the scanner, most of the rats completed a subset of the scheduled experiments as summarized in Table S1 and Table S2. All imaging experiments were performed on a clinical 3T wide-bore (bore size = 70 cm) MRI Scanner (750w Discovery; GE Healthcare, Waukesha, WI, USA). Rats were anesthetized with 2–3% isoflurane in 1.5 L/min oxygen, and a catheter was cannulated in the tail vein with an extension line (priming volume = 0.5 mL) prior to positioning in the center of the bore. For both radiofrequency (RF) excitation and signal reception, a 13C/1H dual-tuned quadrature birdcage rat coil (GE Healthcare, inner diameter = 80 mm, length = 90 mm) was used. After a three-plane localizer scan, two-dimensional (2D) T2-weighted dual-echo fast spin echo images of up to 12 slices were acquired for anatomical reference in axial, sagittal, and coronal planes (repetition time (TR) = 5,000 ms, echo times (TEs) = 12.8 ms/ 64.0 ms, field of view (FOV) = 96 mm × 96 mm, matrix size = 256 × 192, slice thickness = 2 mm, echo train length = 8, flip angle (FA) = 160°) to localize the sites of injury. The B0 field inhomogeneity over the region of the brain was minimized by adjusting the linear shim currents with a point-resolved spectroscopy sequence. For 13C metabolic imaging, each rat was given a bolus of hyperpolarized [1-13C]pyruvate (0.8 mmol/kg body weight) at a rate of 0.25 mL/s, and imaging acquisition was initiated 20 s from the start of the injection using a phase-encoded free-induction decay chemical shift imaging sequence with a single axial (animal coronal) slice centered on the injury site (FOV = 48 mm × 48 mm, matrix size = 16 × 16, slice thickness = 7.7-mm, spectral width = 5000 Hz, spectral point = 256, FA = 5.625 °, acquisition time = 19 s). The acquisition delay was chosen for optimal detection of hyperpolarized [13C]bicarbonate, considering the peak time of bicarbonate appearance in the brain (~30 s) and the acquisition time (19 s).22,23 Dissolution-to-injection time was kept at 17 – 20 s. Throughout the imaging experiment, the respiration rate was maintained at 45 – 60 breaths/min by adjusting the isoflurane level (1.5 – 2.5 %).
Figure 2. Overall study design for monitoring longitudinal metabolic changes following controlled cortical injury (CCI).
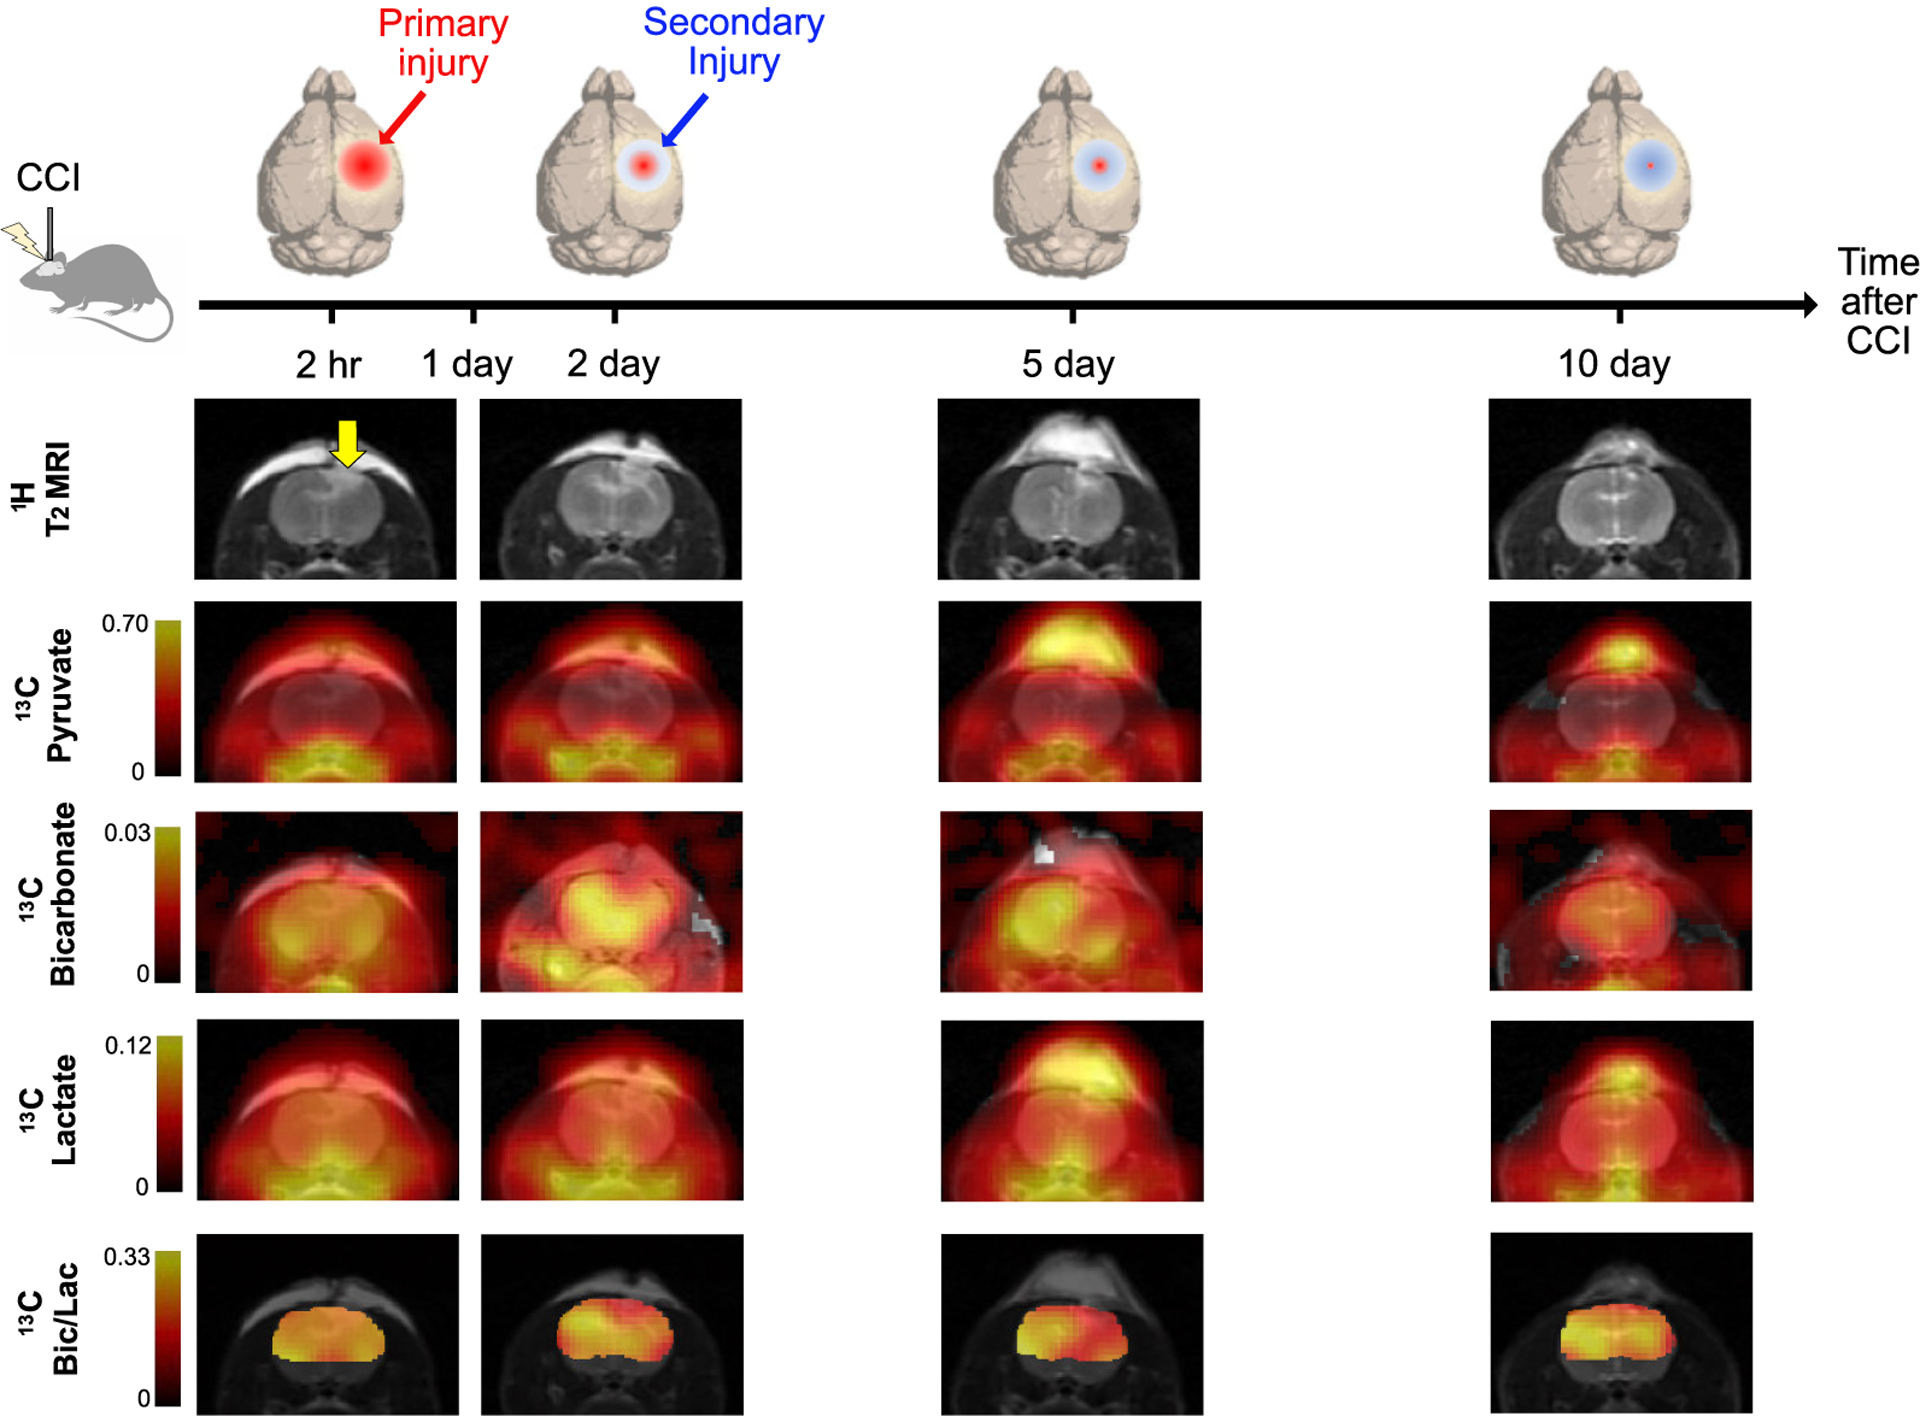
Exemplary longitudinal changes in T2-weighted 1H MRI and 13C metabolic images including hyperpolarized [1-13C]pyruvate, [13C]bicarbonate, [1-13C]lactate and [13C]bicarbonate-to-[1-13C]lactate ratio from a representative animal with CCI surgery at day 0 (2-hr post-injury), day 2, day 5, and day 10 are presented.
Image Reconstruction and Analysis
All 13C data sets were processed using MATLAB (Mathworks Inc., Natick, MA, USA) as described previously.24 The raw k-space data were apodized by a 25-Hz Gaussian filter in the spectral domain and by a generalized Hanning filter (α = 0.66) in the spatial domain. After zero-filling by a factor of four in both spectral and spatial dimensions, a 2D inverse fast Fourier transform in spatial domains and a 1D fast Fourier transform in time domain were carried out. All the presented spectra were phase-corrected for both the 0th and 1st orders, and the rolling baseline was removed by subtracting a fitted spline function to the signal-free regions from the spectrum. Metabolite maps of [1-13C]pyruvate, [1-13C]lactate, [13C]bicarbonate, [1-13C]pyruvate-hydrate and [1-13C]alanine were generated by integrating the corresponding peaks in the absorption mode after 0th order phase correction in each voxel.
For comparisons between the surgery and contralateral side, regions of interest (ROIs) were selected based on the initial hyperintense region in the T2-weighted 1H MRI and normal-appearing regions in the homologous contralateral hemisphere which include the cortex, portions of the cingulum, corpus callosum and hippocampal subfields immediately below the impact site. The ROIs were replicated for data acquired from the subsequent days. ROIs for the rats with sham surgery were selected based on the 1H MRI in the structurally similar positions to those of the CCI rats. Produced [13C]bicarbonate and [1-13C]lactate were quantified by integrating the peaks in the ROI-averaged spectra from the surgery side and the contralateral side, then normalized by the total 13C signal (sum of [1-13C]pyruvate, [1-13C]lactate, [13C]bicarbonate and [1-13C]pyruvate-hydrate) within the ROI. [1-13C]Alanine was excluded when calculating total 13C signal (tC) due to its negligible presence in the brain. In addition, the bicarbonate-to-lactate ratio was compared between the ROIs. For display purpose, 13C metabolite maps were overlaid on the corresponding 1H T2w MRI and a brain mask was applied to the metabolite ratio maps to maintain reasonable window level. The number in each color bar for normalized 13C map indicates the range of the map after normalizing with the peak intensity of the total 13C map. Contrast between surgery side and contralateral side was calculated as percent difference of signal intensity in the surgery side as compared to that in the contralateral side.
Histology
Brain tissue from six of the CCI rats and seven of the sham rats were randomly selected for histological analysis. Hematoxylin & eosin (H&E) staining and Terminal deoxynucleotidyl transferase mediated UTP End Labeling (TUNEL) were used to examine structural changes and to track cellular apoptosis, respectively. The rats were euthanized at 0 (2 hr), 2, or 5 days post-surgery. Perfusion fixed brains were paraffin processed, embedded, and sectioned according to standard procedures. Serial paraffin sections were concomitantly prepared and checked by dark field microscopy. Resulting sections were stained by H&E and TUNEL immunohistochemistry. TUNEL-stained sections were counterstained with propidium iodide.
Enzyme Assay
PDH and LDH levels were measured from nine CCI and eight sham rats using commercial microplate kits (ab109902 and ab102526, respectively; abcam, Cambridge, UK) and run in triplicate. PDH and LDH levels in tissue from the surgery site and contralateral region were measured at 2 and 5 days post-surgery.
Statistical Analysis
All statistical calculations were done in Microsoft Excel (version 16.63.1). Statistical differences in T2w MRI signal intensity, 13C metabolite level and ratio map intensity, and enzyme activities between the surgery side and contralateral side were evaluated using Student’s paired t-tests (α = 0.05, two-tailed analysis). In addition, two formal comparisons were performed for the regional contrasts between the ROIs (surgery vs. contralateral) in bicarbonate/tC and lactate/tC using a repeated measures ANOVA (α = 0.05) by including (1) CCI rats with complete 13C data of days 0 and 2 (n = 11) and (2) CCI rats with complete 13C data of days 0 and 5 (n = 8) to evaluate progressive metabolic changes of CCI.
Data availability
The data that support the findings of this study are available from the corresponding author, upon reasonable request.
Results
Overall, rats with CCI surgery showed an increase of T2-weighted 1H MRI and hyperpolarized [1-13C]lactate and a decreased of hyperpolarized [13C]bicarbonate, Figure 1B–E. T2-weighted 1H MRI revealed the presence of a contusion in the cerebral cortex after CCI with increased edema under the impact site. Compared to the contralateral region, T2-hyperintensity peaked rapidly with a contrast of 29.5 ± 10.2 % at 2-hr post-injury (P < 0.01, paired t-test), then slowly decreased to 29.3 ± 10.3 % at day 1 (P < 0.01), 26.3 ± 5.8 % at day 2 (P < 0.01), 19.1 ± 9.1 % at day 5 (P < 0.0001), and 3.2 ± 13.2 % at day 10 (P = 0.3), Figure 3A. No T2-lesion was evident in the animals with sham surgery.
Figure 3. Longitudinal Changes of Bicarbonate and Lactate Production after Controlled Cortical Injury.
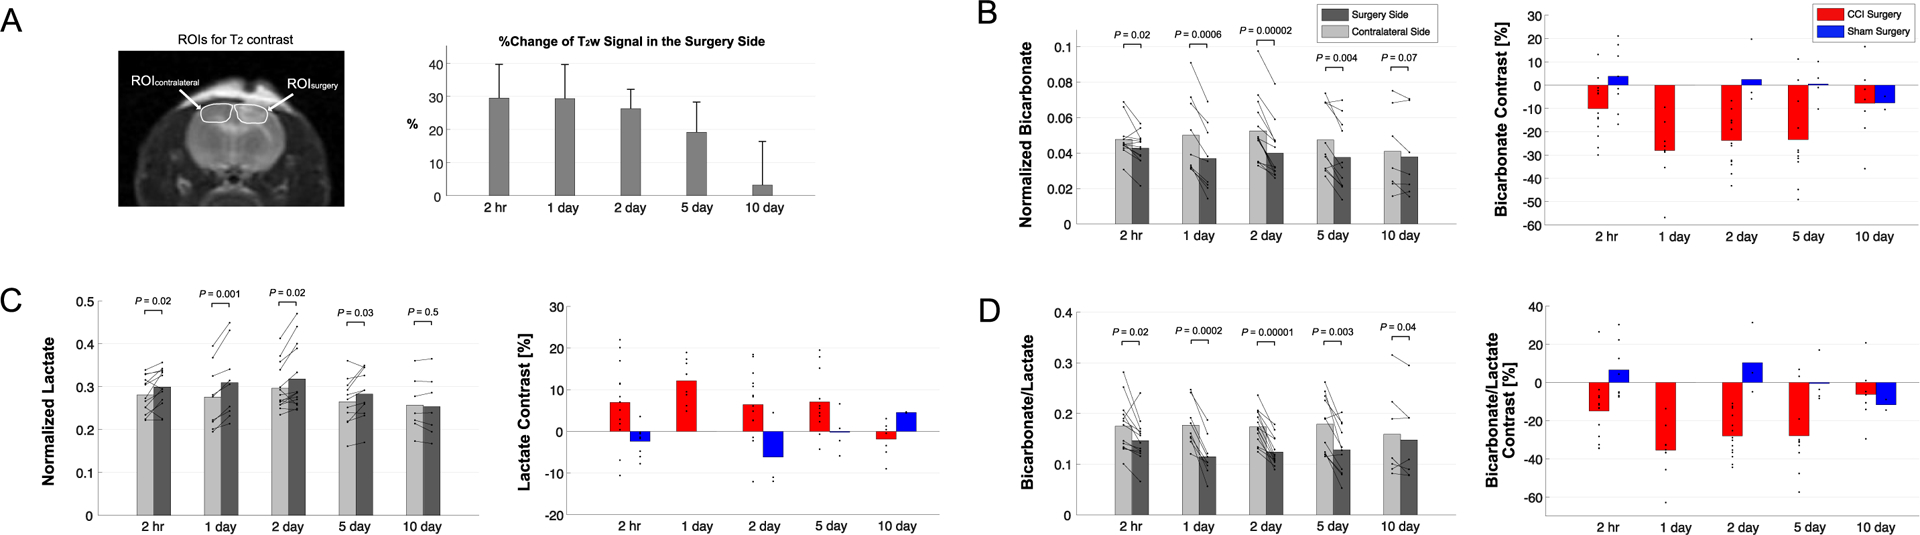
(A) T2 contrast between the surgery side and the contralateral brain region peaked at day 0 (2-hr post-injury) before normalizing at day 10. (B) [13C]Bicarbonate production, normalized to total 13C signal, decreased in the T2-hyperintense lesion of CCI rats as compared to the contralateral normal-appearing brain ROI. (C) Increased [1-13C]lactate production, normalized to total 13C signal, appeared in the T2-hyperintense lesion as compared to the contralateral brain. Peak contrast in bicarbonate and lactate production, and (D) their combined metric [13C]bicarbonate-to-[1-13C]lactate ratio, was seen at day 1 post-injury whereas sham surgery animals showed negligible contrast between ipsilateral and contralateral ROIs.
[13C]Bicarbonate production in the T2 hyperintense lesion was slightly lower ([13C]Bicarbonate/tC = 0.043 ± 0.009) than the contralateral side (0.048 ± 0.010, P = 0.02) at 2-hr post-CCI. The difference in the normalized bicarbonate between the regions peaked at day 1 (0.037 ± 0.019 vs. 0.050 ± 0.022, P = 0.0006) with a contrast of −28.0 ± 13.2 % in the lesion, started to decrease at day 2 (0.040 ± 0.015 vs. 0.053 ± 0.018, P = 0.00002), further decreased at day 5 (0.038 ± 0.020 vs. 0.047 ± 0.019, P = 0.004), and became negligible at day 10 (0.038 ± 0.024 vs. 0.041 ± 0.024, P = 0.07), Figure 3B. The progressive bicarbonate change from the initial bicarbonate drop at 2-hr post-CCI was confirmed from additional longitudinal analysis using a repeated measures ANOVA analysis at day 2 (P = 0.008), demonstrating the delayed metabolic response, but the difference became insignificant at day 5 (2-hr vs 5-day, P = 0.2).
Conversely, lactate production in the lesion was higher at 2-hr post-CCI ([1-13C]lactate/tC = 0.299 ± 0.044) as compared to the contralateral side (0.281 ± 0.042, P = 0.02). The greatest increase in [1-13C]lactate production in the lesion relative to the contralateral was detected at day 1 (0.309 ± 0.085 vs. 0.276 ± 0.074, P = 0.001) and day 2 (0.318 ± 0.076 vs. 0.297 ± 0.053, P = 0.02) with a contrast of 12.1 ± 5.0 % and 6.4 ± 8.3 %, respectively. The contrast between the surgery and contralateral sides decreased gradually at day 5 (0.283 ± 0.057 vs. 0.265 ± 0.055, P = 0.03) and day 10 (0.254 ± 0.070 vs. 0.257 ± 0.064, P = 0.5), Figure 3C. Unlike bicarbonate, progressive changes in lactate production at day 2 and 5 in comparison to 2-hr post-CCI were not statistically significant (repeated measures ANOVA, P > 0.1). The difference in lactate production between the CCI and sham groups was significant at 2-hr post-surgery (P = 0.002) and became less significant at later time points (P = 0.2 at day 2 and day 10). [13C]Bicarbonate-to-[1-13C]lactate ratio reflected the changes in [13C]bicarbonate and [1-13C]lactate together with enhanced contrast between the lesion and the contralateral up to −35.4 ± 13.8 % (day 1, P = 0.0002), Figure 3D. The statistical significance of the difference in bicarbonate-to-lactate ratio between the CCI and sham rats was also attenuated from P = 2 × 10⁻⁸ at 2-hr post-surgery to P = 0.03 at day 5 and P = 0.2 at day 10.
PDH and LDH enzyme activity was consistent with the in-vivo imaging results, Figure 4. At 2 days post-surgery PDH activity of the brain tissue from the surgery side of CCI-induced animals was lower as compared to contralateral brain sections (P = 0.01). A significant increase in LDH activity was also observed in the injured side (P = 0.004) at 2 days post-surgery. These effects remained significant at five days post-surgery for both PDH (P < 0.00001) and LDH (P = 0.003). Sham surgery animals did not show differences in PDH and LDH level in the surgery side (P > 0.1).
Figure 4. Enzyme Analysis:

(A) Pyruvate dehydrogenase (PDH) activity was significantly lower in the injured region of CCI rats compared to contralateral normal-appearing region at both 2 and 5-days post-surgery (P = 0.001). (B) Lactate dehydrogenase (LDH) activity was significantly higher in the injured region compared to the contralateral brain at both 2-day (P = 0.032) and 5-day (P = 0.007) post-injury. The sham-surgery group did not show differences in PDH and LDH activity between hemispheres (P > 0.1). (*P < 0.05, ** P < 0.01).
H&E staining revealed vacuolated neuropil, consistent with the parenchymal injury following CCI. Evidence of structural damage was not detectable within sham surgery animals, indicating that the brain was not physically harmed while removing the skull cap (Figure S1A). Sections stained with TUNEL showed evidence of late cellular apoptosis within cells with extensive DNA fragmentation. Cellular apoptosis could be observed only with the CCI animals and found to be highest at day 2 post-injury (Figure S1B).
While the PDH flux in the normal-appearing contralateral brain region was similar to that seen in sham-surgery animals, a subset of the CCI rats showed noticeable increase in bicarbonate production at day 2 post-surgery in the normal-appearing brain, Figure 5A–B. This short-lived bicarbonate surge was not observed in animals following sham surgery.
Figure 5. Bicarbonate in the Contralateral Brain at Day 2 Post-CCI.

(A) Increased bicarbonate production was observed in the contralateral normal-appearing brain in a subset of the animals with CCI surgery. (B) Representative bicarbonate maps from four of these animals (indicated as red solid lines in Fig. 5A) that showed largest increases in [13C]bicarbonate production by 2 days post-injury. (C) Proposed mechanism for enhanced bicarbonate production in contralateral normal-appearing brain regions.
Discussion
Bicarbonate as an indicator of PDH flux and mitochondrial function
This study demonstrates the ability of in-vivo 13C MRSI in coordination with hyperpolarized [1-13C]pyruvate to provide new information regarding the temporal and spatial metabolic changes after traumatic injury in rodents. Notably, pyruvate conversion to acetyl-CoA and bicarbonate via PDH in the mitochondria drops acutely in the surgery-impacted cortical region. The decrease in bicarbonate production represents a loss of mitochondrial function25 in CCI-affected brain tissue and is consistent with previous literature findings.16,17 These results, coupled with the decrease in PDH activity measured ex vivo, indicate the injured brain has a reduced capacity to utilize energy efficient aerobic metabolism post-injury. However, this reduced capacity was temporary as the bicarbonate production gradually returned to pre-injury levels at around 10 days from the initial injury.
Lactate reflects LDH activity and glycolysis
As seen in previous studies,16,17 we observed an increase in lactate production only within the surgery side of the brain in TBI animals. This increase was associated with concomitant increase in LDH activity. Increased lactate is generally representative of neuroinflammation, resulting in glial activation and associated hyperglycolysis14,26. In addition to TBI, increased [1-13C]lactate in multiple sclerosis was reported as a neuroinflammation-linked metabolic phenotype.27 In our study, the greatest increase in [1-13C]lactate production in the lesion area was detected at day 1 post-injury and restored back to normal by day 10 following a similar timeline as [13C]bicarbonate. In the normal brain, the opposite but concurrent changes in both lactate and bicarbonate can be interpreted as metabolic interaction between neurons and astrocytes, the generators and the consumers of lactate, as described by the astrocyte-neuron lactate shuttle (ANLS) hypothesis.28 The ANLS can be impaired after TBI, where a buildup of extracellular lactate, as a result of an uncoupling of metabolism between damaged neurons and glia, leads to consequential negative side-effects.26 Moreover, the contrast change in lactate signal between the injured and the contralateral brain regions was much smaller than that in bicarbonate signal. Together with [13C]bicarbonate signal, the markedly decreased [13C]bicarbonate-to-[1-13C]lactate ratio indicates the immediate shift of cerebral metabolism towards anaerobic metabolism due to inability to utilize mitochondrial membrane dependent aerobic metabolism.25
Longitudinal metabolic changes in acute TBI
Interestingly, the temporal pattern of change in both bicarbonate and lactate were not aligned with the change in T2 contrast. Although the metabolic responses to injury were still acute, the appearance of maximum metabolic alterations in both bicarbonate and lactate production was a day after the peak T2 contrast, which was evident immediately after the surgery (2-hr post-injury). This is consistent with previous literature findings that lactate levels tapper off approximately at 120 hours.29 The distinct pattern of T2 contrast and 13C-products time course following TBI is likely due to delayed cellular responses to the release of damage-associated molecular patterns, which triggers post-traumatic neuroinflammation. We also observed apoptosis within this temporal window. Consistent with previous studies, we found peak apoptotic signals two days post-TBI induction within the damaged tissue.30 The apoptotic signaling pathway represents an energy consuming mechanism that can mediate lactate levels within TBI.25
Increased bicarbonate in normal-appearing brain
The PDH flux in the normal-appearing brain region remained mostly unchanged, with occasional elevated cases. In contrast to an overall decrease in bicarbonate production in the CCI-affected tissue, a few rats with CCI surgery showed a mirrored increase of bicarbonate in the contralateral normal-appearing brain at day 2 post-injury. We hypothesize that these results indicate crosstalk between neuronal damage and glial responses to promote allostatic response to ATP levels,31 suggesting that the potential compensatory role of undamaged brain tissue while damaged tissue undergoes metabolic transformation. It is possible that the lactate pool is being utilized in alternative ways to compensate for the loss of metabolic stability. One explanation could be that lactate is being converted back to pyruvate due to the observed apoptosis, which is known to reduce NADH pools.32 Another possibility, as illustrated in Figure 5C, is that the lactate from the lesion is shunted to unimpacted brain tissues for efficient TCA cycle utilization, producing bicarbonate. Indeed, lactate is known to be released and shunted towards areas of high metabolic demand during exercise, stress, and area specific cognition.33,34 This phenomenon is related to relationship between astrocytes and neurons where it is hypothesized that astrocytes primarily uptake energy sources from the blood, metabolize sources to lactate, and then directly shuttle lactate to the neuron for utilization.26 This theory is consistent with our observation of increased bicarbonate in the contralateral healthy brain tissue and no associated altered levels of lactate. Perhaps the activated PDH flux in the normal-appearing brain is another metabolic shift towards compensatory mechanisms, along with the enhanced pentose phosphate pathway,15 to prevent lactate accumulation and maximize efficiency while minimizing damage within the injured tissue.
Metabolic changes in remote ipsilateral or contralateral brain regions were observed in previous studies. Sutton, et al.35 described evolving changes in local cerebral glucose utilization using [14C]2-deoxyg-D-glucose autoradiography adjacent to and underneath the site of a CCI injury which, over time, expanded into a larger portion of the ipsilateral cerebral cortex, ipsilateral thalamus, and contralateral cortex over a 10-day period post-injury. This observation was replicated by Jiang, et al.36 in a fluid percussion injury model. Using proton MRS, a contralateral reduction in NAA was reported at 72 hours post-injury.37 More recently, evidence of sustained or increased metabolism has been reported in contralateral regions. Using 13C MRS, Scafidi, et al.38 noted early (within 60 min) increases in glutamate and glutamine labeling via PDH and PC in both the ipsilateral and contralateral hemispheres of immature rat brains following CCI. Shijo, et al.39 reported a contralateral increase in lactate labeling and reduced glutamine labeling at 24 hours post-CCI injury in adult rats, suggesting enhanced glycolysis and reduced anaplerotic activity. The mechanisms that underlie the evolving metabolic changes in the contralateral homotopic regions remain to be elucidated, we believe that it is very likely that these effects reflect the involvement of the contralateral homologous region with ipsilateral function and connectivity.40,41
Limitations and future study
One of the major limitations of this study is the inability to separate neuron from glial cells in cellular and metabolic transformation. The gradually restored bicarbonate production in the injured site may indicate that the brain tissue has recovered over time, but it may also reflect an influx of metabolically active cells such as microglia, macrophages, and astrocytes. Indeed, previous studies suggest that TBI induces temporal changes in metabolite trafficking between neurons and astrocytes.26,42 Being able to separate the distinct contributions of neurons and glia would allow us to better track [1-13C]pyruvate metabolism and understand their respective roles. To acknowledge the source of bicarbonate production, our future study will include comparison between in-vivo [13C]bicarbonate images and ex-vivo cell-type-specific immunohistochemical markers as well as high-resolution mass-spectrometry images. It is also important to note that high doses of pyruvate have shown to be protective against stimulated apoptosis in the brain,43 and the serial injections of pyruvate bolus may have protected rodents from further apoptosis beyond day 2 post-TBI. In addition, we found that for intra-subject temporal and inter-subject comparisons, the product-ratio was more consistent and reliable than individual metabolite levels (e.g., lactate and bicarbonate normalized to the total carbon signals). This is likely because we used a preclinical dose in a clinical polarizer, resulting in a discrepancy in the final dissolution volume (6 – 8 mL) and therefore, final pyruvate concentration. Finally, the inconsistent but noticeable bicarbonate surge in the normal-appearing brain needs further investigation. Understanding the metabolic compensatory mechanisms of brain tissue is not only important from a biological perspective but also in the future develop of regionally and temporal target therapeutics.
Conclusion
Understanding the longitudinal changes of cerebral metabolism that occur after traumatic injury is essential for providing adequate patient care. Mitochondrial dysfunction is a major metabolic phenotype of TBI but has been a challenging target to monitor noninvasively in-vivo. This work demonstrates that pyruvate flux into the mitochondria via PDH is sensitive to brain injury and [13C]bicarbonate produced from hyperpolarized [1-13C]pyruvate is a noninvasive imaging biomarker that detects the altered PDH activity in the brain.
Supplementary Material
Acknowledgments
We appreciate Dr. Chao Xing for his advice on statistical evaluation. We also thank the National Institutes of Health of the United States (R01 NS107409, P41 EB015908, S10 OD018468, P30 DK127984), the Texas Institute for Brain Injury and Repair and the Welch Foundation (I-2009-20190330) for funding support.
Footnotes
Disclosure/Conflict of Interest: The authors declare no competing interests.
References
- 1.Selassie AW, Zaloshnja E, Langlois JA, Miller T, Jones P, Steiner C. Incidence of long-term disability following traumatic brain injury hospitalization, United States, 2003. J Head Trauma Rehabil. 2008;23(2):123–131. [DOI] [PubMed] [Google Scholar]
- 2.Zaloshnja E, Miller T, Langlois JA, Selassie AW. Prevalence of long-term disability from traumatic Brain Injury in the civilian population of the United Statet 2005. J Head Trauma Rehabil. 2008;23(6):394–400. [DOI] [PubMed] [Google Scholar]
- 3.Taylor C, Bell JM, Breiding MJ, Xu L. Morbidity and Mortality Weekly Report Traumatic Brain Injury-Related Emergency Department Visits, Hospitalizations, and Deaths-United States, 2007 and 2013 Surveillance Summaries. Surveill Summ. 2017;66(9):1–8. [DOI] [PMC free article] [PubMed] [Google Scholar]
- 4.McKenna MC, Scafidi S, Robertson CL. Metabolic Alterations in Developing Brain After Injury: Knowns and Unknowns. Neurochem Res. 2015;40(12):2527–2543. [DOI] [PMC free article] [PubMed] [Google Scholar]
- 5.Roozenbeek B, Maas AIR, Menon DK. Changing patterns in the epidemiology of traumatic brain injury. Nat Rev Neurol. 2013;9(4):231–236. [DOI] [PubMed] [Google Scholar]
- 6.Kolias AG, Guilfoyle MR, Helmy A, Allanson J, Hutchinson PJ. Traumatic brain injury in adults. Pract Neurol. 2013;13(4):228–235. [DOI] [PubMed] [Google Scholar]
- 7.Kato T, Nakayama N, Yasokawa Y, Okumura A, Shinoda J, Iwama T. Statistical image analysis of cerebral glucose metabolism in patients with cognitive impairment following diffuse traumatic brain injury. J Neurotrauma. 2007;24(6):919–926. [DOI] [PubMed] [Google Scholar]
- 8.Cecil KM, Hills EC, Sandel ME, et al. Proton magnetic resonance spectroscopy for detection of axonal injury in the splenium of the corpus callosum of brain-injured patients. J Neurosurg. 1998;88(5):795–801. [DOI] [PubMed] [Google Scholar]
- 9.George EO, Roys S, Sours C, et al. Longitudinal and prognostic evaluation of mild traumatic brain injury: A 1H-magnetic resonance spectroscopy study. J Neurotrauma. 2014;31(11):1018–1028. [DOI] [PubMed] [Google Scholar]
- 10.Holshouser BA, Tong KA, Ashwal S. Proton MR spectroscopic imaging depicts diffuse axonal injury in children with traumatic brain injury. Am J Neuroradiol. 2005;26(5):1276–1285. [PMC free article] [PubMed] [Google Scholar]
- 11.Ross BD, Ernst T, Kreis R, et al. 1H MRS in acute traumatic brain injury. J Magn Reson Imaging. 1998;8(4):829–840. [DOI] [PubMed] [Google Scholar]
- 12.Shutter L, Tong KA, Holshouser BA. Proton MRS in acute traumatic brain injury: Role for glutamate/glutamine and choline for outcome prediction. J Neurotrauma. 2004;21(12):1693–1705. [DOI] [PubMed] [Google Scholar]
- 13.Govind V, Gold S, Kaliannan K, et al. Whole-brain proton MR spectroscopic imaging of mild-to-moderate traumatic brain injury and correlation with neuropsychological deficits. J Neurotrauma. 2010;27(3):483–496. [DOI] [PMC free article] [PubMed] [Google Scholar]
- 14.Lama S, Auer RN, Tyson R, Gallagher CN, Tomanek B, Sutherland GR. Lactate storm marks cerebral metabolism following brain trauma. J Biol Chem. 2014;289(29):20200–20208. [DOI] [PMC free article] [PubMed] [Google Scholar]
- 15.Bartnik BL, Sutton RL, Fukushima M, Harris NG, Hovda DA, Lee SM. Upregulation of pentose phosphate pathway and preservation of tricarboxylic acid cycle flux after experimental brain injury. J Neurotrauma. 2005;22(10):1052–1065. [DOI] [PubMed] [Google Scholar]
- 16.Guglielmetti C, Chou A, Krukowski K, et al. In vivo metabolic imaging of Traumatic Brain Injury. Sci Rep. 2017;7(1):1–10. [DOI] [PMC free article] [PubMed] [Google Scholar]
- 17.Devience SJ, Lu X, Proctor J, et al. Metabolic imaging of energy metabolism in traumatic brain injury using hyperpolarized [1–13C]pyruvate. Sci Rep. 2017;7(1):1–7. [DOI] [PMC free article] [PubMed] [Google Scholar]
- 18.Hackett EP, Pinho MC, Harrison CE, et al. Imaging Acute Metabolic Changes in Patients with Mild Traumatic Brain Injury Using Hyperpolarized [1–13C]Pyruvate. iScience. 2020;23(12):101885. [DOI] [PMC free article] [PubMed] [Google Scholar]
- 19.Diamond MP, Simonson DC, DeFronzo RA. Menstrual cyclicity has a profound effect on glucose homeostasis. Fertil Steril. 1989;52(2):204–208. [PubMed] [Google Scholar]
- 20.Spellacy WN, Carlson KL, Schade SL. Menstrual cycle carbohydrate metabolism: Studies on plasma insulin and blood glucose levels during an intravenous glucose tolerance test. Am J Obstet Gynecol. 1967;99(3):382–386. [DOI] [PubMed] [Google Scholar]
- 21.Dixon CE, Clifton GL, Lighthall JW, Yaghmai AA, Hayes RL. A controlled cortical impact model of traumatic brain injury in the rat. J Neurosci Methods. 1991;39(3):253–262. [DOI] [PubMed] [Google Scholar]
- 22.Mayer D, Yen YF, Takahashi A, et al. Dynamic and high-resolution metabolic imaging of hyperpolarized [1– 13C]-pyruvate in the rat brain using a high-performance gradient insert. Magn Reson Med. 2011;65(5):1228–1233. [DOI] [PMC free article] [PubMed] [Google Scholar]
- 23.Park JM, Recht LD, Josan S, et al. Metabolic response of glioma to dichloroacetate measured in vivo by hyperpolarized 13C magnetic resonance spectroscopic imaging. Neuro Oncol. 2013;15(4):433–441. [DOI] [PMC free article] [PubMed] [Google Scholar]
- 24.Park JM, Josan S, Grafendorfer T, et al. Measuring mitochondrial metabolism in rat brain in vivo using MR Spectroscopy of hyperpolarized [2–13C]pyruvate. NMR Biomed. 2013;26(10):1197–1203. [DOI] [PMC free article] [PubMed] [Google Scholar]
- 25.Werner C, Engelhard K. Pathophysiology of traumatic brain injury. Br J Anaesth. 2007;99(1):4–9. [DOI] [PubMed] [Google Scholar]
- 26.Carpenter KLH, Jalloh I, Hutchinson PJ. Glycolysis and the significance of lactate in traumatic brain injury. Front Neurosci. 2015;9(APR):1–15. [DOI] [PMC free article] [PubMed] [Google Scholar]
- 27.Guglielmetti C, Najac C, Didonna A, Van Der Linden A, Ronen SM, Chaumeil MM. Hyperpolarized 13C MR metabolic imaging can detect neuroinflammation in vivo in a multiple sclerosis murine model. Proc Natl Acad Sci U S A. 2017;114(33):E6982–E6991. [DOI] [PMC free article] [PubMed] [Google Scholar]
- 28.Pellerin L, Pellegri G, Bittar PG, et al. Evidence supporting the existence of an activity-dependent astrocyte-neuron lactate shuttle. Dev Neurosci. 1998;20(4–5):291–299. [DOI] [PubMed] [Google Scholar]
- 29.Hovda DA, Lee SM, Smith ML, et al. The Neurochemical and Metabolic Cascade Following Brain Injury: Moving from Animal Models to Man. J Neurotrauma. 1995;12(5):903–906. [DOI] [PubMed] [Google Scholar]
- 30.Rink A, Fung KM, Trojanowski JQ, Lee VMY, Neugebauer E, McIntosh TK. Evidence of apoptotic cell death after experimental traumatic brain injury in the rat. Am J Pathol. 1995;147(6):1575–1583. [PMC free article] [PubMed] [Google Scholar]
- 31.Mason S Lactate Shuttles in Neuroenergetics — Homeostasis, Allostasis and Beyond. Front Neurosci. 2017;11(February):1–15. [DOI] [PMC free article] [PubMed] [Google Scholar]
- 32.Miramar MD, Costantini P, Ravagnan L, et al. NADH Oxidase Activity of Mitochondrial Apoptosis-inducing Factor. J Biol Chem. 2001;276(19):16391–16398. [DOI] [PubMed] [Google Scholar]
- 33.Dienel GA. Brain lactate metabolism: The discoveries and the controversies. J Cereb Blood Flow Metab. 2012;32(7):1107–1138. [DOI] [PMC free article] [PubMed] [Google Scholar]
- 34.Dienel GA, Hertz L. Glucose and lactate metabolism during brain activation. J Neurosci Res. 2001;66(5):824–838. [DOI] [PubMed] [Google Scholar]
- 35.Sutton RL, Hovda DA, Adelson PD, Benzel EC, Becker DP. Metabolic changes following cortical contusion: relationships to edema and morphological changes. Acta Neurochir Suppl (Wien). 1994;60:446–448. [DOI] [PubMed] [Google Scholar]
- 36.Jiang X Bin, Ohno K, Qian L, et al. Changes in local cerebral blood flow, glucose utilization, and mitochondrial function following traumatic brain injury in rats. Neurol Med Chir (Tokyo). 2000;40(1):16–29. [DOI] [PubMed] [Google Scholar]
- 37.Schuhmann MU. 1H-MR spectroscopic monitoring of posttraumatic metabolism following controlled cortical impact injury: Pilot study. Acta Neurochir Suppl. 1999;76:3–7. [DOI] [PubMed] [Google Scholar]
- 38.Scafidi S, O’Brien J, Hopkins I, Robertson C, Fiskum G, McKenna M. Delayed cerebral oxidative glucose metabolism after traumatic brain injury in young rats. J Neurochem. 2009;109(SUPPL. 1):189–197. [DOI] [PMC free article] [PubMed] [Google Scholar]
- 39.Shijo K, Sutton RL, Ghavim SS, Harris NG, Bartnik-Olson BL. Metabolic fate of glucose in rats with traumatic brain injury and pyruvate or glucose treatments: A NMR spectroscopy study. Neurochem Int. 2017;102:66–78. [DOI] [PMC free article] [PubMed] [Google Scholar]
- 40.Harris NG, Chen SF, Pickard JD. Cortical reorganization after experimental traumatic brain injury: A functional autoradiography study. J Neurotrauma. 2013;30(13):1137–1146. [DOI] [PMC free article] [PubMed] [Google Scholar]
- 41.Harris NG, Verley DR, Gutman BA, Thompson PM, Yeh HJ, Brown JA. Disconnection and hyper-connectivity underlie reorganization after TBI: A rodent functional connectomic analysis. Exp Neurol. 2016;277:124–138. [DOI] [PMC free article] [PubMed] [Google Scholar]
- 42.Bartnik-Olson BL, Oyoyo U, Hovda DA, Sutton RL. Astrocyte oxidative metabolism and metabolite trafficking after fluid percussion brain injury in adult rats. J Neurotrauma. 2010;27(12):2191–2202. [DOI] [PMC free article] [PubMed] [Google Scholar]
- 43.Ullah N, Naseer MI, Ullah I, Lee HY, Koh PO, Kim MO. Protective effect of pyruvate against ethanol-induced apoptotic neurodegeneration in the developing rat brain. Neuropharmacology. 2011;61(8):1248–1255. [DOI] [PubMed] [Google Scholar]
Associated Data
This section collects any data citations, data availability statements, or supplementary materials included in this article.
Supplementary Materials
Data Availability Statement
The data that support the findings of this study are available from the corresponding author, upon reasonable request.