

Abstract
The cytochrome P450 (CYP450) enzyme system is responsible for the metabolism of more than two-thirds of xenobiotics. This review summarizes reports of a series of in silico tools for CYP450 enzyme–drug interaction predictions, including the prediction of sites of metabolism (SOM) of a drug and the identification of inhibitor/substrates for CYP subtypes. We also evaluated four prediction tools to identify CYP inhibitors utilizing 52 of the most frequently prescribed drugs. ADMET Predictor and CYPlebrity demonstrated the best performance. We hope that this review provides guidance for choosing appropriate enzyme prediction tools from a variety of in silico platforms to meet individual needs. Such predictions are useful for medicinal chemists to prioritize their designed compounds for further drug discovery.
Keywords: cytochrome P450, CYP450 prediction, drug discovery, CYP450 inhibitor, CYP450 metabolism, drug research and development
Drug fate after administration
Drugs, most of which are xenobiotics, can cause changes in human physiological or psychological conditions after consumption. To date, there are over 20 000 prescription drug products approved by the US Food and Drug Administration (FDA),1 aimed at a range of common and rare diseases. After a drug is administered, it can be absorbed, distributed, metabolized and excreted (ADME) via different mechanisms according to its compound properties, which are important factors for determining its pharmacokinetics (PK).
Phase I and II metabolism
Drug metabolism in the human body involves enzymatic and endobiotic compound-mediated structural modifications of drugs. It occurs in two phases: phase I and phase II.2 Phase I encompasses functionalization reactions, such as hydrolysis, reduction, and oxidation, and primarily occurs in the liver,2–5 where cytochrome P450 (CYP450) contributes to over two-thirds of xenobiotic metabolism.6,7 Prodrugs can be converted to active metabolites or can deactivate active parent drugs, altering their bioavailability and toxicity.3
Phase II metabolism, known as conjugation reactions, involves further biotransformation of phase I drug metabolites to reduce their toxicity and increase their hydrophilicity.7 Drugs increase in molecular weight and polarity, making them less likely to diffuse across membranes, facilitating excretion.7,8 This phase occurs primary in the liver, followed by the kidney, gut, and lung.8
Importance of, and barriers to, drug metabolism prediction
The metabolic properties of a drug have a crucial role in PK research. The expression levels of various drug metabolic enzymes can vary significantly among individuals. For instance, genetic variations in CYP2C9 and CYP2C8 can result in distinct concentration–time profiles of oral antidiabetic drugs, leading to potential hypoglycemia in individuals with poor metabolism resulting from over-regulation.9 Additionally, drug metabolic enzymes can be influenced by various factors in clinical settings, such as drug–drug interactions (DDIs),10,11 drug–disease interactions,12–14 drug–food interactions,15–17 and scenarios involving multiple treatments, especially in older patients.18 All these factors collectively contribute to determining drug susceptibility during the metabolic phase, as reflected by the kinetic constants of metabolic enzymes for specific drugs. Therefore, achieving optimal dosing based on drug metabolic levels is crucial for precision medicine. This approach allows for maximum drug efficacy while mitigating potential adverse effects. However, acquiring experimental data or predicting in silico drug metabolism parameters, including the identification of inhibitors/substrates/inducers and the prediction of metabolic enzyme kinetic constants, is challenging because of the complex interplay of factors involved in drug biotransformation once they enter the body. Relevant in vitro and in vivo experiments are costly and usually take weeks to months to conduct19; moreover, in vivo/in vitro extrapolation (IVIVE) knowledge requires further development.20,21 For computational prediction tools, cases always need to be flawless for the construction of prediction models and even then, discrepancies can occur.22
In silico prediction for drug metabolism
With the development of computational technology, computer-aided drug design (CADD) and development is having an increasing role.23 The elevation of calculation accuracy has contributed to more reliability of in silico prediction for drug metabolism.24 The prediction techniques used this field started to emerge around the start of the century,25,26 and cover the drug interaction with both phase I and phase II enzymes, potential SOM, whether a compound is a potential substrate, inhibitor or inducer, and possible compound metabolites.27,28 The prediction quality of such approaches has been improved by using advanced algorithms and enlarged data sets as more drug metabolism information has been acquired and summarized. Ligand-based metabolism prediction, structure-based metabolism prediction, and machine learning are the main computational techniques used.29–31 Although the prediction performance among different studies is not precisely comparable given their different data sizes and evaluation matrixes, the overall prediction quality is still increased.31–49 Computational prediction technologies of drug metabolism properties have also been applied to hit/lead optimization and dosing development/optimization.50,51
To date, only a few publications have reviewed drug metabolism prediction.52,53 Most studies only provide a general overview of the metabolism prediction of CYP450 enzymes, but lack detailed information on specific CYP enzyme subtypes. A few review articles included metabolism predictions for CYP subtypes,54,55 but some important tools were missing and more tools have been developed since . Furthermore, these reviews solely focused on the performance reports of the tools provided by the developers. The actual performance of these tools by users has not yet been compared and neither have their user-friendliness and the level of prediction flexibility (such as the ability to manually adjust prediction criteria according to user preference) been thoroughly examined. Consequently, users face difficulties in selecting the most suitable metabolism prediction tool from a multitude of prediction servers.
This review briefly summarizes and compares the role of a series of in silico tools in terms of their prediction capabilities for CYP-related drug metabolism. Moreover, the predictions of compounds serving as inhibitors of specific enzymes are also compared to literature relating to several currently available prediction tools/webservers. Specifically, the accuracy, specificity, and sensitivity of the prediction for each CYP enzyme subtype are assessed across several prediction platforms. The results provide a comprehensive insight into the predictive capabilities of various prediction tools. When researchers are looking for prediction tools related to CYP-mediated activities, these findings could be used to select the most appropriate tools to meet their needs. In cases where the tools offer probability values instead of binary outcomes, users can also customize the thresholds for metrics, such as sensitivity and specificity, to better align with their research needs.
Recently developed CYP-mediated drug metabolism tools and platforms
SMARTCyp
The non-commercial webserver SMARTCyp is continuously developing and has been reported by a series of publications. It is a fragment-based prediction tool that can provide SOM predictions of CYP450 during drug metabolism. The first generation of this web server predicted SOM of CYP3A4 from the 2D structure of a molecule.32 The prediction is made by combining reactivity and accessibility calculations of the enzyme to different sites of an input. For reactivity descriptions, pattern matching is conducted between the query compounds and the calculation rules (SMARTS Rules) summarized by the developers to calculate activation energies for different atoms in the query compounds. The higher probability of a SOM, the lower the activation energy. The action site accessibility is evaluated by computed results of the topological bond path distances, which indicate how atoms are connected with each other in 3D space. The first version of SMARTCyp algorithm was tested with 394 compounds using experimental SOM information. The prediction results included the predicted SOM with ranking, and 42% out of these compounds generated top-ranked positions matching the metabolites. The fast prediction speed is also one of its advantages, reporting the computation of three compounds per second.
The following generation of the SMARTCyp web server adopted a refined SMARTS rule system and the accuracy of prediction was validated with 361 drug-like CYP3A4 substrates, demonstrating an improved accuracy of 2%.33 As for other CYP isoforms, preliminary validation was also performed and the result exhibited similar performance for CYP1A2, 2A6, 2B6, 2C8, 2C19, and 2E1.
The latest version of SMARTCyp is based on more new SMARTS rules, enabling predictions for not only 3A4 metabolism, but also 2C9 and 2D6 metabolism.34,35 The top 1% ranking models for CYP3A4, 2C9, and 2D6 report an accuracy of 65.4%, 58.8%, and 49.3%, respectively, but the total number of compounds is unknown.35
PreMetabo
PreMetabo is an in silico phase I and phase II drug metabolism prediction platform, with the phase I prediction of SOM for CYP1A2, CYP2C9, CYP2D6 and CYP3A4, inhibitor identification for CYP2C9, 2C19, 2D6, and 3A4, as well as substrate recognition for CYP2D6 and 3A4, utilizing the structure-based method.36 The predictions are conducted according to the calculated activation energy, combining the activation energy of Metabolism reaction and the Effective Atomic Descriptor (EaMEAD) model as well as the binding free energy calculated from the docking algorithm. The Fujitsu ADME database, which contains 200 substrates with different levels of fragments and structural diversity, was used for the validation. After comparing with the experimental results of these substrates, the prediction performance of PreMetabo gave better prediction accuracy compared with that using the EaMEAD model alone. The top SOM prediction accuracies achieved by PreMetabo for each CYP subenzyme were 52.5%, 59.5%, 51.5%, and 48.5% for CYP3A4, CYP1A2, CYP2C9, and CYP2D6, respectively.
RS-predictor
RegioSelectivity-Predictor (RS-Predictor) is a non-commercial tool developed to predict SOM for CYP3A4.37 It was designed to combine topological and quantum chemical descriptors to represent the potentiality of metabolic reaction sites. The descriptors were originally defined and summarized by the developers in their publication, which includes the meaning of each descriptor as well as the range of values. Through these descriptors, the atom 3D connection and molecular chemical properties were detailed. Multiple instance ranking (MIRank), a ranking method similar to support vector machine (SVM), was utilized to generate descriptor weight. The training set database comprised 394 CYP3A4 substrates collected from the literature. The prediction models were calibrated with 322 compounds from a Merck data set. The validation of prediction performance was conducted using an external test set of 72 additional substrates, showing equal or better results than those of previously published prediction methods. The predicted top-one ranked positions could identify at least one action site for 60.3% of substrates. This tool has also been further developed as a web tool named RS-WebPredictor and the prediction of SOM has been applied to more CYP isoforms, including 2C9, 2D6, 1A2, 2A6, 2B6, 2C8, 2C19, and 2E1.38,39 Specifically, RS-WebPredictor is the first web server to predict the regioselectivity of the latter six isozymes.
SOMP
SOMP is a web server that can predict SOM for drug-like compounds. The prediction model was constructed based on a Bayesian-like algorithm named PASS (prediction of activity spectra for substances), utilizing LMNA (labeled multilevel neighborhoods of atom) descriptors.40,41 Based on the structural formula of chemicals, SOM can be predicted for five major phase I CYP enzymes (CYP3A4, CYP2D6, CYP2C9, CYP2C19, and CYP1A2) when the enzymes interact with compounds. During construction of the prediction model, databases with in vitro and in vivo experimental results were used for positive training, whereas structures with non-SOM atoms (i.e., atoms not involved in chemical structural changes) were used as negative training examples. The prediction performance was validated by external evaluation sets comprising 68 cardiovascular drugs and the precision was compared with that of two other web servers, SMARTCyp and RS-WebPredictor. As a result, the prediction performance of this tool is comparable or superior to that of the other two web servers in SOM prediction for CYP enzymes, with the first-ranked model for CYP3A4, 2D6, 2C9, 2C19 and 1A2 reporting an accuracy of 69%, 43%, 58%, 46%, and 47%, respectively.
Xenosite
Xenosite is prediction module designed as a web server to predict CYP-mediated SOM for compounds using neural networks algorithm; the model calibration was conducted through leave-one-out cross-validation.42,43 The prediction involves nine enzymes (CYP1A2, 2A6, 2B6, 2C8, 2C9, 2C19, 2D6, 2E1, and 3A4) and not only outputs rankings of possible SOM, but also provides prediction confidence. The training set included over 680 compounds with SOM information, and multiple descriptor systems were utilized, including topological and quantum chemical descriptors, a SMAERCyp reactivity descriptors, and fingerprint similarity descriptors. It exhibited very close or better performance for the prediction of different CYP isoforms compared with RS-Predictor. A comparison of performance was also conducted with other web servers, software tools, and models, including SMARTCyp, StarDrop, and Schrodinger. Xenosite showed the best accuracy among these methods for predicting SOM of CYP substrates, reporting an accuracy of 87.0%.
SOME
The accessible program SOME aims to predict the SOM of six biotransformations mediated by CYP450. Different from other prediction tools, this platform predicts six transformation types: aliphatic C-hydroxylation, aromatic C-hydroxylation, N-dealkylation, O-dealkylation, N-oxidation, and S-oxidation. The training data came from the MDL Metabolite database44 and SVM classifiers were developed. The six classes of biotransformation are described by SMARTS pattern and 23 quantum chemical (QC) features were also considered, with feature selection conducted. The trained models were validated by external data, including 24 compounds with SOM information. The final prediction performance of the model was not compared with other prediction tools, but both internal and external validations indicated a successful performance. The overall accuracy for six reaction predictions was over 81%.
ADMETlab
ADMETlab is a machine-learning-based non-commercial online web tool that enables the prediction of a series of physical properties of a compound.46 The metabolism prediction for inputs from this platform includes evaluating whether an input can serve as a substrate or inhibitor of CYP1A2, 2C9, 2C19, 2D6, and 3A4, with corresponding prediction confidence. The data were collected from ChEMBL,56 EPA,57 and DrugBank Database, comprising 288 967 entries.58 Six model algorithms were involved: random forest (RF), SVM, recursive partitioning regression (RP), partial least square (PLS), naïve Bayes (NB), and decision tree (DT). In addition, 403 descriptors belonging to 11 descriptor types (constitution, topology, connectivity, E-state, Kappa, basak, burden, autocorrelation, charge, property, and MOE-type descriptors) were utilized for regression model generation. Fingerprints were utilized to construct classification models. The final generated best performance models for five enzymes all achieved accuracy above 70.2%, and the best model was for the prediction of CYP1A2 inhibitors, reporting an accuracy of 86.7%.
SuperCYPsPred
Different from those web tools that predict SOMs, SuperCYPsPred, a non-commercial webserver, was developed to predict drug inhibition specificity on CYP isoforms,45 focusing on five main isoenzymes: CYP1A2, CYP2C9, CYP2C19, CYP2D6, and CYP3A4. The likelihood for the input medication acting as an active or inactive inhibitor of each enzyme can be estimated. RDKit descriptors were utilized and the prediction model was built under the random forest (RF) algorithm based on a data set of 177 143 substances with in vitro data against the five isoforms of CYPs. Tenfold cross-validation was conducted for model optimization, and external validation sets also reported satisfactory results. Most of the enzyme prediction models reported an accuracy >90%, except for the CYP2D6 cross-validation model and external validation models for CYP2D6 and 3A4. Additionally, SuperCYPsPred also contains a knowledge database with information on 1170 drugs, including more than 3800 known DDIs. Users can also gain recommended alternative drugs when predicting DDI between drugs from this web server.
CYPlebrity
CYPlebrity is also a free online tool that mainly aims to predict inhibitors of CYP450 enzymes.31 It also focuses on five main CYP enzymes: 1A2, 2C9, 2C19, 2D6, and 3A4. The input training set was from several databases, including PubChem, ChEMBL, and ADME, involving 134 250 molecules, also with RKDit descriptors utilized for model training. RF classifiers were developed for prediction within a tenfold cross-validation framework, and the final performance was comparable to that of SuperCYPsPred (see above). In terms of model specificity, CYPlebrity outperforms SuperCYPsPred, but the latter delivers more acceptable results in terms of prediction sensitivity. The overall accuracy of CYPlebrity is 4% lower than that of SuperCYPsPred, according to the report from the developer of CYPlebrity. The webserver claims a sensitivity of 0.75 and a specificity of 0.89.
CypReact
CypReact is a software tool to determine whether an input arbitrary compound can interact with nine CYP isoforms, including CYP1A2, 2A6, 2B6, 2C8, 2C9, 2C19, 2D6, 2E1, and 3A4. In total, 1632 compounds with known metabolism information and 1053 nonreactants were used for model training.47 In addition, 36 physicochemical properties and over 3000 structure-based features were utilized as descriptors, including MACCS, PubChem, and ClassyFire fingerprints. Base learners were combined with a cost matrix for model training to decrease the bias from unbalanced training data between reactants and nonreactants. Fivefold cross-validation was conducted for model generation. The report of the developer claims that this tool performs better compared with ADMET Predictor (see below) and SMARTCyp (see above) based on comparing their area under the receiver operating characteristic curves (AUROCs). CypReact is also embedded in another web tool for metabolism prediction, BioTransformer, which provides a platform for input drugs to generate prediction results from multiple metabolism aspects.48
ADMET Predictor
ADMET Predictor is a software tool from SimulationPlus that can predict drug properties from multiple perspectives, including metabolism, and is constructed based on machine learning tools.49 The metabolism prediction includes identifying the possibility of a drug serving as a substrate and the SOM for CYP1A2, 2A6, 2B6, 2C8, 2C9, 2C19, 2D6, 2E1, and 3A4. This platform can also make predictions for metabolism kinetics constants for CYP1A2, 2C9, 2C19, 2D6, and 3A4 and predict whether a small molecule can inhibit the activity of these five enzymes. In total, 403 features belonging to 11 different categories were utilized for model training.
The above-mentioned tools are summarized in Table 1.
Table 1.
Summary and comparison of drug interaction prediction tools
| Tool | Prediction method | Prediction type | Prediction subtype Availability | Year published | Database used | ||
|---|---|---|---|---|---|---|---|
| Structure-based prediction tools | |||||||
| SMARTCyp | Accessibility and reactivity assessment | SOM | 2D6, 2C9, 3A4 | Non-commercial webserver | 2019 | Unspecified | |
| PreMetabo | Activation energy based on EaMEAD model and molecular docking | SOM | 1A2, 2C9, 2D6, 3A4 | Not available | 2020 | Fujitsu ADME database | |
| Inhibitor | 2C9, 2C19, 2D6, 3A4 | ||||||
| Substrate | 2D6, 3A4 | ||||||
|
| |||||||
| Machine learning-based prediction tools | |||||||
|
| |||||||
| Tool | Prediction algorithm | Descriptor | Prediction type | Prediction subtype Availability | Year published | Database used | |
| RS-predictor | MIRank (SVM-like algorithm) | 148 topological descriptors; 392 quantum chemical descriptors; SMARTCyp reactivity descriptors | SOM | 1A2, 2A6, 2B6, 2C8, 2C9, 2C19, 2D6, 2E1, 3A4 | Non-commercial webserver | 2013 | Merck data set; Molecular Design limited (MDL) database; human drug-metabolizing enzyme database from Fujitsu database |
| SOMP | PASS (Bayesian-like algorithm) | LMNA descriptors | SOM | 1A2, 2C9, 2C19, 2D6, 3A4 | Non-commercial webserver | 2015 | Biovia (Accelrys) Metabolite database |
| Xenosite | Standard neural network | Topological and quantum chemical descriptors; SMARTCyp reactivity descriptors; fingerprint similarity descriptors | SOM | CYP1A2, 2A6, 2B6, 2C8, 2C9, 2C19, 2D6, 2E1, 3A4 | Non commercially available license | 2014 | The same with RS-predictor involved database (same first author) |
| SOME | SVM | Quantum chemical descriptors | SOM | Six biotransformations | Non-commercial Webserver | 2009 | MDL Metabolite |
| ADMETlab | RF; SVM; recursive partitioning regression; partial least squares; naive Bayes; decision tree | 11 types of descriptor containing 403 descriptors, including constitution, topology, connectivity, Estate, Kappa, basak, burden, autocorrelation, charge, property, MOE-type descriptors (regression model); fingerprint descriptors (classification model) | Substrate | 1A2, 2C9, 2C19, 2D6, 3A4 | Non-commercial Webserver | 2018 | Unspecified |
| Inhibitor | 1A2, 2C9, 2C19, 2D6, 3A4 | ||||||
| SuperCYPsPred | RF | RDKit descriptors | Inhibitor | 1A2, 2C9, 2C19, 2D6, 3A4 | Non-commercial Webserver | 2020 | PubChem Bioassay |
| CYPlebrity | RF | RDKit descriptors | Inhibitor | 1A2, 2C9, 2C19, 2D6, 3A4 | Non-commercial Webserver | 2021 | PubChem; ChEMBL; FujitSu ADME |
| CypReact | Learning-based model | 36 physicochemical properties and >3000 structure-based descriptors | Substrate | 1A2, 2A6, 2B6, 2C8, 2C9, 2C19, 2D6, 2E1, 3A4 | Non-commercial java package | 2019 | DrugBank; PharmGKB); XMetDB; SuperCYP |
| ADMET Predictor | Machine learning | N/A | SOM | 1A2, 2A6, 2B6, 2C8, 2C9, 2C19, 2D6, 2E1, 3A4 | Commercially available | 2000 | Not specified |
| Substrate | 1A2, 2A6, 2B6, 2C8, 2C9, 2C19, 2D6, 2E1, 3A4 | ||||||
| Inhibitor | 1A2, 2C9, 2C19, 2D6, 3A4 | ||||||
Comparison of metabolism prediction tools and platforms
Information collected for prediction comparison of different tools
Here, we compare four prediction tools: SuperCYPsPred, CYPlebrity, ADMETlab, and ADMET Predictor. ADMET Predictor is a commercially available tool, whereas the other three can be freely accessed online. The prediction performance of identifying inhibitors for five main CYP450 subtypes (1A2, 2C9, 2C19, 2D6, and 3A4) was investigated. Other platforms were not included because they lack the ability to identify enzyme inhibitors. The input drugs for testing the prediction performance were collected from the top 200 prescribed drugs in 2019 (https://clincalc.com/DrugStats/Top200Drugs.aspx) and we took the top 50 prescription drugs for testing. Some of the prescriptions contain two drugs and we predicted each drug applying different prediction tools separately. In total, 52 drug compounds were collected from the top 50 prescriptions. Whether each drug serves as an inhibitor of the five enzymes was summarized from literature and is detailed in Table A1 in the supplemental information online.
Ability of CYPlebrity to identify CYP inhibitors, and user comments
The possibility of a given compound/drug (input structure) serving as an inhibitor of different CYP enzymes can be provided by the web server. We defined a possibility ≥0.5 as a positive prediction, indicating that the compound was identified as an inhibitor. The prediction results are summarized in Figure 2. The prediction performance is analyzed by different color markers in the table, with comparing to literature references (Table A1 in the supplemental information online). The true positive, true negative, false positive and false negative predictions were calculated in Figure 2.
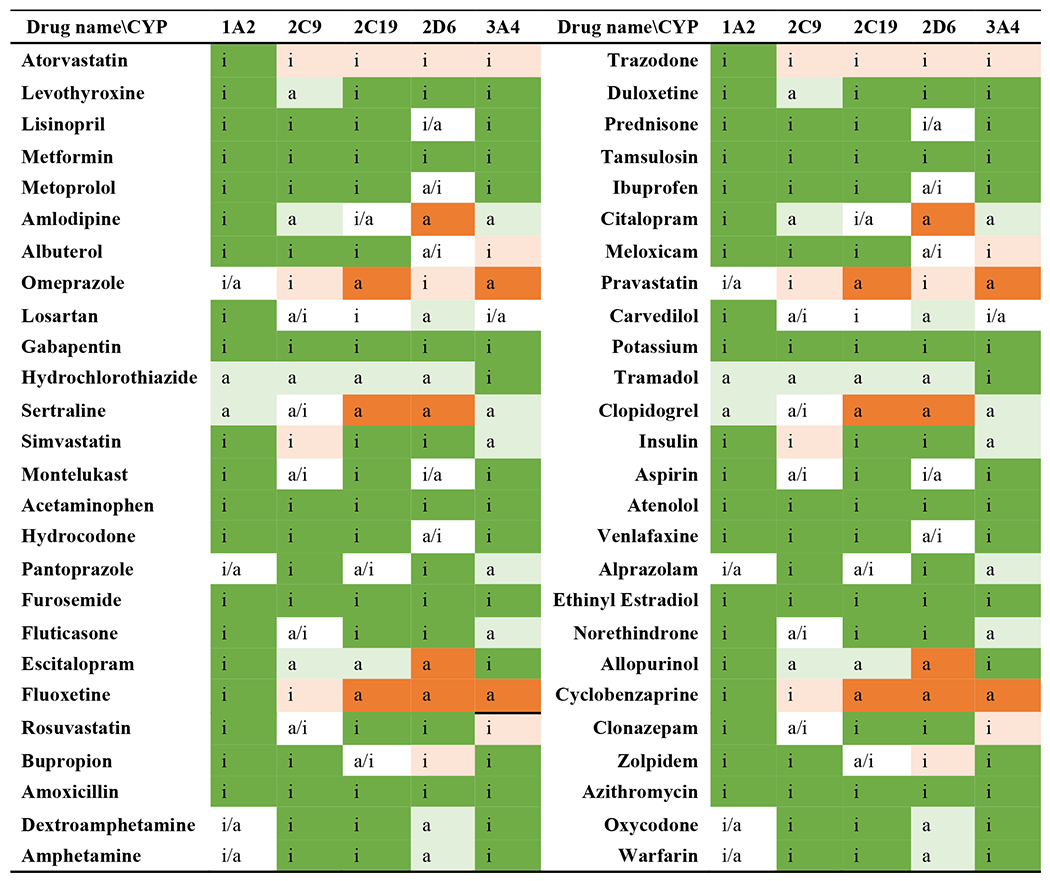
Figure 2.

Prediction possibilities of CYPlebrity for 52 compounds serving as inhibitors of CYP1A2, 2C9, 2C19, 2D6, and 3A4. The number represents the predicted possibility of a compound serving as an inhibitor of CYP enzymes. Dark orange, true positive; light orange, false negative; dark green, true negative; light green, false positive.
Out of 36 inhibitors, 23 were successfully identified by CYPlebrity, which is slightly less than two-thirds (Table 2). By contrast, 171 out of 214 non-inhibitors had true predictions, exhibiting a specificity of 0.8 (Table 2). The total prediction accuracy was 0.78.
Table 2.
Comparison of performance measurements between different subenzymes and toolsa
| Performance measurement | Subenzyme |
All | ||||
|---|---|---|---|---|---|---|
| CYP1A2 | CYP2C9 | CYP2C19 | CYP2D6 | CYP3A4 | ||
| CYPlebrity | ||||||
|
| ||||||
| TP | 2 | 3 | 6 | 6 | 5 | 22 |
| TN | 37 | 35 | 32 | 32 | 35 | 171 |
| FN | 0 | 4 | 4 | 4 | 2 | 14 |
| FP | 11 | 8 | 8 | 8 | 8 | 43 |
| Sum | 50 | 50 | 50 | 50 | 50 | 250 |
| SEN | 1.00 | 0.43 | 0.60 | 0.60 | 0.71 | 0.61 |
| SPE | 0.77 | 0.81 | 0.80 | 0.80 | 0.81 | 0.80 |
| ACCU | 0.78 | 0.76 | 0.76 | 0.76 | 0.80 | 0.77 |
|
| ||||||
| SuperCYPsPred: MACCS fingerprint | ||||||
|
| ||||||
| TP | 1 | 3 | 5 | 7 | 2 | 18 |
| TN | 45 | 29 | 35 | 26 | 36 | 171 |
| FN | 1 | 4 | 5 | 3 | 5 | 18 |
| FP | 3 | 14 | 5 | 14 | 7 | 43 |
| Sum | 50 | 50 | 50 | 50 | 50 | 250 |
| SEN | 0.50 | 0.43 | 0.50 | 0.70 | 0.29 | 0.50 |
| SPE | 0.94 | 0.67 | 0.88 | 0.65 | 0.84 | 0.80 |
| ACCU | 0.92 | 0.64 | 0.80 | 0.66 | 0.76 | 0.76 |
|
| ||||||
| SuperCYPsPred: Morgan fingerprint | ||||||
|
| ||||||
| TP | 1 | 0 | 4 | 7 | 2 | 14 |
| TN | 39 | 37 | 36 | 24 | 35 | 171 |
| FN | 1 | 7 | 6 | 3 | 5 | 22 |
| FP | 9 | 6 | 4 | 16 | 8 | 43 |
| Sum | 50 | 50 | 50 | 50 | 50 | 250 |
| SEN | 0.50 | 0.00 | 0.40 | 0.70 | 0.29 | 0.39 |
| SPE | 0.81 | 0.86 | 0.90 | 0.60 | 0.81 | 0.80 |
| ACCU | 0.80 | 0.74 | 0.80 | 0.62 | 0.74 | 0.74 |
|
| ||||||
| SuperCYPsPred: consistent results only | ||||||
|
| ||||||
| TP | 1 | 0 | 4 | 7 | 2 | 14 |
| TN | 39 | 29 | 34 | 20 | 35 | 157 |
| FN | 1 | 4 | 5 | 3 | 5 | 18 |
| FP | 3 | 6 | 3 | 10 | 7 | 29 |
| Sum | 44 | 39 | 46 | 40 | 49 | 218 |
| SEN | 0.50 | 0.00 | 0.44 | 0.70 | 0.29 | 0.44 |
| SPE | 0.93 | 0.83 | 0.92 | 0.67 | 0.83 | 0.84 |
| ACCU | 0.91 | 0.74 | 0.83 | 0.68 | 0.76 | 0.78 |
|
| ||||||
| SuperCYPsPred: higher confidence | ||||||
|
| ||||||
| TP | 1 | 1 | 4 | 7 | 2 | 15 |
| TN | 43 | 35 | 36 | 27 | 36 | 177 |
| FN | 2 | 6 | 6 | 3 | 5 | 22 |
| FP | 4 | 8 | 4 | 13 | 7 | 36 |
| Sum | 50 | 50 | 50 | 50 | 50 | 250 |
| SEN | 0.33 | 0.14 | 0.40 | 0.70 | 0.29 | 0.41 |
| SPE | 0.91 | 0.81 | 0.90 | 0.68 | 0.84 | 0.83 |
| ACCU | 0.88 | 0.72 | 0.80 | 0.68 | 0.76 | 0.77 |
|
| ||||||
| ADMET Predictor | ||||||
|
| ||||||
| TP | 1 | 6 | 6 | 10 | 6 | 29 |
| TN | 38 | 28 | 30 | 28 | 28 | 152 |
| FN | 1 | 1 | 4 | 0 | 1 | 7 |
| FP | 10 | 15 | 10 | 12 | 15 | 62 |
| Sum | 50 | 50 | 50 | 50 | 50 | 250 |
| SEN | 0.50 | 0.86 | 0.60 | 1.00 | 0.86 | 0.81 |
| SPE | 0.79 | 0.65 | 0.75 | 0.70 | 0.65 | 0.71 |
| ACCU | 0.78 | 0.68 | 0.72 | 0.76 | 0.68 | 0.72 |
|
| ||||||
| ADMET Lab | ||||||
| TP | 2 | 2 | 8 | 7 | 3 | 22 |
| TN | 34 | 37 | 33 | 29 | 29 | 162 |
| FN | 0 | 5 | 2 | 3 | 4 | 14 |
| FP | 14 | 6 | 7 | 11 | 14 | 52 |
| Sum | 50 | 50 | 50 | 50 | 50 | 250 |
| SEN | 1.00 | 0.29 | 0.80 | 0.70 | 0.43 | 0.61 |
| SPE | 0.71 | 0.86 | 0.83 | 0.73 | 0.67 | 0.76 |
| ACCU | 0.72 | 0.78 | 0.82 | 0.72 | 0.64 | 0.73 |
Abbreviations: ACCU, accuracy; FN, false negative; FP, false positive; SEN, sensitivity; SPE, specificity; Sum, sum of all engaged individual predictions; TN, true negative; TP, true positive.
A drug or a compound can be input as SMILE strings or an SDF structure. Multiple inputs are allowed through a file with a list of SMILE strings. Drawing a molecule on the website interface directly is also applicable with the embedded JavaScript Molecular Editor (JSME) tool. When one or more molecules are input for prediction, the result is reported simultaneously on the webpage. The 2D structures are exhibited according to the input SMILE strings, with the prediction of inhibition possibilities against different CYP enzymes. The prediction results can be saved as one table file in .csv for one or multiple inputs. The prediction outcomes for potassium and insulin are ‘null’ under separate input of SMILE strings directly in the interface. When they are input from a file containing multiple SMILE strings, these molecules are not shown in the downloaded output file. Figure A1 in the supplemental information online shows the interface after the prediction of the sample molecule provided by the web server. In the downloaded file of the prediction results, the compound name is shown as numbers (Figure A2 in the supplemental information online), although the input file contains the name of each molecule. Nevertheless, the order of the molecules in the output file is the same as that in the input file. In addition, each enzyme is not represented by their name in the exported file (e.g., CYP1A2, CYP2C9) but shown as ‘Prediction Model 1’, ‘Prediction Model 2’, and so on, which then needs to be manually matched with the enzyme name (Figure A3 in the supplemental information online). The prediction results from this server are outputted in numerical format that indicates with a certain probability whether the input structures serve as inhibitors for each CYP enzyme subtype. Thus, users can flexibly define the threshold to discriminate inhibitors according to their specific needs.
Ability of SuperCYPsPred to identify CYP inhibitors, and user comments
The prediction results, which show whether an input drug/compound is an activate CYP subtype inhibitor, are also reported with prediction confidence but are different from the type of report from CYPlebrity. CYPlebrity reports the possibility of an input structure serving as an inhibitor, with a user-defined cutoff to distinguish inhibitors from non-inhibitors. By contrast, SuperCYPsPred first identifies whether an input could be an inhibitor, and then provides a measure of that possibility (Figure A4 in the supplemental information online). The prediction results of all 52 compounds collected here are summarized in Figure 3. Given that the prediction results can differ between the two prediction methods (through MACCS fingerprint and Morgan fingerprint), such results are not marked in color in Figure 3. Separate colored markers for both prediction methods can be found in Tables A2 and A3 in the supplemental information online. The prediction measurement information from the different prediction methods is summarized in Table 2.
Figure 3.
Prediction possibilities of SuperCYPsPred for 52 compounds serving as inhibitors of CYP1A2, 2C9, 2C19, 2D6, and 3A4. Inactive, predicted as an inactive inhibitor from both MACCS and Morgan fingerprints; active, predicted as an active inhibitor from both MACCS and Morgan fingerprints; i/a, predicted as an inactive inhibitor through MACCS fingerprint method but an active inhibitor through Morgan fingerprint method; a/I, predicted as an active inhibitor through MACCS fingerprint method but an inactive inhibitor through Morgan fingerprint method. Dark orange, true positive; light orange, false negative; dark green, true negative; light green, false positive.
According to Table 2, 32 out of 255 predictions have contradictory results from the MACCS and Morgan methods. Thus, we not only analyzed the prediction performance of both methods separately, but also summarized the prediction performance by taking the result with higher confidence for those instances where the two methods differ. Predictions with consistent results from both methods were also separately analyzed.
The MACCS method showed the highest sensitivity (0.50) in terms of identifying CYP inhibitors, but combining prediction results and taking the prediction with higher confidence contributed to better specificity (0.83) and accuracy (0.77) to decrease false negative prediction. Those prediction results with an agreement between both prediction methods had the higher prediction accuracy (0.79), with a sensitivity (0.44) slightly lower than that of the MACCS method (0.50) and the best specificity performance (0.85) (Table 2). To summarize, the prediction was most reliable when the results were consistent from both methods. If two methods differed, taking the results from the one with higher prediction confidence led to better overall accuracy, with decreased sensitivity as compensation. The final prediction sensitivity, specificity, and accuracy were comparable with the performance measurement summarized from results when the prediction results were consistent from both methods.
SuperCYPsPred can accept only single inputs. The input molecules can be a PubChem drug name, SMILE string, or information from the website interface through ChemDoodle toolkit. The CYP subenzyme to be predicted can be manually selected on the website interface. The two prediction patterns, MACCS and Morgan fingerprint, can be selected either separately or together. The input of potassium was reported as an invalid input structure by the website, whereas prediction of the macromolecule, insulin, was successfully generated. The interface of prediction results to identify a CYP inhibitor with prediction confidence is shown in Figure A4 in the supplemental information online. Some simple structural information is also analyzed according to the input information, including molecular weight, number of hydrogen bond acceptors/donors, number of rotatable bonds, total charge, and molecular polar surface area.
SuperCYPsPred also has a DDI index function (Figure A5 in the supplemental information online). Users can input multiple drug names to search for the interaction information between target drugs through specific CYP pathways, and alternative drugs are also provided. The output includes referable knowledge by directly clicking on results in the cells with relevant links, and the predicted results from the Webserver. More detailed information can be found elsewhere.31
Ability of ADMET Predictor to identify CYP inhibitors, and user comments
The prediction results of the 52 drugs with inhibition potentiality for the five CYP enzymes are summarized in Figure 4. Prediction confidence values of cells are also listed with the prediction result in Figure 4, which is similar to the prediction possibility from SuperCYPsPred. The total sensitivity, specificity, and accuracy of ADMET Predictor were 0.81, 0.71, and 0.72, respectively.
Figure 4.

Prediction possibilities of ADMET Predictor for 52 compounds serving as inhibitors of CYP1A2, 2C9, 2C19, 2D6, and 3A4. No, predicted as an inactive inhibitor. Yes, predicted as an active inhibitor. The percentage in each cell is the prediction confidence of the prediction. Dark orange, true positive; light orange, false negative; dark green, true negative; light green, false positive.
The input file can be prepared in a variety of formats, including smile strings, SDF files, and mol files, and multiple structures are allowed in one input file. The user can select part of or all the compounds to export the predicted properties (also partially or all selections) in a single file through .xlsx files, .sdf files, and other file types. Potassium came out with prediction results but lacked prediction confidence. The inhibitor prediction by ADMET Predictor is a yes/no judgement with prediction confidences, indicating that the threshold is not adjustable. Insulin was not reported with prediction results. Furthermore, the prediction of input drugs/structures is not limited to the inhibition of enzyme subtypes. For metabolism-related prediction, other properties can also be generated, including whether the input structure is a potential substrate of different CYP enzymes, the site of metabolism, and possible structures of metabolites. Physicochemical properties, absorption, distribution, and transporter parameters can also be calculated from input structures.
Ability of ADMETlab to identify CYP inhibitors, and user comments
As summarized in Figure 5 and Table 2 for 52 drugs, the ADMETlab web tool can also generate prediction results for whether the input compound can serve as an inhibitor of the five CYP enzymes. The prediction probabilities are also provided, divided into six groups: 0–0.1, 0.1–0.3, 0.3–0.5, 0.5–0.7, 0.7–0.9, and 0.9–1.0. Here, we define compounds with a probability <0.5 as non-inhibitors, and those with a probability ≥0.05 as inhibitors. The total sensitivity, specificity, and accuracy of ADMETlab were 0.61, 0.76, and 0.74, respectively.
Figure 5.

Prediction results from ADMETlab webtool for 52 compounds serving as inhibitors of CYP1A2, 2C9, 2C19, 2D6, and 3A4. Inactive, predicted as a non-inhibitor. Active, predicted as an inhibitor. Dark orange: true positive; light orange, false negative; dark green, true negative; light green, false positive.
The application and evaluation of ADMETlab were conducted using an upgraded version of the original web tool, ADMETlab 2.0 (https://admetmesh.scbdd.com). Users are recommended to input a single compound structure with no more than 128 atoms for more reliable prediction results. Either SMILE strings or drawing a compound structure on the embedded JSME editing tool on the webpage is used for input formats, with only one input allowed for each submission. Whether an input structure can be identified as a substrate for each CYP enzyme is also reported with a similar pattern as inhibitor prediction (Figure A6 in the supplemental information online). The prediction results are presented as probabilities, indicating the likelihood of a compound serving as a substrate or an inhibitor. This also allows users to adjust the discrimination threshold according to their preferences, similar to the functionality offered by CYPlebrity. Other ADMET properties can also be predicted for input compounds. In particular, the prediction as reported as an ‘error’ for potassium and that for insulin was unable to generate metabolism-related information. The prediction result of an entry structure can be saved as .csv file or .pdf format, including all predicted properties of the compound, rather than being limited to metabolism prediction.
Comparison of prediction performance for CYP subtypes among different tools
For a fair comparison between different prediction tools, the prediction results of potassium and insulin were not considered. The prediction results for the 50 drugs are analyzed below (Table 2).
In terms of the overall prediction performance to identify CYP inhibitors, ADMET Predictor had the highest sensitivity (0.81), followed by CYPlebrity and ADMETlab (SPE = 0.61). This means that ADMET Predictor was the most successful tool for identifying true inhibitors for the five CYP enzyme subtypes. Comparing the overall specificity, consistent prediction results from the SuperCYPsPred web tool showed the highest performance (0.84), followed by prediction results if the user always uses the results with higher confidence when the two prediction methods contradict each other (SPE = 0.83). The specificity of individual MACCS/Morgan models is also equal to or better than that of other tools (0.80). This indicates that the SuperCYPsPred web server should have the optimal specificity. Thus, it is not surprising that ADMET Predictor has the poorest performance in specificity and SuperCYPsPred has the poorest performance in sensitivity prediction.
In terms of prediction accuracy, SuperCYPsPred had the highest performance quality (ACCU = 0.78) when the prediction results were consistent from both models. When the model results differed, if the user always used the result from the prediction with the higher confidence, the overall accuracy of SuperCYPsPred was 0.77, as was that of CYPlebrity, ranking these as the top2 prediction tools.
For identifying inhibitors of CYP1A2, both CYPlebrity and ADMETlab had the highest sensitivity (1.00). For recognizing CYP2C9 and CYP2D6 inhibitors, ADMET Predictor had the highest sensitivity (CYP2C9: 0.86; CYP2D6: 1.00), whereas, for CYP2C19, ADMETlab had the highest sensitivity (0.8), with CYPlebrity and ADMET Predictor being second with a sensitivity of 0.6. For CYP3A4 inhibitor identification, ADMET Predictor had the top-ranking sensitivity among the four tools (0.86). Interestingly, for identifying CYP2C9 inhibitors, ADMET Predictor showed an outstanding performance (SEN = 0.86), whereas other tools all had poor results, with reported sensitivity <0.5. For CYP2D6, all prediction methods had sensitivity values >0.5.
Given the limited size of our molecular set for objectively evaluating the metabolism prediction tools, we incorporated Cohen’s κ coefficient and Matthew’s correlation coefficient (MCC) as additional measures, because these metrics take the sample size into account in model performance evaluation, whereas most other performance metrics rely solely on the direct calculations of accuracy, sensitivity, and specificity.
Table 3 summarizes the overall prediction performance and individual CYP subtype prediction performance of the models. These coefficients ranged from –1 to 1, with higher values indicating better prediction performance. It is encouraging that the assessment with the two additional metrics, Cohen’s κ coefficient and MCC, demonstrated a significant alignment with the assessment using the traditional performance metrics. Based on both coefficients, CYPlebrity and ADMET Predictor emerge as the most accurate tools for identifying CYP inhibitors across different subtypes. When considering individual subtype predictions, the two assessment coefficients also align well with previous findings. ADMETlab for CYP2C19, ADMET Predictor for CYP2D6, and CYPlebrity for CYP3A4 are still recognized as the top prediction tools for those enzymes. Interestingly, using the MACCS fingerprint prediction model and the two aforementioned performance metrics, the preferred tools for CYP1A2 and CYP2C9 prediction were SuperCYPsPred and CYPlebrity, respectively. This differs from the assessment using traditional performance metrics.
Table 3.
Comparison of adjusted performance measurement between subenzymes and tools
| Performance measurement | Subenzym | |||||
|---|---|---|---|---|---|---|
| CYP1A2 | CYP2C9 | CYP2C19 | CYP2D6 | CYP3A4 | All | |
| CYPlebrity | ||||||
| Cohen’s κ | 0.21 | 0.20 | 0.35 | 0.35 | 0.39 | 0.31 |
| MCC | 0.34 | 0.20 | 0.36 | 0.36 | 0.42 | 0.33 |
| SuperCYPsPred: MACCS fingerprint | ||||||
| Cohen’s κ | 0.30 | 0.06 | 0.38 | 0.25 | 0.11 | 0.23 |
| MCC | 0.32 | 0.08 | 0.38 | 0.28 | 0.11 | 0.24 |
| SuperCYPsPred: Morgan fingerprint | ||||||
| Cohen’s κ | 0.11 | −0.15 | 0.32 | 0.20 | 0.08 | 0.15 |
| MCC | 0.15 | −0.15 | 0.33 | 0.24 | 0.09 | 0.16 |
| SuperCYPsPred: consistent result only | ||||||
| Cohen’s κ | 0.29 | −0.14 | 0.40 | 0.30 | 0.11 | 0.25 |
| MCC | 0.31 | −0.14 | 0.40 | 0.32 | 0.11 | 0.25 |
| SuperCYPsPred: higher confidence | ||||||
| Cohen’s κ | 0.19 | −0.04 | 0.32 | 0.27 | 0.11 | 0.20 |
| MCC | 0.20 | −0.04 | 0.33 | 0.31 | 0.11 | 0.21 |
| ADMET Predictor | ||||||
| Cohen’s κ | 0.09 | 0.28 | 0.29 | 0.48 | 0.28 | 0.32 |
| MCC | 0.14 | 0.36 | 0.30 | 0.56 | 0.36 | 0.38 |
| ADMET lab | ||||||
| Cohen’s κ | 0.16 | 0.14 | 0.53 | 0.33 | 0.06 | 0.26 |
| MCC | 0.30 | 0.14 | 0.55 | 0.35 | 0.08 | 0.28 |
Discussion
Significance
The continual development of computational tools is mirrored by that of servers and platforms, the quality of which varies widely. Among those most-recognized tools, their prediction function have different advantages and disadvantages. Commonly, the prediction focus differs among tools. A tool that is able to identify more true positive items will tend toward a higher false positive rate. Such tools have better sensitivity but poor specificity, and are preferred by researchers who need to screen out as many true inhibitors as possible to decrease omission. By contrast, those tools with higher reliability against recognized inhibitors tend to omit more likely inhibitors. These tools are represented by better specificity, but with more frequent false negative reports. The current study provides a selection of references for researchers to choose among the webservers and tools with different prediction performances. We not only compared the prediction quality between different platforms, but also reveal the prediction tendency of each tool to facilitate user selection.
Bias of tool performance evaluation
Although this study used the most prescribed drugs for testing the prediction performance of several tools or platforms, some bias remained. Given that all the evaluated prediction tools have implemented machine learning methods for prediction model training, the compounds used for testing their performance should not contain the drugs from all the training libraries of these tools. However, the training sets of these tools are not available. Thus, the compounds used in this study for evaluating the tool prediction performance might also be in one or more of the original training sets. This inevitably introduces bias for performance evaluation, which might account for the discrepancy between our conclusion and the original report from the developers. To make ‘fair’ comparisons, we used the most frequently prescribed drugs during clinical practice, which belong to various drug categories and have diverse molecular structures and indications. This strategy enabled us to evaluate the performance of each tool more objectively. The performance of an individual tool might differ from the reported one because the test set molecules might differ structurally from those used in model training.
In addition, the structural diversity of the drugs used to evaluate the prediction performance of different tools can impact the fairness of comparison. This study evaluated the performance of three tools with a testing library mainly comprising small molecules. Only one macromolecule (insulin) and an ion (potassium) were included. In addition, to enable a fair comparison, the prediction results of these two drugs were not considered during the performance assessment. CYPlebrity and ADMETlab cannot predict either potassium or insulin, whereas SuperCYPsPred can only make a prediction for insulin. ADMET Predictor can only provide prediction results for potassium without providing prediction confidence. Thus, if researchers need the prediction performance for macromolecules and ions, more detailed research aiming at these two types of compounds is required.
Assessment of single CYP enzymes
This investigation used 50 drugs for comparison of different tools, but this might not enough for evaluating the prediction comparison for single CYP subenzymes. Thus, the summarized sensitivity and specificity for separate enzymes in each tool require more testing with a larger sample size for a more accurate assessment. We introduced Cohen’s κ coefficient and MCC as additional indicators to reflect the performance from another perspective. However, our conclusion that identification of CYP2C9 inhibitors is the most challenging, whereas that of CYP2D6 inhibitors is the most successful, was not changed even after using these additional metrics.
User flexibility in defining identification thresholds in different web servers
CYPlebrity and ADMETlab directly provide the possibility of an input as the inhibitor of each CYP enzyme. This research uniformly set 0.5 as the threshold to separate inhibitors from non-inhibitors. However, users can freely define different thresholds for identifying inhibitors according to their research needs for higher sensitivity or specificity. By contrast, SuperCYPsPred and ADMET Predictor report the classification results of inhibitors and non-inhibitors with prediction confidence, which provides less user flexibility.
Summary of databases used in this study
The following databases provided data sources for the development of the prediction tools:
Publically accessible databases: PubChem,59 ChEMBL,60 DrugBank.61
Commercially available databases: Fujitsu,62 MDL,63,64 Biovia.65
Additionally, the developers of SuperCYPsPred incorporated an index tool into their Webserver, allowing users to search for information on DDIs and drug–CYP interactions.
Some tools involved in this study were developed using existing data sets, including Merck,66 PharmGKB,67 XMetDB,68 and SuperCYP.69
Future perspectives in drug CYP prediction
Current predictions regarding drug CYP potentiality mainly focus on the identification of SOM and inhibitors/substates. More sophisticated predictions, including the calculation of enzyme kinetic constants/metabolism rate, are only available from ADMET Predictor software among the tools/software we evaluated; thus, more development is required in this direction. Both the machine learning method and the fragment-based calculation method for drug CYP property prediction require input knowledge for data training or calculation rules set-up. However, the preparation of a database is one of the most difficult parts in this research field because of scarcity of metabolism data. Researchers have been trying to overcome this obstacle for years, with one recently published study regarding deep-learning algorithm development reporting some insights when only small data sets are used for model generation.70 With the enlargement of the data library and the improvement of the prediction method, the prediction of drug CYP properties will become increasingly more reliable.
Concluding remarks
This research summarizes nine of the most recent and most popular platform tools in terms of their CYP subenzyme prediction functions. Both fragment-based prediction tools and machine learning tools are included, with their respective prediction methods and accuracy reports compared. We also assessed the prediction performance of CYPlebrity, SuperCYPsPred, ADMET Predictor, and ADMETlab in terms of the identification of inhibitors for CYP1A2, 2C9, 2C19, 2D6, and 3A4, revealing the advantages and disadvantages of these tools. Overall, ADMET Predictor, a commercially available software platform, had the highest sensitivity (0.81) for identifying inhibitors, although the poorest specificity (0.71). For remaining four free webservers, CYPlebrity had the highest sensitivity (0.64), with a specificity of 0.80. The highest specificity (0.83) was achieved with SuperCYPsPred, by combining MACCS and Morgan fingerprint prediction methods and using the prediction result with the higher prediction confidence when the prediction results from the two methods were inconsistent. CYPlebrity also had the highest prediction accuracy, based on this research. Researchers can make appropriate choices more easily among these tools based on this report.
Supplementary Material
Figure 1.

Schematic of drug disposition and in silico prediction of drug metabolism.
Highlights.
Discussed the significance of in silico CYP450 prediction in drug discovery
Introduced the major functions and usages of mainstream in silico CYP450 prediction online tools and software packages
Summarized inhibitor, inducer and substrate information for 52 most frequently prescribed drugs for their interactions with CYP1A2, CYP2C9, CYP2C19, CYP2D6, and CYP3A4 sub-enzymes
Assessed and compared the performance of four online tools and software package in inhibitor prediction for CYP1A2, CYP2C9, CYP2C19, CYP2D6, and CYP3A4 subenzymes
Provided guidance on selecting suitable in silico tools to predict whether a compound is an inhibitor of a specific CYP450 sub-enzyme
Acknowledgments
The authors gratefully acknowledge the funding support from the National Institutes of Health (NIH) R01GM147673, R01GM149705 and K25AG070277, the National Science Foundation (NSF) 1955260.
Biographies
Author biographies
Jingchen Zhai
Jingchen Zhai is a PhD student from University of Pittsburgh, School of Pharmacy. Her research filed includes drug PBPK modeling and population PKPD modeling. Her long-term research goal is contributing to drug CYP-mediated metabolism prediction using a series of in silico tools.

Junmei Wang
Junmei Wang is an associate professor at University of Pittsburgh, School of Pharmacy. His broad research interests include PK/PD modeling and simulation, in silico ADME tool development, molecular mechanics force field and protein-ligand scoring function development, as well as molecular mechanisms studies of biological processes (such as amyloid peptide oligomerization and allostery) using large-scale molecular dynamics simulations.

Footnotes
Publisher's Disclaimer: This is a PDF file of an unedited manuscript that has been accepted for publication. As a service to our customers we are providing this early version of the manuscript. The manuscript will undergo copyediting, typesetting, and review of the resulting proof before it is published in its final form. Please note that during the production process errors may be discovered which could affect the content, and all legal disclaimers that apply to the journal pertain.
COI: All authors declared no competing interests as described in the ETHICS_COI02 document (http://www.elsevier.com/conflictsofinterest) for this work.
References
- 1.Fact Sheet: FDA at a Glance. www.fda.gov/about-fda/fda-basics/fact-sheet-fda-glance. [Accessed July 12, 2023].
- 2.Gibson GG, Skett P. Introduction to Drug Metabolism. Berlin; Springer; 2013. [Google Scholar]
- 3.Guengerich FP. Common and uncommon cytochrome P450 reactions related to metabolism and chemical toxicity. Chem Re Toxicol. 2001; 14: 611–650. [DOI] [PubMed] [Google Scholar]
- 4.Meyer UA. Overview of enzymes of drug metabolism. J Pharmacokinet Biopharm. 1996; 24: 449–459. [DOI] [PubMed] [Google Scholar]
- 5.Eddershaw P, Dickins M. Phase I metabolism. In: Evans G, ed. A Handbook of Bioanalysis and Drug Metabolism. Boca Raton. CRC Press; 2021: 208–221. [Google Scholar]
- 6.Guengerich FP. Cytochrome P450 and chemical toxicology. Chem. Res. Toxicol 2008; 21: 70–83. [DOI] [PubMed] [Google Scholar]
- 7.Crettol S, Petrovic N, Murray M. Pharmacogenetics of phase I and phase II drug metabolism. Chem. Res. Toxicol 2010; 16: 204–219. [DOI] [PubMed] [Google Scholar]
- 8.Liston HL, Markowitz JS, DeVane CL. Drug glucuronidation in clinical psychopharmacology. J Clin Psychopharmacol. 2001; 21: 500–515. [DOI] [PubMed] [Google Scholar]
- 9.Kirchheiner J, Roots I, Goldammer M, Rosenkranz B, Brockmöller J. Effect of genetic polymorphisms in cytochrome P450 (CYP) 2C9 and CYP2C8 on the pharmacokinetics of oral antidiabetic drugs. Clin Pharmacokinet 2005; 44: 1209–1225. [DOI] [PubMed] [Google Scholar]
- 10.Flanagan D. Understanding the grapefruit-drug interaction. Gen Dent. 2005; 53: 282–285; quiz 286. [PubMed] [Google Scholar]
- 11.Kantola T, Kivistö KT, Neuvonen PJ. Grapefruit juice greatly increases serum concentrations of lovastatin and lovastatin acid. Clin Pharmacol Ther. 1998; 63: 397–402. [DOI] [PubMed] [Google Scholar]
- 12.Frye RF, Zgheib NK, Matzke GR, Chaves-Gnecco D, Rabinovitz M, Shaikh OS, et al. Liver disease selectively modulates cytochrome P450-mediated metabolism. Clin. Pharmacol. Ther 2006; 80: 235–245. [DOI] [PubMed] [Google Scholar]
- 13.Morcos PN, Moreira SA, Brennan BJ, Blotner S, Shulman NS, Smith PF. Influence of chronic hepatitis C infection on cytochrome P450 3a4 activity using midazolam as an in vivo probe substrate. Eur. J. Clin. Pharmacol 2013; 69: 1777–1784. [DOI] [PubMed] [Google Scholar]
- 14.Parkinson A, Mudra DR, Johnson C, Dwyer A, Carroll KM. The effects of gender, age, ethnicity, and liver cirrhosis on cytochrome P450 enzyme activity in human liver microsomes and inducibility in cultured human hepatocytes. Toxicol. Appl. Pharmacol 2004; 199: 193–209. [DOI] [PubMed] [Google Scholar]
- 15.Dahan A, Altman H. Food–drug interaction: grapefruit juice augments drug bioavailability—mechanism, extent and relevance. Eur. J. Clin. Nutr 2004; 58: 1–9. [DOI] [PubMed] [Google Scholar]
- 16.Fukuda K, Ohta T, Oshima Y, Ohashi N, Yoshikawa M, Yamazoe Y. Specific CYP3A4 inhibitors in grapefruit juice: furocoumarin dimers as components of drug interaction. Pharmacogenetics J. 1997; 7: 391–396. [DOI] [PubMed] [Google Scholar]
- 17.Goho C. Oral midazolam-grapefruit juice drug interaction. Pediatr Dent. 2001; 23: 365–365. [PubMed] [Google Scholar]
- 18.Midão L, Giardini A, Menditto E, Kardas P, Costa E. Polypharmacy prevalence among older adults based on the survey of health, ageing and retirement in Europe. Arch Gerontol Geriatr. 2018; 78: 213–220. [DOI] [PubMed] [Google Scholar]
- 19.Ellens H, Deng S, Coleman J, Bentz J, Taub ME, Ragueneau-Majlessi I, et al. Application of receiver operating characteristic analysis to refine the prediction of potential digoxin drug interactions. Drug. Metab. Dispos 2013; 41: 1367–1374. [DOI] [PMC free article] [PubMed] [Google Scholar]
- 20.van Eunen K, Kiewiet JA, Westerhoff HV, Bakker BM. Testing biochemistry revisited: how in vivo metabolism can be understood from in vitro enzyme kinetics. PLoS Comput. Biol 2012; 8: e1002483. [DOI] [PMC free article] [PubMed] [Google Scholar]
- 21.Huh Y, Smith DE, Feng MR. Interspecies scaling and prediction of human clearance: comparison of small- and macro-molecule drugs. Xenobiotica. 2011; 41: 972–987. [DOI] [PMC free article] [PubMed] [Google Scholar]
- 22.Kirchmair J, Göller AH, Lang D, Kunze J, Testa B, Wilson ID, et al. Predicting drug metabolism: experiment and/or computation? Nat. Rev. Drug Discov 2015; 14: 387–404. [DOI] [PubMed] [Google Scholar]
- 23.Macalino SJY, Gosu V, Hong S, Choi S. Role of computer-aided drug design in modern drug discovery. Arch. Pharm. Res 2015; 38: 1686–1701. [DOI] [PubMed] [Google Scholar]
- 24.Czodrowski P, Kriegl JM, Scheuerer S, Fox T. Computational approaches to predict drug metabolism. Expert Opin. Drug Metab. Toxicol 2009; 5: 15–27. [DOI] [PubMed] [Google Scholar]
- 25.Van De Waterbeemd H, Gifford E. ADMET in silico modelling: towards prediction paradise? Nat. Rev. Drug Discov 2003; 2: 192–204. [DOI] [PubMed] [Google Scholar]
- 26.Van De Waterbeemd H, Smith DA, Beaumont K, Walker DK. Property-based design: optimization of drug absorption and pharmacokinetics. J. Med. Chem 2001; 44: 1313–1333. [DOI] [PubMed] [Google Scholar]
- 27.Kingsley LJ, Wilson GL, Essex ME, Lill MA. Combining structure-and ligand-based approaches to improve site of metabolism prediction in CYP2C9 substrates. Pharm. Res 2015; 32: 986–1001. [DOI] [PMC free article] [PubMed] [Google Scholar]
- 28.Ekins S, Andreyev S, Ryabov A, Kirillov E, Rakhmatulin EA, Sorokina S et al. A combined approach to drug metabolism and toxicity assessment. Drug Metab. Dispos 2006; 34: 495. [DOI] [PubMed] [Google Scholar]
- 29.Rydberg P, Olsen L. Ligand-based site of metabolism prediction for cytochrome P450 2D6. ACS Med. Chem. Lett 2012; 3: 69–73. [DOI] [PMC free article] [PubMed] [Google Scholar]
- 30.Sun H, Scott DO. Structure-based drug metabolism predictions for drug design. Chem. Biol. Drug Des 2010; 75: 3–17. [DOI] [PubMed] [Google Scholar]
- 31.Plonka W, Stork C, Šícho M, Kirchmair J. CYPlebrity: Machine learning models for the prediction of inhibitors of cytochrome P450 enzymes. Bioorg. Med. Chem 2021; 46: 116388. [DOI] [PubMed] [Google Scholar]
- 32.Rydberg P, Gloriam DE, Zaretzki J, Breneman C, Olsen L. SMARTCyp: a 2D method for prediction of cytochrome P450-mediated drug metabolism. ACS Med. Chem. Lett 2010; 1: 96–100. [DOI] [PMC free article] [PubMed] [Google Scholar]
- 33.Rydberg P, Gloriam DE, Olsen L. The SMARTCyp cytochrome P450 metabolism prediction server. J. Bioinform 2010; 26: 2988–2989. [DOI] [PubMed] [Google Scholar]
- 34.Olsen L, Montefiori M, Tran KP, Jørgensen FS. SMARTCyp 3.0: enhanced cytochrome P450 site-of-metabolism prediction server. J. Bioinform 2019; 35: 3174–3175. [DOI] [PubMed] [Google Scholar]
- 35.Rydberg P, Rostkowski M, Gloriam DE, Olsen L. The contribution of atom accessibility to site of metabolism models for cytochromes P450. Mol. Pharmaceutics. 2013; 10: 1216–1223. [DOI] [PubMed] [Google Scholar]
- 36.Hwang S, Shin HK, Shin SE, Seo M, Jeon H-N, Yim D-E, et al. PreMetabo: an in silico phase I and II drug metabolism prediction platform. Drug Metab. Pharmacokinet 2020; 35: 361–367. [DOI] [PubMed] [Google Scholar]
- 37.Zaretzki J, Bergeron C, Rydberg P, Huang T-w, Bennett KP, Breneman CM. RS-Predictor: a new tool for predicting sites of cytochrome P450-mediated metabolism applied to CYP 3A4. J. Chem. Inf. Model. 2011; 51: 1667–1689. [DOI] [PMC free article] [PubMed] [Google Scholar]
- 38.Zaretzki J, Bergeron C, Huang T-w, Rydberg P, Swamidass SJ, Breneman CM. RS-WebPredictor: a server for predicting CYP-mediated sites of metabolism on drug-like molecules. J. Bioinform 2013; 29: 497–498. [DOI] [PMC free article] [PubMed] [Google Scholar]
- 39.Zaretzki J, Rydberg P, Bergeron C, Bennett KP, Olsen L, Breneman CM. RS-Predictor models augmented with SMARTCyp reactivities: robust metabolic regioselectivity predictions for nine CYP isozymes. J. Chem. Inf. Model 2012; 52: 1637–1659. [DOI] [PMC free article] [PubMed] [Google Scholar]
- 40.Rudik A, Dmitriev A, Lagunin A, Filimonov D, Poroikov V. SOMP: web server for in silico prediction of sites of metabolism for drug-like compounds. J. Bioinform 2015; 31: 2046–2048. [DOI] [PubMed] [Google Scholar]
- 41.Rudik AV, Dmitriev AV, Lagunin AA, Filimonov DA, Poroikov VV. metabolism site prediction based on xenobiotic structural formulas and PASS prediction algorithm. J. Chem. Inf. Model. 2014; 54: 498–507. [DOI] [PubMed] [Google Scholar]
- 42.Zaretzki J, Matlock M, Swamidass SJ. XenoSite: accurately predicting CYP-mediated sites of metabolism with neural networks. J. Chem. Inf. Model 2013; 53: 3373–3383. [DOI] [PubMed] [Google Scholar]
- 43.Matlock MK, Hughes TB, Swamidass SJ. XenoSite server: a web-available site of metabolism prediction tool. J. Bioinform. 2014; 31: 1136–1137. [DOI] [PubMed] [Google Scholar]
- 44.Zheng M, Luo X, Shen Q, Wang Y, Du Y, Zhu W, et al. Site of metabolism prediction for six biotransformations mediated by cytochromes P450. J. Bioinform 2009; 25: 1251–1258. [DOI] [PubMed] [Google Scholar]
- 45.Banerjee P, Dunkel M, Kemmler E, Preissner R. SuperCYPsPred—a web server for the prediction of cytochrome activity. Nucleic Acids Res. 2020; 48: W580–W585. [DOI] [PMC free article] [PubMed] [Google Scholar]
- 46.Dong J, Wang N-N, Yao Z–J, Zhang L, Cheng Y, Ouyang D, et al. ADMETlab: a platform for systematic ADMET evaluation based on a comprehensively collected ADMET database. J. Cheminformatics 2018; 10: 29. [DOI] [PMC free article] [PubMed] [Google Scholar]
- 47.Tian S, Djoumbou-Feunang Y, Greiner R, Wishart DS. CypReact: a software tool for in silico reactant prediction for human cytochrome P450 enzymes. J. Chem. Inf. Model 2018; 58: 1282–1291. [DOI] [PubMed] [Google Scholar]
- 48.Djoumbou-Feunang Y, Fiamoncini J, Gil-de-la-Fuente A, Greiner R, Manach C, Wishart DS. BioTransformer: a comprehensive computational tool for small molecule metabolism prediction and metabolite identification. J. Cheminformatics 2019; 11: 1–25. [DOI] [PMC free article] [PubMed] [Google Scholar]
- 49.Katoh M, Nakajima M, Shimada N, Yamazaki H, Yokoi T. Inhibition of human cytochrome P450 enzymes by 1,4-dihydropyridine calcium antagonists: prediction of in vivo drug-drug interactions. Eur. J. Clin. Pharmacol 2000; 55: 843–852. [DOI] [PubMed] [Google Scholar]
- 50.Temml V, Kutil Z. Structure-based molecular modeling in SAR analysis and lead optimization. Comput. Struct. Biotechnol. J 2021; 19: 1431–1444. [DOI] [PMC free article] [PubMed] [Google Scholar]
- 51.Kirchmair J, Williamson MJ, Tyzack JD, Tan L, Bond PJ, Bender A, et al. Computational prediction of metabolism: sites, products, SAR, P450 enzyme dynamics, and mechanisms. J. Chem. Inf. Model 2012; 52: 617–648. [DOI] [PMC free article] [PubMed] [Google Scholar]
- 52.Kazmi SR, Jun R, Yu M-S, Jung C, Na D. In silico approaches and tools for the prediction of drug metabolism and fate: a review. Comput. Biol. Med 2019; 106: 54–64. [DOI] [PubMed] [Google Scholar]
- 53.Dulsat J, López-Nieto B, Estrada-Tejedor R, Borrell JI. evaluation of free online ADMET tools for academic or small biotech environments. Mol. 2023; 28: 776. [DOI] [PMC free article] [PubMed] [Google Scholar]
- 54.Kar S, Leszczynski J. Open access in silico tools to predict the ADMET profiling of drug candidates. Expert. Opin. Drug Discov 2020; 15: 1473–1487. [DOI] [PubMed] [Google Scholar]
- 55.Tyzack JD, Kirchmair J. Computational methods and tools to predict cytochrome P450 metabolism for drug discovery. Chem. Biol. Drug Des 2019; 93: 377–386. [DOI] [PMC free article] [PubMed] [Google Scholar]
- 56.Gaulton A, Hersey A, Nowotka M, Bento AP, Chambers J, Mendez D, et al. The ChEMBL database in 2017. Nucleic Acids Res. 2017; 45: D945–D954. [DOI] [PMC free article] [PubMed] [Google Scholar]
- 57.US EPA. www.epa.gov/. [Accessed July 22, 2023].
- 58.Wishart DS, Knox C, Guo AC, Shrivastava S, Hassanali M, Stothard P, et al. DrugBank: a comprehensive resource for in silico drug discovery and exploration. Nucleic Acids Res. 2006; 34: D668–72. [DOI] [PMC free article] [PubMed] [Google Scholar]
- 59.PubChem. https://pubchem.ncbi.nlm.nih.gov/ [Accessed July 22, 2023].
- 60.ChEMBL Database. https://www.ebi.ac.uk/chembl/ [Accessed July 22, 2023].
- 61.DrugBank Online. https://go.drugbank.com/ [Accessed July 22, 2023].
- 62.Database Fujitsu. www.fujitsu.com/global/products/software/middleware/database/ [Accessed July 22, 2023].
- 63.Solutions – At Every Stage in the R&D Process. http://akosgmbh.de/pdf/overview.pdf [Accessed July 22, 2023].
- 64.MDLI. Medical Information System. www.mdli.com [Accessed July 22, 2023].
- 65.BIOVIA Databases. www.3ds.com/products-services/biovia/products/scientific-informatics/biovia-databases/. [Accessed July 22, 2023].
- 66.Singh SB, Shen LQ, Walker MJ, Sheridan RP. A model for predicting likely sites of CYP3A4-mediated metabolism on drug-like molecules. J. Chem. Inf. Model 2003; 46: 1330–1336. [DOI] [PubMed] [Google Scholar]
- 67.Whirl-Carrillo M, McDonagh EM, Hebert JM, Gong L, Sangkuhl K, Thorm CF, et al. Pharmacogenomics knowledge for personalized medicine. Clin. Pharmacol. Ther 2012; 92: 414–417. [DOI] [PMC free article] [PubMed] [Google Scholar]
- 68.Spjuth O, Rydberg P, Willighagen EL, Evelo CT, Jeliazkova N. XMetDB: an open access database for xenobiotic metabolism. J. Cheminformatics 2016; 8: 47. [DOI] [PMC free article] [PubMed] [Google Scholar]
- 69.Preissner S, Kroll K, Dunkel M, Senger C, Goldsobel G, Kuzman D, et al. SuperCYP: a comprehensive database on Cytochrome P450 enzymes including a tool for analysis of CYP-drug interactions. Nucleic Acids Res. 2010; 38: D237–D243. [DOI] [PMC free article] [PubMed] [Google Scholar]
- 70.Lee H, Yune S, Mansouri M, Kim M, Tajmir SH, Guerrier CE, et al. An explainable deep-learning algorithm for the detection of acute intracranial haemorrhage from small datasets. Nat. Biomed. Eng 2019; 3: 173–182. [DOI] [PubMed] [Google Scholar]
Associated Data
This section collects any data citations, data availability statements, or supplementary materials included in this article.