

Abstract
Can we construct a model of brain function that enables an understanding of the whole-brain circuit mechanisms underlying neurological disease, and use it to predict a therapeutic intervention’s outcome? How are pathologies in neurological disease, some of which are observed to have spatial spreading mechanisms, associated with circuits and brain function? In this review, we will discuss approaches that have been taken to date, and future directions that can be employed to answer these questions. By combining optogenetic fMRI with computational modeling, cell-type-specific, large-scale brain circuit function and dysfunction are now starting to be quantitatively parameterized. We envision that these developments will pave the path for future therapeutics developments based on a systems engineering approach that can aim to directly restore brain function.
Can we systematically design treatments for brain disorders such as Parkinson’s Disease? To enable this, we need a full algorithmic description, beyond simple correlations, of how specific cells or brain regions cooperatively contribute to the behavior or symptom in the context of whole-brain network. What does it take to generate such algorithms? Cell types cannot be ignored because even neurons that are in the same location of the brain can drive completely opposite functions and resulting behaviors (1, 2). Neurons often interact with large networks across the whole brain. A limited field of view within the brain is thus insufficient to understand these algorithms. Therefore, in order to obtain the data necessary to reconstruct these algorithms of behavioral control, we need an imaging system that can measure cell-type-specific, whole-brain function. Optogenetic functional magnetic resonance imaging (ofMRI) (3) has begun to achieve this goal. With ofMRI, we can select cell-type-specific modulation targets while monitoring the outcome of such modulation across the whole brain, in vivo with high spatiotemporal resolution. This has opened a new window into the study of brain function. We can see how modulating specific elements of the brain leads to specific behaviors of interest, while also directly observing the inner workings of the brain that led to such behaviors. Through computational modeling of ofMRI-signal measured across the whole-brain (4), cell-type-specific, large-scale brain function can be quantitatively described at the regional level. Once regional interaction maps are reconstructed, we envision that biophysical modeling can be combined to enable cell-type-specific, large-scale modeling of brain function at the single-cell-spiking level. In addition, while restoring brain function is the ultimate goal of neurological disease treatment, understanding how prominent pathology relates to brain function is also of critical importance. In this review, we will discuss approaches taken to date, and approaches that can be employed in the future towards these goals.
Bridging scales with optogenetic fMRI.
ofMRI is a technology that combines optogenetic stimulation with fMRI readout. Optogenetics (5, 6) enables cell-type-specific, millisecond-scale, activity modulation using light while high-field fMRI measures the resulting hemodynamic responses in live subjects across the whole brain. In the initial proof-of-concept study (3), motor cortex excitatory neurons triggered fMRI responses that could be measured throughout the brain with sub-second temporal resolution. To accelerate scientific discovery with ofMRI, several technological innovations were made. Real-time imaging with robustness to the live subject’s motion that achieves data acquisition, reconstruction, motion correction (7), and analysis of 3D images with high accuracy in approximately 12 ms was developed. To resolve cortical layer and sub-nuclei specific responses, novel compressed sensing (8–10) and machine learning based fMRI technology was developed, which achieved significant reduction in voxel volume. MR-compatible optrodes and electrodes were also developed for simultaneous electrophysiological recordings to validate the neural basis of the ofMRI hemodynamic signal (11, 12). They can achieve simultaneous acquisition of electrophysiology recordings during fMRI sessions, and provide information with higher temporal resolution in regions of interest identified by ofMRI.
Utilizing these advanced ofMRI technologies, capabilities and precision of ofMRI has been extensively tested. It has been shown that location, polarity, and temporal shape of neural activity can be accurately inferred from the ofMRI signal (3, 13, 14), and that neural activity can be measured by ofMRI across multiple synapses (11, 15). Stimulation cell-type, location, frequency (14, 15), and intensity (11) was shown to dramatically change the location and shape of activities throughout the brain. It was also made clear that whole-brain neural dynamics as measured by ofMRI can accurately predict distinct behaviors (2, 14, 15).
Many studies have used ofMRI to improve our understanding of fundamental circuitries associated with behavior, memory, and cognition. For instance, ofMRI studies identified that frequency-dependent thalamic activities drive distinct whole-brain function in circuits associated with arousal, attention, and somatosensory function (16–18). ofMRI studies revealed distinct dorsal and ventral hippocampal control of brain-wide function (15, 19), circuits associated with cell-type-specific targeting of somatosensory cortex (20), and cerebellar cortex functional control over forebrain and midbrain (21). Another study revealed brain-wide dynamics that govern how the medial prefrontal cortex regulates reward-related behaviors through distant regions such as the striatum (22). A recent study has tried fMRI with cell-type-specific activation of astrocytes (23). These studies have shown that the observed hemodynamic activities are closely tied to neuronal activities using either simultaneous or follow-up electrophysiology. Furthermore, although most ofMRI studies have been conducted in rodents, it has also been applied to non-human primates, where both saccade latencies and whole-brain activity were found to be dependent on specific neuronal targets in the motor cortex (24).
The ability to probe and readout whole-brain activity with ofMRI has also advanced our understanding of dysfunctional circuitry associated with neurological disorders. For studying epilepsy, ofMRI provided a unique advantage of being able to optogenetically-induce seizures with precise origins on demand, while measuring the resulting whole-brain activities with simultaneous electrophysiology recordings. This enabled studies that can generate models to predict and classify seizures using its early activity markers (15, 25). Furthermore, longitudinal effects of seizures on global brain function could be measured to understand how the disease progresses and how seizures are generated and maintained (26). These advances aid our understanding of circuit mechanisms underlying seizures, help design intervention parameters, such as stimulation location and frequency to effectively inhibit seizures. Optogenetic fMRI can also elucidate mechanisms behind existing therapies, such as poststroke recovery. Activation as measured by ofMRI was highly predictive of the degree of recovery, and identified sensory circuits involved in this process (27).
We can now start to reveal detailed circuit mechanisms that were challenging to understand before. As an example, we will review studies uncovering how D1- and D2-receptor expressing medium spiny neurons (MSNs) dynamically regulate global brain function and dysfunction (Fig. 1). The cortico-basal-ganglia-thalamus circuit is implicated in many important brain functions including motor control and reward mechanisms. Neurological disorders such as Parkinson’s Disease, Huntington’s Disease, addiction, and autism involve this network. The caudate putamen seats the D1- and D2-MSNs (Fig. 1A), which is the key node that separates the direct and indirect pathways (Fig. 1B). To assess the brain-wide dynamics driven by inhibitory D1- and D2-MSNs, Lee et al. performed whole-brain fMRI during repeated 20 s periods of optogenetic D1- or D2-MSN stimulations (2) (Fig. 1C). Active voxels were identified as those significantly synchronized to the repeated stimulations (Fig. 1D). The local signal at the site of stimulation was positive for both inhibitory D1- and D2-MSN stimulations (Fig. 1E), shedding light on a widely debated issue whether activity of inhibitory neurons evokes a positive or negative fMRI signal. At most regions of the ipsilateral cortico-basal-ganglia-thalamus network, the evoked response in a given region exhibited qualitatively different temporal profiles between D1- and D2-MSN stimulations (Fig. 1, D and E). Given the diversity of BOLD responses evoked by D1- and D2-MSN stimulations, we sought to verify whether the responses reflected underlying neuronal activity using single-unit recordings. For example, the fMRI time series in thalamus exhibited robust and reliable increases and decreases upon D1- and D2-MSN stimulations, respectively (Fig. 1, D and E). Indeed, single-units exhibited an increase in firing rate during D1-MSN stimulations and a decrease in firing rate during D2-MSN stimulations (Fig. 1F). These results demonstrate that ofMRI can detect cell-type-specific multi-synaptic activity changes across the whole brain with high spatiotemporal precision, and that electrophysiological recordings alongside ofMRI can support these findings.
Fig. 1. Optogenetic functional magnetic resonance imaging bridges scale.
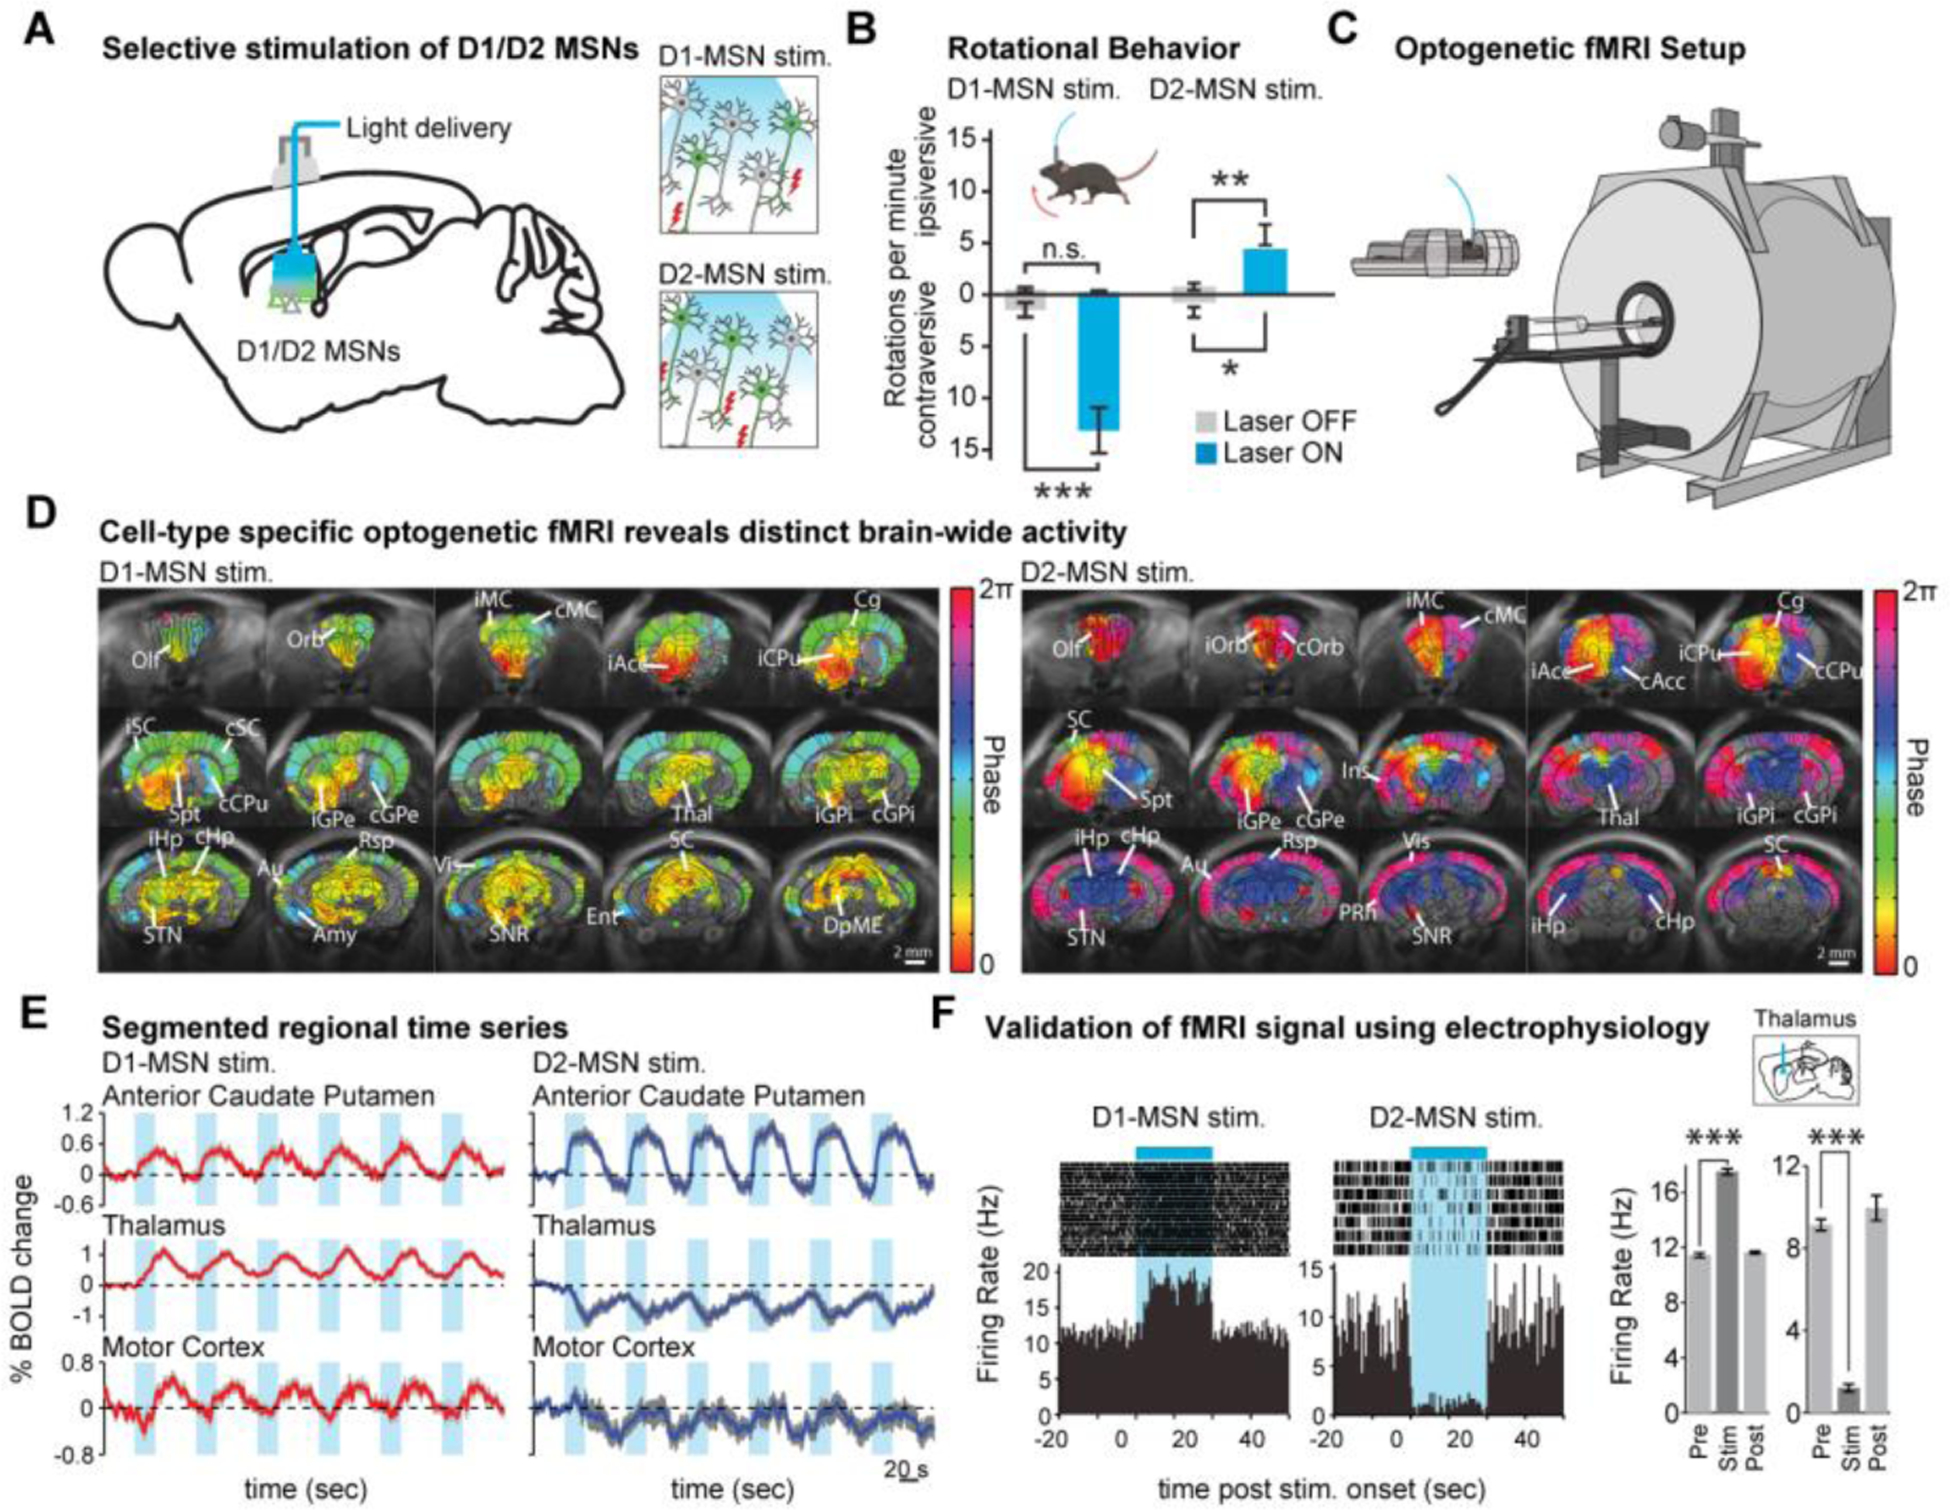
(A) Optogenetics enable cell-type-specific stimulations, such as the selective targeting of D1- or D2-MSNs in the striatum. (B) With selective stimulations of D1- or D2-MSNs in the striatum, mouses show contraversive or ipsiversive rotations, respectively (D1-MSN stim: n = 12 animals, mean ± SEM, ∗∗∗p < 0.001, two-tailed paired t test; D2-MSN stim: n = 11 animals, mean ± SEM, ∗p < 0.05, ∗∗p < 0.005, two-tailed paired t test). (C) Optogenetic fMRI technology combines optogenetic stimulations with fMRI readout. (D) ofMRI with selective stimulation of D1- and D2-MSN results in distinct brain-wide activities that are associated with distinct behavior (n = 12 animals). Group-wise phase maps, which were thresholded to only active voxels within the brain, depict the heterogeneity in the temporal dynamics of the evoked responses. (E) Time series of any region can be extracted from the four-dimensional fMRI data. (F) Electrophysiology recordings mirror fMRI response in polarity of neural activity change. This figure is based on Lee et al. (2).
As with any technology, ofMRI has caveats for future improvements as well as potential pitfalls that need to be avoided. Channelrhodopsin (ChR2) is known to evoke synchronized neuronal activity upon light stimulation. Therefore, before launching an ofMRI investigation, it is important to first investigate the behavioral impact of the optogenetic stimulations, as a mean to ensure that the behavior generated is of interest in either normal physiological or pathological context. For example, in our D1- and D2-MSN stimulation ofMRI experiments, increased contralateral and ipsilateral rotations were observed, respectively (2) (Fig. 1B). This shows that the two separate stimulations result in opposite behaviors known to be associated with movement disorders. The fact that ChR2 evokes synchronization upon light stimulation also makes it suitable for studying pathological oscillations in a number of disease models/contexts. Excessive beta-band oscillations in Parkinson’s Disease have been extensively explored with ChR2 induced oscillations (28, 29). Some newer opsins, such as stabilized step function opsin (SSFO) (30), modulate target neurons by increasing the excitability to amplify existing spontaneous activity, which expands the application range of ofMRI to more physiological conditions. There are many aspects of ofMRI that can be further improved. For example, ofMRI will benefit greatly from higher spatio-temporal resolution, real-time feedback-based stimulation control, and imaging during behaviors (7, 31).
It is also important to note other technologies that have been developed for the investigation of brain circuitries, including high-speed volumetric calcium imaging (32, 33), probes for high-density electrophysiology recordings (34, 35), and widefield calcium and voltage imaging (36). Compared to ofMRI, these new advances offer higher spatiotemporal resolution, although limited by recording depths and field of view. For example, widefield “whole-cortex” calcium imaging enables up to 30 Hz simultaneous recording of cortical regions, but its depth coverage is limited to superficial layers of cortex. Combining fMRI and widefield calcium imaging has been shown to mitigate the limitations of both methods (36). Therefore, future ofMRI studies could be integrated and with other technologies for complementary strengths.
Cell-type-specific modeling of large-scale brain function.
Large-scale neural network models (37–41) utilizing experimental data from PET (42), fMRI (43), EEG/MEG (44) have made significant contributions to understanding brain functions. However, although these modeling efforts are based on data from carefully designed experiments that attempt to isolate specific brain function, multiple networks and pathways mediated by different cell types are simultaneously involved in orchestrating a brain function. Therefore, without the capability to untangle contributions from different cell types across the whole brain, models have been limited in their capabilities. The development of ofMRI technology opens a new opportunity in terms of whole-brain computational modeling because it uniquely measures cell-type-specific whole-brain dynamics.
For example, the cortico-basal-ganglia-thalamus network features a large number of network nodes (Fig. 2A) and distinct cell types that have distinct long-range projections. According to the canonical functional model of basal ganglia (45, 46), movement initiation and suppression are mediated by the direct and indirect pathways, respectively (Fig. 2B). The direct pathway promotes movements through D1-MSN excitation in the striatum followed by excitation in the thalamus and consequently the motor cortex. On the other hand, the indirect pathway is assumed to transfer the activation of D2-MSN in the striatum via complex interactions within the basal ganglia, resulting in inhibition of the thalamus and consequently the motor cortex. However, despite the wide usage and success of the canonical model in explaining experimental results, recent experimental evidence argues against the model and finds the interactions between the two pathways still puzzling. For example, the direct and indirect pathways operate simultaneously during movement onsets (47).
Fig. 2. Computational modeling of ofMRI data reveals brain-wide functional interaction dynamics.
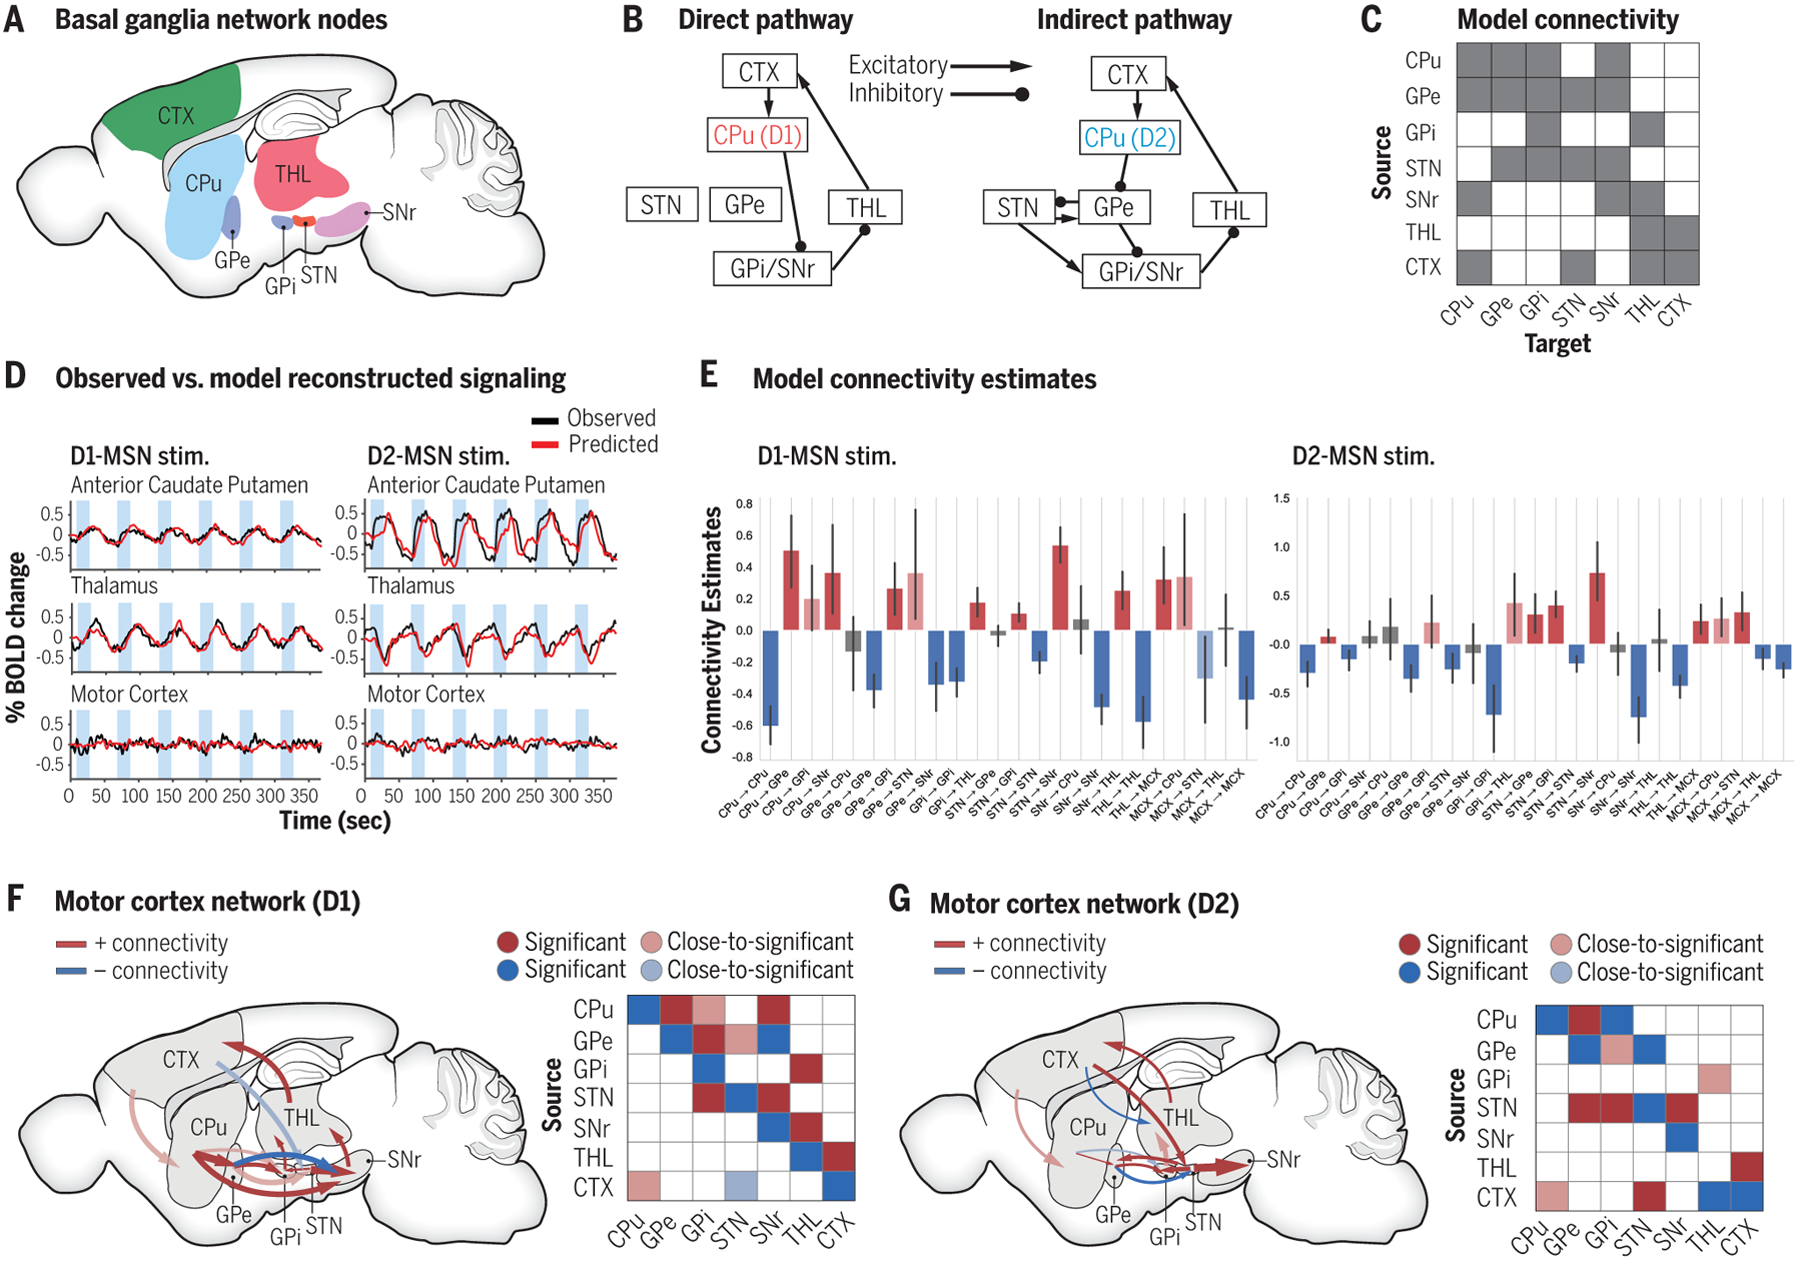
(A) Cortico-basal-ganglia-thalamus network involves a large number of network nodes across the brain. (B) Direct and indirect pathways’ anatomical connectivity involve large number of common anatomical regions with distinct cell types in caudate putamen (CPu). (C) Anatomical connections were used as a priori generative network model. In addition to direct and indirect pathways shown in (B), other established anatomical connections, e.g., hyper-direct pathway, were also included. (D) DCM generated fMRI time series closely match experimental ofMRI time series. (E) DCM utilized ofMRI data to estimate the causal influence (effective connectivity) among regions of interest during D1- and D2-MSN stimulations, respectively. (F and G) The graph and matrix representations of effective connectivity network for (F) D1-MSN, and (G) D2-MSN stimulations, respectively. Significant and close-to-significant represent parameters with p < 0.05 and 0.05 ≤ p < 0.10, respectively (one-sample t test, multiple comparison correction across connections with FDR p < 0.10). CPu: caudate putamen; GPe: external globus pallidus; GPi: internal globus pallidus; STN: subthalamic nucleus; SNr: substantia nigra; THL: thalamus; CTX: cortex. This figure is based on Bernal-casas et al. (4).
As demonstrated earlier with ofMRI, we can decompose the operation of the cortico-basal-ganglia-thalamus network by optogenetically activating D1- and D2-MSNs selectively and directly observing the corresponding brain-wide dynamics (2) (Fig. 1). However, the degree of connectivity in the cortico-basal-ganglia-thalamus network is too high (Fig. 2, B and C) to identify regional causal influences based on the time series alone (Fig. 2D). Through computational modeling such as dynamic causal modeling (DCM), with the precision afforded by the ofMRI data, cell-type-specific causal linkages among regions of interest (ROIs) in the cortico-basal-ganglia-thalamus network could be identified.
DCM is a modeling scheme that estimates the causal coupling (effective connectivity) in a multi-region network based on neuroimaging data (fMRI, MEG/EEG) (48–50). The estimations are fitted to empirical results using Bayesian techniques. One major strength of DCM is that the estimated regional connectivities are directional, which is especially valuable for networks with a lot of reciprocal connections and feedbacks like the cortico-basal-ganglia-thalamus network. ofMRI can also be combined with other modeling schemes. For example, Salvan et al. (51) optogenetically modulated the entorhinal cortex and combined hidden Markov modeling with ofMRI data to study how entorhinal cortex drives frequency-dependent brain-wide dynamic states. In another study, multivariate dynamical systems (MDS) causal modeling was used with ofMRI to estimate causal brain interactions (52). Like DCM, MDS models both intrinsic and experimentally induced causal couplings in a large-scale brain network.
In our previous study (4), spectral DCM (38), a variation of DCM that enables large-scale networks to be modeled with computational efficiency, was used to investigate the interactions within the cortico-basal-ganglia-thalamus network with ofMRI data from D1- and D2-MSN optogenetic stimulations. One recent study reported consistent results using DCM with D1- and D2-MSN stimulation ofMRI data (53). As illustrated in Figure 2, combining DCM or equivalent modeling schemes with ofMRI data can accurately reveal brain-wide regional interactions. The time series is also accurately reproduced by DCM, closely matching experimental ofMRI time series (Fig. 2D). Figures 2E–G show the DCM estimations of between-region effective connectivity (4) utilizing ofMRI data. DCM results verified the direct pathway activation during D1-MSN stimulation and indirect pathway activation during D2-MSN stimulation. The defining connections of direct pathway model are statistically significant (CPu to SNr, GPi to thalamus, SNr to thalamus) or close-to-significant (CPu to GPi) with D1-MSN stimulations. In the D2-MSN stimulation network, significant connections included those of indirect pathway (CPu to GPe, GPe to STN, STN to GPi/SNr, and GPi to thalamus). The existence of cortical feedbacks can also be observed (Fig. 2F and G). On the other hand, the effective connectivity estimates by DCM also suggest several positive projections that are anatomically inhibitory and cannot be explained by the canonical direct/indirect pathway model, such as the projections from GPi to thalamus during D1-MSN stimulations, which matches several experimental reports of GPi-thalamus paradoxical coactivation (2, 54–56). Understanding the mechanism underlying such paradoxical connections requires further microscopic investigations into the specific synaptic interactions with techniques like single-cell-spiking level modeling and single-unit recordings, as we will discuss next.
Cell-type-specific, single-cell-spiking level modeling of brain-wide function.
One key strength of computational modeling is that it can bridge between spatial scales, from whole-brain dynamics to single-cell activity, and explain data from different experimental modalities, from fMRI to extracellular recordings (57, 58). DCM and other macroscale and mesoscale brain models commonly use neural mass models or mean-field models as the basic unit which describes the collective neural activity in a brain region or a cortical column (42–44). On the other hand, single-cell-spiking models computationally depict the microscopic biophysical features of how single-cell level spiking controls and modulates brain functions/dysfunctions (59–61).
Despite having the ability to capture and model the macroscale and mesoscale interactions between separate regional populations of neurons in the brain with ofMRI and DCM, there is certainly an added advantage in modeling the interactions between individual neurons of varying cell-type. Neurological disorders may differentially impact specific cell populations within one brain region. Optogenetically stimulating one type of cell population, while inhibiting another type in external globus pallidus (GPe) prolonged the therapeutic effects on a mouse model of Parkinson’s Disease (52). It is widely assumed and supported by optogenetics studies that Parkinson’s Disease causes hyperactivity of D2-MSNs and hypoactivity of D1-MSNs, thus impairing the balance between the direct and indirect pathways (46, 47, 62). DYT1 dystonia, a genetic early onset dystonia, is related to cholinergic interneuron dysfunction and altered D2 receptor-function in striatum (63, 64). Firing pattern alterations of one cell type may also contribute to large-scale changes. Optogenetic stimulation in striatal cholinergic interneurons, a subpopulation constituting less than 2% of the striatum, could generate broad-band oscillations in the motor network (29). With cell-type-specific, single-cell-spiking level modeling, it is easier to address the heterogeneity and rich microscopic interactions within one region with biophysical details. ofMRI-based DCM or other regional brain dynamics model can serve as a bridge between whole-brain dynamics and single-cell-spiking level activity, enabling construction of large-scale, cell-type-specific biophysical models that can test neuronal-level hypotheses.
Cell-type-specific, single-cell-spiking level models that can accurately predict circuit function and dysfunction can be very powerful tools for designing or optimizing therapy. Thus far, many large-scale models without cell type specificity have been constructed to test various hypotheses underlying deep-brain stimulation (DBS), an existing therapy for Parkinson’s Disease (65–67). However, because each cell type in the basal ganglia has distinct synaptic and physiological properties, accurate models would need cell-type-specific parameters that can fit cell-type-specifically acquired experimental data. We envision that ofMRI, DCM, and electrophysiological recordings can be combined to build large-scale biophysical models that can model brain-wide activity at the single-cell-spiking level. Figure 3A demonstrates this vision. With ofMRI and electrophysiology experiments providing multi-scale data, and DCM providing brain-wide interaction information, single-cell level biophysical models, with accurate cell-type-specific, large-scale context, can be built and validated (Fig. 3B). As illustrated in Figures 3C and D, a single-cell-spiking level model can be designed to reproduce experimental neuronal activity and group dynamics with high precision. With such models, we can imagine simulating brain-wide spiking activity from “virtual neuromodulations” without needing to do in vivo experiments. We would then be able to use these results to better optimize therapeutic targets and parameters where simulated spiking matches our desired response. For example, a recent study (68) employed optogenetics and single-cell level computational modeling within three different cell types of the motor cortex to show that DBS on cortical somatostatin interneurons can rescue Parkinsonian symptoms. We envision that in the future, ofMRI-enabled brain-wide models with single-cell-spiking level precision will ultimately enable systematic design of neuromodulation therapy with predictable outcome.
Fig. 3. Brain circuit function modeling at the single-cell-spiking level can be made possible through a multi-scale approach.
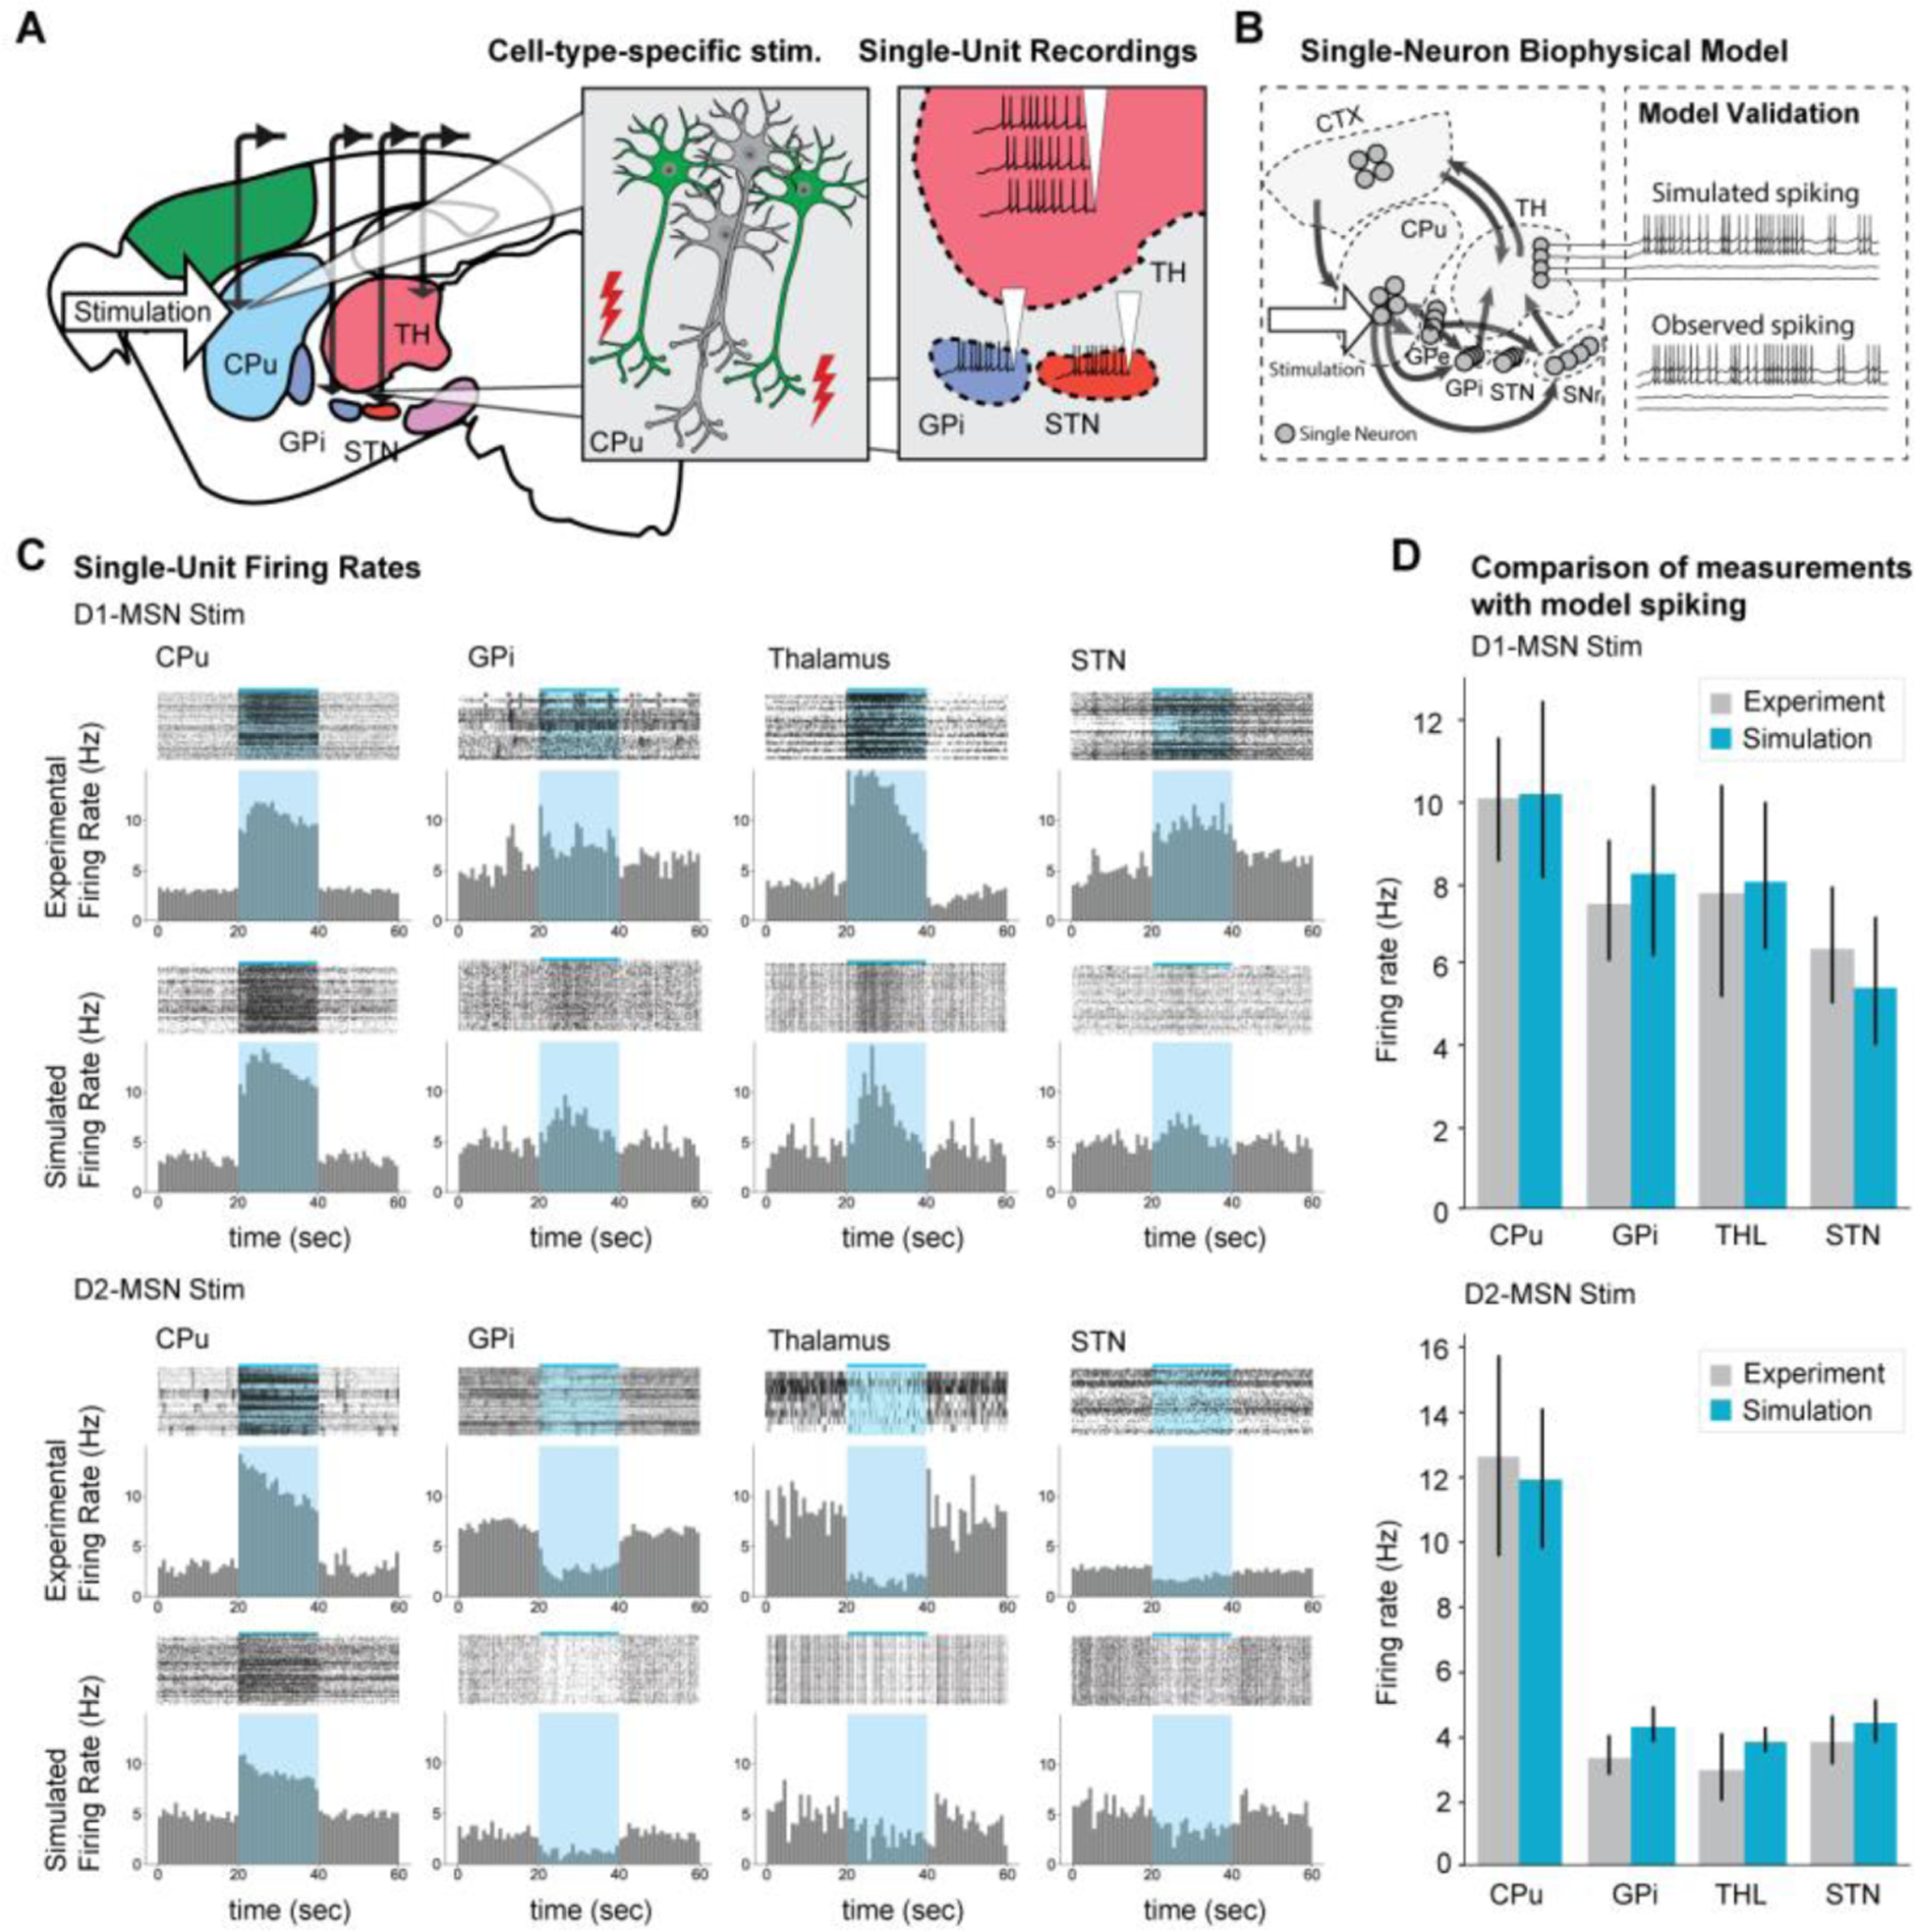
(A) Locations of optogenetic stimulation and in vivo extracellular recordings for the cortico-basal-ganglia-thalamus network study are schematically illustrated. (B) Single-cell-spiking level modeling with ofMRI and single-unit recordings data is exemplified. A large-scale model built with ofMRI data is expanded to single-neuron level biophysical model. Each ROI consists of many simulated single neurons. The model is validated by directly comparing simulated spiking trains with experimental data. (C) Models can allow experimental single-unit recording data and simulated data to be directly compared. (D) Models should be designed so that the spike rates of all ROIs simulated by the single-cell spiking level biophysical model statistically match experimental data. ofMRI combined with biophysics modeling can enable successful reproduction of the single-cell-spiking level dynamics induced by cell type specific optogenetic stimulations such as D1- and D2-MSN stimulations.
Modeling whole-brain pathology dynamics and its relationship to brain function.
The brain circuitry is relevant to neurological disorders beyond its utility in modeling local and global brain function. It is also important for understanding the underlying pathology of many disorders. In the case of Parkinson’s Disease and other synucleinopathies, the seeding and gradual accumulation of pathological alpha-synuclein (α-syn) causes dopaminergic neurodegeneration, which ultimately leads to striatal imbalance and the cardinal Parkinsonian signs (69). Although the specific biochemical trafficking mechanisms of these proteins remain unknown, several recent studies have shown that whole-brain spreading patterns are highly dependent on the inoculation site (70), and that anatomical connectivity is highly predictive of susceptible regions after induced seeding of α-syn pathology (71).
To understand the linkage between anatomical connections, pathology, and function, it is important to reliably measure the whole-brain pathological state. The last decade has seen several prominent advancements in whole-brain tissue clearing technology. These range from hydrogel-based techniques such as CLARITY (72) that enable multiplexed brain imaging but potentially require long incubation times, to solvent-based techniques like 3DISCO (73) that are generally faster but may bleach fluorescent signal. Combining these tissue clearing methods with whole-brain immunolabeling and light-sheet microscopy allows for high-resolution examination of whole-brain pathology using biochemical reporters (74, 75). As these three-dimensional whole-brain histological datasets now provide micron resolution and are exceeding terabytes in size, it is necessary to have automated registration and segmentation techniques (76) to capture the rich information provided by the data. Figure 4A depicts how a Parkinsonian disease model where the injection of α-synuclein PFFs are used to trigger whole-brain pathology can be systematically analyzed using computational pipeline. Brains can be immunolabeled and cleared at each time point using the iDISCO method (74), with the imaged aggregates automatically segmented and registered to a standardized atlas. As depicted in Figure 4B, longitudinal analysis of pathology can demonstrate a highly dynamic, brain-wide process of spreading after seeding of α-syn, consistent with numerous histological studies (69, 71). Registration to a standardized atlas can provide an enormous advantage enabling systematic statistical comparisons and analysis of disease pathology alongside connectomic (77), genetic (78), and vascular (79) databases, which all reside in the same reference coordinate space. Most notably, the Allen Connectivity Atlas (77) has been crucial in the development of models describing the spread of pathology through the connectome (71). For instance, network diffusion models represent the whole-brain circuitry as a directed graph with neuroanatomical regions as nodes and axonal pathways as edges between these nodes (Fig. 4C). They have found wide applicability in predicting the spread of α-syn pathology in both rodent and human imaging studies (71, 80), as well as in human dementia (81) and supranuclear palsy neuroimaging studies (82). In Figure 4C, we present an example of how a whole-brain model can accurately reconstruct the regional variability in pathology. Compared to previous models that depended on serial histological sectioning (71) or in vivo human imaging data (80), this type of modeling can provide a more comprehensive, higher resolution description of pathology dynamics that includes all brain regions, which is important for quantitative model descriptions. Given that transgenic mice such as those with modified LRRK2 (71, 83) or SNCA (69) expression demonstrate significantly altered spreading patterns, models can additionally incorporate the brain’s inherent genetic or cell-type-specific differences. As depicted in Figure 4D, re-weighting the connectivity matrix by regional expression of a gene-of-interest can allow for the evaluation of that gene’s relevance in disease spread. Henderson et al. weighted a network diffusion model with SNCA expression, demonstrating that in silico simulation of circuits and genes can recover observed α-synuclein pathology (71).
Fig. 4. To understand pathology function interaction, whole-brain pathology dynamics can be modeled alongside ofMRI.
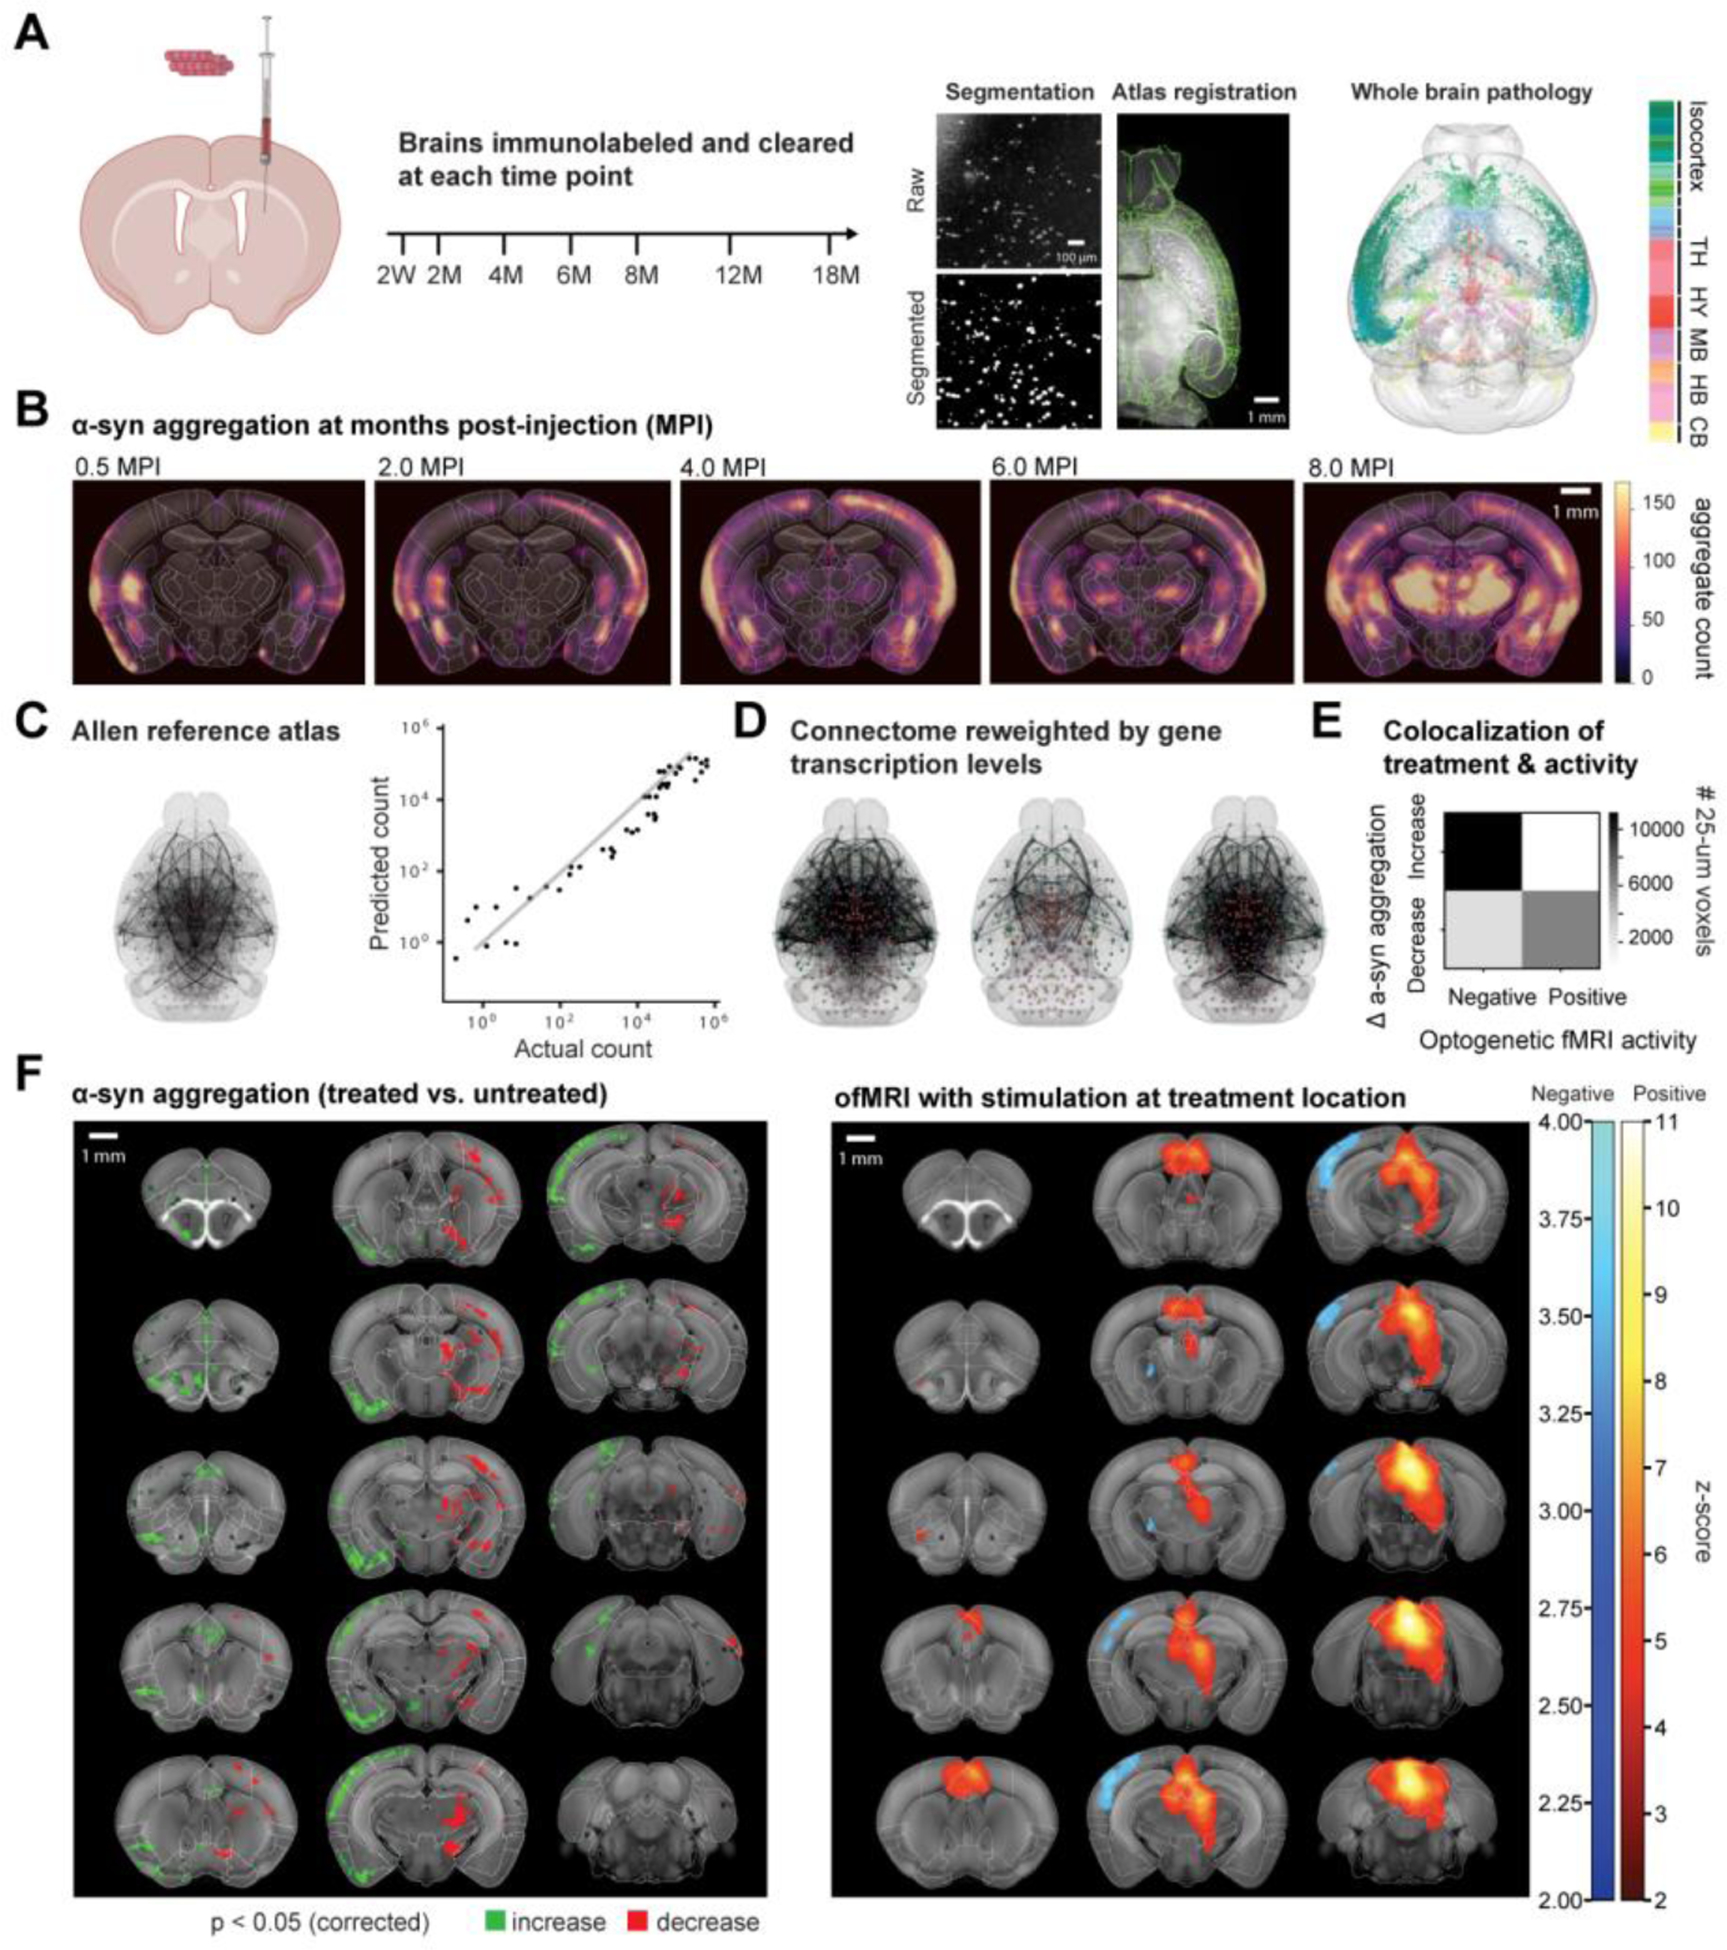
(A) α-synuclein PFFs injected into seed locations induce pathology at various time points post-injection, which can then be captured by iDISCO tissue clearing and light-sheet fluorescent microscopy (LSFM). Machine-learning based, automatic segmentation and registration techniques can streamline the quantification of each pathological marker within the Allen Reference Atlas (ARA). (B) Comparisons of averaged heatmaps across cohorts can depict whole-brain pathology changes over many months after the injection. (C) Modeling of longitudinal data based on whole-brain anatomical connectivity can capture regional differences in pathology. (D) Reweighting the connectivity matrix can allow for encoding of genetic contribution within a model. (E) Whole-brain colocalization analysis between optogenetic-stimulation induced alpha-synuclein pathology change and optogenetic fMRI activity can reveal pathology function relationship. In this example, positive activity is colocalized with decreases in pathology, while negative activity is highly colocalized with increases in pathology. (F) Montages of the modulated alpha-synuclein pathology and ofMRI brain activity maps show high degree of colocalization with opposite polarity.
Accurate whole-brain models of pathology dynamics that can predict both future and past states of these progressive disorders will have significant clinical implications. For example, a computational model that takes an arbitrary pathological state and predicts future states could guide interventions that depend on the predicted localization of pathology. Similarly, a model that can iterate backwards and compute previous states, even back to the initial seeding site, can further aid in disease progression classification for diagnosis purposes. Since neurodegenerative disorders like Parkinson’s Disease, Lewy Body Dementia, and Multiple System Atrophy have long been hypothesized to collectively form a neuropathological spectrum (84), modeling the various circuits that drive different pathologies and clinical manifestations will play a large part in precisely defining these disorders.
While functional and histological readouts provide distinct information regarding the brain and disease, their colocalization is likely to be important in both furthering our understanding of neural circuitry and developing novel therapeutics. For instance, combining ofMRI and whole-brain pathological labeling could aid in the development of therapeutics that treat the underlying pathology, such as α-syn pathology in Parkinson’s Disease. We give an example of spatial colocalization between optogenetic stimulation induced changes, and ofMRI-measured functional changes observed during the delivery of the same stimulation (Fig. 4, E and F). This optogenetic stimulation paradigm reduces the α-synuclein aggregate count at the site of stimulation and in various downstream regions. When colocalized with brain activity, their similar spatial locations but opposing polarities are apparent, revealing that positive activity is colocalized with decreases in pathology, while negative activity is highly colocalized with increases in pathology.
This ability to target pathology with neuromodulation, while predicting subsequent brain-wide changes in pathology could provide a new way of thinking about neuromodulation therapy for Parkinson’s Disease and related disorders. For instance, parameters such as duration and site of neuromodulation could be tailored to patients based on their current pathological state and neuromodulation parameter’s expected impact on pathology. Taking it one step further, therapy could even be designed while taking the expected future states of pathology into consideration. Altogether, the ability to readout and model pathology with brain clearing while measuring whole-brain network function with optogenetic fMRI will allow for the development of circuit-based models that bridge pathology and function.
Conclusion
These recent advancements in cell-type-specific neuromodulation, whole-brain functional imaging, and computational modeling are starting to pave a path for a significant turning point in neuroscience. We aim to establish new approaches to simulating brain function that can replicate and predict behaviors of interest. This will transform treatments of a wide array of neurological diseases including Parkinson’s Disease.
Acknowledgments:
Funding:
This work was supported by
NIH/NIMH RF1 MH114227,
NIH S10 OD025176,
NIH/NIBIB DP1 NS116783,
NIH/NIA R01 AG064051,
NIH/NIBIB R01 EB030884.
Footnotes
Competing interests: J.H.L. is a founder, consultant, and board member of LVIS.
Data and materials availability:
All data and materials necessary to understand and assess these conclusions are available in the manuscript.
References and Notes
- 1.Calabresi P, Picconi B, Tozzi A, Ghiglieri V, Di Filippo M, Direct and indirect pathways of basal ganglia: a critical reappraisal. Nat Neurosci 17, 1022–1030 (2014). [DOI] [PubMed] [Google Scholar]
- 2.Lee HJ et al. , Activation of Direct and Indirect Pathway Medium Spiny Neurons Drives Distinct Brain-wide Responses. Neuron 91, 412–424 (2016). [DOI] [PMC free article] [PubMed] [Google Scholar]
- 3.Lee JH et al. , Global and local fMRI signals driven by neurons defined optogenetically by type and wiring. Nature 465, 788–792 (2010). [DOI] [PMC free article] [PubMed] [Google Scholar]
- 4.Bernal-Casas D, Lee HJ, Weitz AJ, Lee JH, Studying Brain Circuit Function with Dynamic Causal Modeling for Optogenetic fMRI. Neuron 93, 522–532.e525 (2017). [DOI] [PMC free article] [PubMed] [Google Scholar]
- 5.Zhang F, Aravanis AM, Adamantidis A, de Lecea L, Deisseroth K, Circuit-breakers: optical technologies for probing neural signals and systems. Nat Rev Neurosci 8, 577–581 (2007). [DOI] [PubMed] [Google Scholar]
- 6.Aravanis AM et al. , An optical neural interface: in vivo control of rodent motor cortex with integrated fiberoptic and optogenetic technology. J Neural Eng 4, S143–156 (2007). [DOI] [PubMed] [Google Scholar]
- 7.Fang Z, Lee JH, High-throughput optogenetic functional magnetic resonance imaging with parallel computations. J Neurosci Methods 218, 184–195 (2013). [DOI] [PMC free article] [PubMed] [Google Scholar]
- 8.Fang Z, Le N, Choy M, Lee JH, High spatial resolution compressed sensing (HSPARSE) functional magnetic resonance imaging. Magn Reson Med In press, (2015). [DOI] [PMC free article] [PubMed] [Google Scholar]
- 9.Holland DJ et al. , Compressed Sensing Reconstruction Improves Sensitivity of Variable Density Spiral fMRI. Magnetic Resonance in Medicine 70, 1634–1643 (2013). [DOI] [PubMed] [Google Scholar]
- 10.Zong XP, Lee JY, Poplawsky AJ, Kim SG, Ye JC, Compressed sensing fMRI using gradient-recalled echo and EPI sequences. Neuroimage 92, 312–321 (2014). [DOI] [PMC free article] [PubMed] [Google Scholar]
- 11.Duffy BA, Choy M, Chuapoco MR, Madsen M, Lee JH, MRI compatible optrodes for simultaneous LFP and optogenetic fMRI investigation of seizure-like afterdischarges. Neuroimage, (2015). [DOI] [PMC free article] [PubMed] [Google Scholar]
- 12.Chuapoco MR et al. , Carbon monofilament electrodes for unit recording and functional MRI in same subjects. Neuroimage 186, 806–816 (2019). [DOI] [PMC free article] [PubMed] [Google Scholar]
- 13.Byers B et al. , Direct in vivo assessment of human stem cell graft-host neural circuits. Neuroimage 114, 328–337 (2015). [DOI] [PMC free article] [PubMed] [Google Scholar]
- 14.Liu J et al. , Frequency-selective control of cortical and subcortical networks by central thalamus. Elife 4, (2015). [DOI] [PMC free article] [PubMed] [Google Scholar]
- 15.Weitz AJ et al. , Optogenetic fMRI reveals distinct, frequency-dependent networks recruited by dorsal and intermediate hippocampus stimulations. Neuroimage 107, 229–241 (2015). [DOI] [PMC free article] [PubMed] [Google Scholar]
- 16.Liu J et al. , Frequency-selective control of cortical and subcortical networks by central thalamus. Elife 4, e09215 (2015). [DOI] [PMC free article] [PubMed] [Google Scholar]
- 17.Weitz AJ, Lee HJ, Choy M, Lee JH, Thalamic Input to Orbitofrontal Cortex Drives Brain-wide, Frequency-Dependent Inhibition Mediated by GABA and Zona Incerta. Neuron 104, 1153–1167 e1154 (2019). [DOI] [PMC free article] [PubMed] [Google Scholar]
- 18.Leong AT et al. , Long-range projections coordinate distributed brain-wide neural activity with a specific spatiotemporal profile. Proc Natl Acad Sci U S A 113, E8306–E8315 (2016). [DOI] [PMC free article] [PubMed] [Google Scholar]
- 19.Takata N et al. , Optogenetic activation of CA1 pyramidal neurons at the dorsal and ventral hippocampus evokes distinct brain-wide responses revealed by mouse fMRI. PLoS One 10, e0121417 (2015). [DOI] [PMC free article] [PubMed] [Google Scholar]
- 20.Jung WB, Jiang H, Lee S, Kim SG, Dissection of brain-wide resting-state and functional somatosensory circuits by fMRI with optogenetic silencing. Proc Natl Acad Sci U S A 119, (2022). [DOI] [PMC free article] [PubMed] [Google Scholar]
- 21.Choe KY, Sanchez CF, Harris NG, Otis TS, Mathews PJ, Optogenetic fMRI and electrophysiological identification of region-specific connectivity between the cerebellar cortex and forebrain. Neuroimage 173, 370–383 (2018). [DOI] [PMC free article] [PubMed] [Google Scholar]
- 22.Ferenczi EA et al. , Prefrontal cortical regulation of brainwide circuit dynamics and reward-related behavior. Science 351, aac9698 (2016). [DOI] [PMC free article] [PubMed] [Google Scholar]
- 23.Takata N et al. , Optogenetic astrocyte activation evokes BOLD fMRI response with oxygen consumption without neuronal activity modulation. Glia 66, 2013–2023 (2018). [DOI] [PubMed] [Google Scholar]
- 24.Gerits A et al. , Optogenetically induced behavioral and functional network changes in primates. Curr Biol 22, 1722–1726 (2012). [DOI] [PMC free article] [PubMed] [Google Scholar]
- 25.Duffy BA, Choy M, Lee JH, Predicting Successful Generation and Inhibition of Seizure-like Afterdischarges and Mapping Their Seizure Networks Using fMRI. Cell Rep 30, 2540–2554 e2544 (2020). [DOI] [PMC free article] [PubMed] [Google Scholar]
- 26.Choy M et al. , Repeated hippocampal seizures lead to brain-wide reorganization of circuits and seizure propagation pathways. Neuron 110, 221–236 e224 (2022). [DOI] [PMC free article] [PubMed] [Google Scholar]
- 27.Vahdat S et al. , Brain-wide neural dynamics of poststroke recovery induced by optogenetic stimulation. Sci Adv 7, (2021). [DOI] [PMC free article] [PubMed] [Google Scholar]
- 28.Crompe B et al. , The globus pallidus orchestrates abnormal network dynamics in a model of Parkinsonism. Nat Commun 11, 1570 (2020). [DOI] [PMC free article] [PubMed] [Google Scholar]
- 29.Kondabolu K et al. , Striatal cholinergic interneurons generate beta and gamma oscillations in the corticostriatal circuit and produce motor deficits. Proc Natl Acad Sci U S A 113, E3159–3168 (2016). [DOI] [PMC free article] [PubMed] [Google Scholar]
- 30.Yizhar O et al. , Neocortical excitation/inhibition balance in information processing and social dysfunction. Nature 477, 171–178 (2011). [DOI] [PMC free article] [PubMed] [Google Scholar]
- 31.Fang ZN, Le NV, Choy M, Lee JH, High Spatial Resolution Compressed Sensing (HSPARSE) Functional MRI. Magnetic Resonance in Medicine 76, 440–455 (2016). [DOI] [PMC free article] [PubMed] [Google Scholar]
- 32.Demas J et al. , High-speed, cortex-wide volumetric recording of neuroactivity at cellular resolution using light beads microscopy. Nature Methods 18, 1103-+ (2021). [DOI] [PMC free article] [PubMed] [Google Scholar]
- 33.Voleti V et al. , Real-time volumetric microscopy of in vivo dynamics and large-scale samples with SCAPE 2.0. Nature Methods 16, 1054-+ (2019). [DOI] [PMC free article] [PubMed] [Google Scholar]
- 34.Steinmetz NA et al. , Neuropixels 2.0: A miniaturized high-density probe for stable, long-term brain recordings. Science 372, (2021). [DOI] [PMC free article] [PubMed] [Google Scholar]
- 35.Hultman R et al. , Brain-wide Electrical Spatiotemporal Dynamics Encode Depression Vulnerability. Cell 173, 166–180 e114 (2018). [DOI] [PMC free article] [PubMed] [Google Scholar]
- 36.Lake EMR et al. , Simultaneous cortex-wide fluorescence Ca(2+) imaging and whole-brain fMRI. Nat Methods 17, 1262–1271 (2020). [DOI] [PMC free article] [PubMed] [Google Scholar]
- 37.Sporns O, Networks of the brain. (The MIT Press, Cambridge, Massachusetts ; London, England, ed. Paperback edition. 2016). [Google Scholar]
- 38.McIntosh AR, Towards a network theory of cognition. Neural Netw 13, 861–870 (2000). [DOI] [PubMed] [Google Scholar]
- 39.Wang XJ, Neurophysiological and Computational Principles of Cortical Rhythms in Cognition. Physiological Reviews 90, 1195–1268 (2010). [DOI] [PMC free article] [PubMed] [Google Scholar]
- 40.Deco G, Kringelbach ML, Great Expectations: Using Whole-Brain Computational Connectomics for Understanding Neuropsychiatric Disorders. Neuron 84, 892–905 (2014). [DOI] [PubMed] [Google Scholar]
- 41.Fornito A, Zalesky A, Breakspear M, The connectomics of brain disorders. Nat Rev Neurosci 16, 159–172 (2015). [DOI] [PubMed] [Google Scholar]
- 42.Tagamets MA, Horwitz B, Integrating electrophysiological and anatomical experimental data to create a large-scale model that simulates a delayed match-to-sample human brain imaging study. Cereb Cortex 8, 310–320 (1998). [DOI] [PubMed] [Google Scholar]
- 43.Stephan KE et al. , Nonlinear dynamic causal models for fMRI. Neuroimage 42, 649–662 (2008). [DOI] [PMC free article] [PubMed] [Google Scholar]
- 44.Kiebel SJ, David O, Friston KJ, Dynamic causal modelling of evoked responses in EEG/MEG with lead field parameterization. Neuroimage 30, 1273–1284 (2006). [DOI] [PubMed] [Google Scholar]
- 45.Albin RL, Young AB, Penney JB, The functional anatomy of basal ganglia disorders. Trends Neurosci 12, 366–375 (1989). [DOI] [PubMed] [Google Scholar]
- 46.DeLong MR, Primate models of movement disorders of basal ganglia origin. Trends Neurosci 13, 281–285 (1990). [DOI] [PubMed] [Google Scholar]
- 47.Parker JG et al. , Diametric neural ensemble dynamics in parkinsonian and dyskinetic states. Nature 557, 177–182 (2018). [DOI] [PMC free article] [PubMed] [Google Scholar]
- 48.Friston KJ, Harrison L, Penny W, Dynamic causal modelling. Neuroimage 19, 1273–1302 (2003). [DOI] [PubMed] [Google Scholar]
- 49.Friston KJ, Kahan J, Biswal B, Razi A, A DCM for resting state fMRI. Neuroimage 94, 396–407 (2014). [DOI] [PMC free article] [PubMed] [Google Scholar]
- 50.Stephan KE et al. , Ten simple rules for dynamic causal modeling. Neuroimage 49, 3099–3109 (2010). [DOI] [PMC free article] [PubMed] [Google Scholar]
- 51.Salvan P et al. , Frequency modulation of entorhinal cortex neuronal activity drives distinct frequency-dependent states of brain-wide dynamics. Cell Rep 37, 109954 (2021). [DOI] [PMC free article] [PubMed] [Google Scholar]
- 52.Ryali S et al. , Combining optogenetic stimulation and fMRI to validate a multivariate dynamical systems model for estimating causal brain interactions. Neuroimage 132, 398–405 (2016). [DOI] [PMC free article] [PubMed] [Google Scholar]
- 53.Grimm C et al. , Optogenetic activation of striatal D1R and D2R cells differentially engages downstream connected areas beyond the basal ganglia. Cell Rep 37, 110161 (2021). [DOI] [PubMed] [Google Scholar]
- 54.Kim J et al. , Inhibitory Basal Ganglia Inputs Induce Excitatory Motor Signals in the Thalamus. Neuron 95, 1181–1196 e1188 (2017). [DOI] [PubMed] [Google Scholar]
- 55.Schwab BC et al. , Neural activity during a simple reaching task in macaques is counter to gating and rebound in basal ganglia-thalamic communication. PLoS Biol 18, e3000829 (2020). [DOI] [PMC free article] [PubMed] [Google Scholar]
- 56.Goldberg JH, Farries MA, Fee MS, Basal ganglia output to the thalamus: still a paradox. Trends Neurosci 36, 695–705 (2013). [DOI] [PMC free article] [PubMed] [Google Scholar]
- 57.Deco G, Jirsa VK, Robinson PA, Breakspear M, Friston K, The dynamic brain: from spiking neurons to neural masses and cortical fields. PLoS Comput Biol 4, e1000092 (2008). [DOI] [PMC free article] [PubMed] [Google Scholar]
- 58.Schirner M, McIntosh AR, Jirsa V, Deco G, Ritter P, Inferring multi-scale neural mechanisms with brain network modelling. Elife 7, (2018). [DOI] [PMC free article] [PubMed] [Google Scholar]
- 59.Hjorth JJJ et al. , The microcircuits of striatum in silico. Proc Natl Acad Sci U S A 117, 9554–9565 (2020). [DOI] [PMC free article] [PubMed] [Google Scholar]
- 60.Zhang X, Santaniello S, Role of cerebellar GABAergic dysfunctions in the origins of essential tremor. Proc Natl Acad Sci U S A 116, 13592–13601 (2019). [DOI] [PMC free article] [PubMed] [Google Scholar]
- 61.Bezaire MJ, Raikov I, Burk K, Vyas D, Soltesz I, Interneuronal mechanisms of hippocampal theta oscillations in a full-scale model of the rodent CA1 circuit. Elife 5, (2016). [DOI] [PMC free article] [PubMed] [Google Scholar]
- 62.Kravitz AV et al. , Regulation of parkinsonian motor behaviours by optogenetic control of basal ganglia circuitry. Nature 466, 622–626 (2010). [DOI] [PMC free article] [PubMed] [Google Scholar]
- 63.Eskow Jaunarajs KL, Bonsi P, Chesselet MF, Standaert DG, Pisani A, Striatal cholinergic dysfunction as a unifying theme in the pathophysiology of dystonia. Prog Neurobiol 127–128, 91–107 (2015). [DOI] [PMC free article] [PubMed] [Google Scholar]
- 64.Sciamanna G et al. , Optogenetic Activation of Striatopallidal Neurons Reveals Altered HCN Gating in DYT1 Dystonia. Cell Rep 31, 107644 (2020). [DOI] [PubMed] [Google Scholar]
- 65.Meier JM et al. , Virtual deep brain stimulation: Multiscale co-simulation of a spiking basal ganglia model and a whole-brain mean-field model with the virtual brain. Exp Neurol, 114111 (2022). [DOI] [PubMed] [Google Scholar]
- 66.Neumann WJ et al. , Functional segregation of basal ganglia pathways in Parkinson’s disease. Brain 141, 2655–2669 (2018). [DOI] [PubMed] [Google Scholar]
- 67.Adam EM, Brown EN, Kopell N, McCarthy MM, Deep brain stimulation in the subthalamic nucleus for Parkinson’s disease can restore dynamics of striatal networks. Proc Natl Acad Sci U S A 119, e2120808119 (2022). [DOI] [PMC free article] [PubMed] [Google Scholar]
- 68.Valverde S et al. , Deep brain stimulation-guided optogenetic rescue of parkinsonian symptoms. Nat Commun 11, 2388 (2020). [DOI] [PMC free article] [PubMed] [Google Scholar]
- 69.Luk KC et al. , Pathological alpha-synuclein transmission initiates Parkinson-like neurodegeneration in nontransgenic mice. Science 338, 949–953 (2012). [DOI] [PMC free article] [PubMed] [Google Scholar]
- 70.Guo YJ, Xiong H, Chen K, Zou JJ, Lei P, Brain regions susceptible to alpha-synuclein spreading. Mol Psychiatry 27, 758–770 (2022). [DOI] [PubMed] [Google Scholar]
- 71.Henderson MX et al. , Spread of alpha-synuclein pathology through the brain connectome is modulated by selective vulnerability and predicted by network analysis. Nat Neurosci 22, 1248–1257 (2019). [DOI] [PMC free article] [PubMed] [Google Scholar]
- 72.Chung K, Deisseroth K, CLARITY for mapping the nervous system. Nat Methods 10, 508–513 (2013). [DOI] [PubMed] [Google Scholar]
- 73.Erturk A et al. , Three-dimensional imaging of solvent-cleared organs using 3DISCO. Nat Protoc 7, 1983–1995 (2012). [DOI] [PubMed] [Google Scholar]
- 74.Renier N et al. , iDISCO: a simple, rapid method to immunolabel large tissue samples for volume imaging. Cell 159, 896–910 (2014). [DOI] [PubMed] [Google Scholar]
- 75.Liebmann T et al. , Three-Dimensional Study of Alzheimer’s Disease Hallmarks Using the iDISCO Clearing Method. Cell Reports 16, 1138–1152 (2016). [DOI] [PMC free article] [PubMed] [Google Scholar]
- 76.Renier N et al. , Mapping of Brain Activity by Automated Volume Analysis of Immediate Early Genes. Cell 165, 1789–1802 (2016). [DOI] [PMC free article] [PubMed] [Google Scholar]
- 77.Oh SW et al. , A mesoscale connectome of the mouse brain. Nature 508, 207–214 (2014). [DOI] [PMC free article] [PubMed] [Google Scholar]
- 78.Lein ES et al. , Genome-wide atlas of gene expression in the adult mouse brain. Nature 445, 168–176 (2007). [DOI] [PubMed] [Google Scholar]
- 79.Kirst C et al. , Mapping the Fine-Scale Organization and Plasticity of the Brain Vasculature. Cell 180, 780–795 e725 (2020). [DOI] [PubMed] [Google Scholar]
- 80.Pandya S et al. , Predictive model of spread of Parkinson’s pathology using network diffusion. Neuroimage 192, 178–194 (2019). [DOI] [PMC free article] [PubMed] [Google Scholar]
- 81.Raj A, Kuceyeski A, Weiner M, A network diffusion model of disease progression in dementia. Neuron 73, 1204–1215 (2012). [DOI] [PMC free article] [PubMed] [Google Scholar]
- 82.Pandya S, Mezias C, Raj A, Predictive Model of Spread of Progressive Supranuclear Palsy Using Directional Network Diffusion. Frontiers in Neurology 8, (2017). [DOI] [PMC free article] [PubMed] [Google Scholar]
- 83.Bieri G et al. , LRRK2 modifies alpha-syn pathology and spread in mouse models and human neurons. Acta Neuropathol 137, 961–980 (2019). [DOI] [PMC free article] [PubMed] [Google Scholar]
- 84.Langston JW, The Parkinson’s complex: Parkinsonism is just the tip of the iceberg. Annals of Neurology 59, 591–596 (2006). [DOI] [PubMed] [Google Scholar]
Associated Data
This section collects any data citations, data availability statements, or supplementary materials included in this article.
Data Availability Statement
All data and materials necessary to understand and assess these conclusions are available in the manuscript.