

Abstract

The interaction of quantum-mechanical systems with a fluctuating thermal environment (bath) is fundamental to molecular mechanics and energy transport/dissipation. Its complete picture requires mode-specific measurements of this interaction and an understanding of its nature. Here, we present a combined experimental and theoretical study providing detailed insights into the coupling between a high-frequency vibrational two-level system and thermally excited terahertz modes. Experimentally, two-dimensional terahertz-infrared-visible spectroscopy reports directly on the coupling between quantum oscillators represented by CH3 streching vibrations in liquid dimethyl sulfoxide and distinct low-frequency modes. Theoretically, we present a mixed quantum-classical formalism of the sample response to enable the simultaneous quantum description of high-frequency oscillators and a classical description of the bath. We derive the strength and nature of interaction and find different coupling between CH3 stretch and low-frequency modes. This general approach enables quantitative and mode-specific analysis of coupled quantum and classical dynamics in complex chemical systems.
Open quantum systems, two-level systems continuously exchanging energy with their environment, are ubiquitous in chemistry, ranging from molecules in solution to molecules at surfaces and at confinement. In these systems, high-frequency electronic excitations or molecular vibrations with energy quanta well-above the thermal energy kBT, with kB the Boltzmann constant and T the temperature, are coupled to bath states in their environment. The latter are typically low-frequency intra- and intermolecular motions with energies comparable to kBT or smaller. Coupling to a bath is central to the evolution of quantum states giving rise to their energy fluctuations, dephasing, and thermalization. When there is also direct interaction between quantum systems, excitation transfer within quantum moiety is affected by bath dynamics, which causes fluctuations in their interaction strength.
Numerous theoretical approaches have been developed,1 in which the thermal bath is usually represented by its spectral density determined either phenomenologically2−4 or from numerical calculations.5,6 These considerations are typically based on significant approximations. Their benchmarking with detailed experimental data for real-world systems can help improve theories to the point that these could address cases relevant to chemistry.
Yet, experimental access to molecular open quantum systems is decidedly more challenging due to the limitations of techniques. Experimental access to the coupling is typically obtained indirectly using nonlinear spectroscopy, particularly transient absorption and two-dimensional electronic (2D ES) and infrared (2D IR) spectroscopies. These techniques can provide population relaxation and transfer rates, spatial reorientation, dephasing, and frequency fluctuations of a high-frequency quantum system.7−15 While insightful, such experiments are inherently limited concerning the details of the bath modes that shape the system dynamics, since there is intrinsically no mode specificity in the bath modes’ thermal excitation.
Detailed insights into the coupling between high-frequency quantum modes (HFMs) and low-frequency bath modes (LFMs) of molecular vibrations are enabled by the recently developed two-dimensional terahertz-infrared-visible (2D TIRV) spectroscopy.16,17 This technique allows for quantifying system-bath coupling strength in a mode-specific manner for both the LFM and HFM responses. However, deducing the characteristics of HFM-LFM coupling from 2D TIRV spectra requires rigorous simulations. Up to now, three different approaches have been reported in the literature for such simulations: using classical molecular dynamics (MD),4 ring-polymer MD (RPMD),18,19 and multimode Brownian oscillator (BO)4,20 models. MD has the advantage of explicitly considering intermolecular forces; thus, LFMs in this method have a clear physical origin. However, while classical approximation for low-frequency coordinates in MD calculations is reasonable, classical treatment of the quantum HFMs dynamics is a considerable simplification. RPMD accounts for quantum effects (proton delocalization) in the ground state of HFMs; however, its consideration of HFMs excitation remains essentially classical. In contrast, the BO model allows a quantum description of HFMs, but simplifies the bath degrees of freedom using a harmonic ansatz and postulating their static, homogeneous spectral density. An alternative approach, based on MD consideration of LFMs and quantum consideration of HFMs, can provide an understandable physical origin of their dynamics, allowing one to explicitly account for their microscopic inhomogeneity and correlations and thus improve accuracy and insights of the calculations.
A similar idea has been successfully used in computational absorption, Raman and 2DIR spectroscopies.21−23 In such a mixed quantum-classical formalism, the Hamiltonian of the quantum moiety depends parametrically on classical LFMs coordinates. The evolution of the latter is produced by (independently parametrized) MD simulation, which explicitly accounts for microscopic structural and dynamic inhomogeneity of the LFMs coordinates. Following these ideas, here we derive a quantum-classical sample response function measured with 2D TIRV spectroscopy. The obtained result is an analogue of the fully classical equilibrium-nonequilibrium formalism previously developed by Hasegawa and Tanimura.24
By combining this approach with state-of-the-art experimental data, we analyze a model molecular system, relatively simple CH3 stretch quantum oscillators in liquid dimethyl sulfoxide (DMSO). Studying coupling of a C–H stretch with bath degrees of freedom using conventional vibrational spectroscopy, e.g., spectral diffusion in 2D IR, is impeded by their typically close-to-homogeneous lineshapes. Symmetric and asymmetric CH3 stretching vibrations of DMSO molecules have frequencies of 2913 and 2996 cm–1, respectively (∼370 meV) (Figure 1c and Supporting Information Figure S1). We label these modes s and a, respectively. In the terahertz frequency range, DMSO shows sharp resonances at 333 and 383 cm–1 (∼45 meV) and a weak shoulder at 308 cm–1, which are assigned to intramolecular CH3–CH3 twist (v23), wagging (v11) and C–S–C bending (v12) vibrations, respectively.25−27 These modes are labeled by numbers 1, 2, and 3 (Figure 1c). We directly measure the coupling between CH3 stretch and terahertz modes of DMSO in a 2D TIRV experiment.
Figure 1.

(a) Scheme of a 2D TIRV spectroscopy experiment. Gray shadowed line schematically shows low-frequency vibration excited in a sample by THz pulse. (b) Energy-level diagram of a 2D TIRV excitation pathway. (c) First quadrant of absolute-value 2D TIRV spectrum of liquid DMSO. Blue and red lines on the sides show mid- and far-infrared absorption spectra, respectively. The 2D spectrum reveals coupling between the two high-frequency modes (a and s) and the four low-frequency modes (labeled 1, 2, 3, 4).
Details of the 2D TIRV spectroscopy and treatment of the signals can be found in ref (17) (see also Experimental Methods section). In brief, a femtosecond, broadband terahertz (THz) pulse (Figure 1a) coherently excites the low-frequency modes in the sample (Figure 1b). A subsequent femtosecond mid-infrared (IR) and picosecond (narrowband) visible (VIS) pulse pair interrogates the sample. Simply put, HFM-LFM coupling is a prerequisite for the VIS+IR+THz sum or VIS+IR–THz difference frequency generation. We spectrally resolve the interference of signal and local oscillator (LO) pulses at different time delays τ between the terahertz and IR/VIS pulses using a spectrometer and charge-coupled device (CCD) detector. The terahertz spectral response (ω1-frequency) is obtained by Fourier transform of this interference along the τ-axis. Spectral resolution along the infrared axis (ω2-frequency) is obtained by correcting the spectrometer frequency for the known VIS frequency. Time delay δ between signal and LO is used in data processing to separate signals produced by VIS+IR+THz and VIS+IR–THz excitation pathways.17
Figure 1c shows the first quadrant of the absolute-value 2D TIRV spectrum |ΓDMSO (ω2,ω1)| of neat liquid DMSO at 295 K. In the first quadrant, the signal originates from the sum-frequency mixing of the THz and IR fields. It contains pronounced peaks parallel to the ω1 axis at ω2 = 2913 and 2996 cm–1—frequencies of the CH3 stretching vibrations. This signal is broad over the ω1-frequency axis but contains sharp features around the ω1 frequencies of twist and wagging intramolecular motions. The shape of ΓDMSO is affected by the spectral intensities and phases of the employed laser pulses. To eliminate this and extract the sample response function S(3)DMSO (ω2,ω1), we use the 2D TIRV response of an ∼1 μm thick SiNx membrane as a reference, as described elsewhere.28Figure 2 shows real and imaginary parts of the complex-valued S(3)DMSO (ω2,ω1) in the first quadrant. This signal is generated by first and second interactions with THz and IR pulses, respectively.28 For each of the C–H stretching vibrational modes, the S(3)DMSO response contains three peaks at ω1 ≈ 300, 326, and 376 cm–1. They reflect coupling with the intramolecular LFMs, which are pronounced in the absorption spectrum (Figure 1c, Supporting Information Figure S1). An additional peak centered at ω1 ≈ 410 cm–1 reflects strong coupling with LFM having weak absorption and being obscured in the absorption spectrum. The lineshapes of the 2D TIRV peaks closely resemble those of coupled oscillators in 2D IR spectra.10,29
Figure 2.
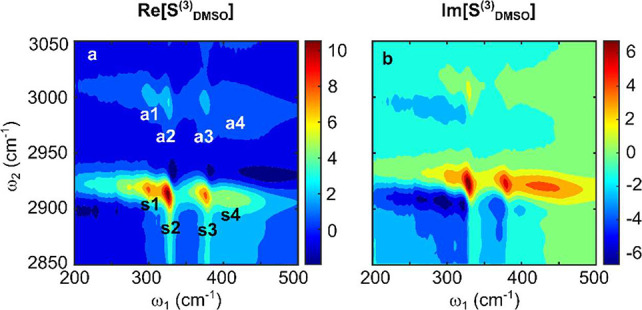
(a) Real and (b) imaginary part of the DMSO response function in the first quadrant measured by 2D TIRV spectroscopy. Peak labeling in (a) follows the notation in Figure 1c.
Obtaining quantitative insight into the interaction of CH3 stretch oscillators with their environment requires an accurate spectral analysis. The following equation gives the fully quantum 2D TIRV sample response function9,30−32
| 1 |
where |ρ(−∞)⟩⟩ is the equilibrium density operator and U is the time evolution superoperator of the whole system, Π is the polarizability operator, and M is the dipole moment superoperator defined by the commutator (M = [μ,...]) with conventional dipole moment operator μ. The energy-level spacing of the terahertz modes is only ≈1.5–2 times larger than the thermal energy at room temperature (∼207 cm–1). Therefore, with reasonable accuracy, their dynamics can be considered classically.33 To this end, we use a partial Wigner representation of eq 1 and take the classical limit for LFMs coordinates (details are provided in the Supporting Information). The total N low-frequency degrees of freedom are represented by classical coordinate Q and momentum P (Q = {Qi } and P = {Pi}, i = 1...N). The total K high-frequency degrees of freedom are represented by quantum operators of coordinate q̂ and momentum p̂ (q̂ = {q̂i} and p̂ = {p̂i}, i = 1...K). We use a common approximation and neglect the influence of (excited) quantum degrees of freedom on the motion of classical degrees of freedom.23,34,35 The obtained mixed quantum-classical representation of the response function is given by
 |
2 |
Here, kB, ℏ, and T are Boltzmann and reduced Planck constants and absolute temperature, respectively. The state of the classical subsystem is described by the probability density function f(Q,P,t), with f(Q,P,–∞) being an equilibrium distribution. The state of the quantum subsystem after photoexcitation by an IR field is described by the quantum density operator |f,g⟩⟩, where |g⟩ and |f⟩ are quantum ground and excited states, respectively. μcq0 (Q) is the classical dipole moment associated with low-frequency classical degrees of freedom Q and calculated at equilibrium position q0 of quantum degrees of freedom. In eq 2 we use time derivative μ̇cq0 taken at time –t1 –t2, when classical coordinates are Q(−t1 –t2). Excitation of quantum modes by an IR pulse is described by matrix element μqfg of quantum dipole moment operator μq (Q,P) associated with the quantum subsystem. This quantum operator parametrically depends on the classical coordinates Q and P. Matrix element of μq (Q,P) is calculated for states |f⟩ and |g⟩ at time –t2. Following photoexcitation, the evolution of the quantum subsystem for a time period t2 is given by the quantum superoperator Uq (Q,P,t2) acting on state |f,g⟩⟩. Operator Uq (Q,P,t2) depends explicitly on time t2 and parametrically on classical coordinates Q and P. Πq is the polarizability operator associated with the quantum subsystem, which depends parametrically on the classical coordinates Q and P.
In eq 2, the dependence of the transition dipole moment and polarizability operator on classical coordinates represents electrical coupling (anharmonicity) between HFMs and LFMs. Mechanical HFM-LFM coupling affects the evolution of quantum coherence |f,g⟩⟩ during the time period t2 and is embedded in the evolution superoperator Uq. Quantum evolution superoperator Uq (Q,P,t) is a solution to the quantum Liouville equation of motion.
| 3 |
Here Lq is the Liouville superoperator of only quantum degrees of freedom. The Liouville superoperator LqQ (Q,P) represents the interaction between quantum and classical coordinates—it acts on the state of the quantum subsystem and parametrically depends on classical coordinates. For the CH3 stretching vibrations of DMSO, we use the approximation of isolated resonances; i.e., we neglect intra- and intermolecular excitation transfer between them. In these limits, HFMs evolution reduces to the form36,37
| 4 |
where ωfg is the instantaneous frequency of mode |f⟩, and this frequency depends on classical coordinates Q. Response function can, thus, be written in the following form.
 |
5 |
Instantaneous frequency ωfg of the high-frequency coherence is affected by the interaction between the quantum system and the bath degrees of freedom. The latter is represented by two distinct types of modes. Bright modes with nonzero transition dipole moment interact with THz pulse and, thus, appear in the 2D TIRV spectrum explicitly at corresponding ω1-frequencies. Dark modes with zero transition dipole moments are not excited by the THz pulse and do not produce a signal. Still, they influence the spectrum by perturbing frequencies of HFMs and thus causing a broadening of spectral lines along the ω2-frequency axis.
Using eq 5, we simulate the response function of DMSO. To this end, we design a stochastic model by assigning an independent pair of high- and low-frequency modes for each resonance in the 2D spectrum. We label these pairs with indexes mn according to Figure 2a (m = s,a; n = 1,2,3,4). In this approximation, the LFM and HFM dynamics of all eight resonances are uncorrelated. Assuming small deviations Qn of bright LFMs from their equilibrium positions, we consider the Taylor series of the frequency ωmn (Q) of each CH3 mode up to the first-order term. In this approximation, ωmn is linearly proportional to the LFM coordinate.
| 6 |
Coefficients Cmn are the coupling strengths for each HFM-LFM pair (m, n). The frequency fluctuation term δωmn (t) represents the interaction of CH3 stretching vibrations with dark bath modes. Therefore, in our model, we explicitly account for the interaction between the quantum system and both bright and dark modes of environment.
In the experimental 2D TIRV spectrum of DMSO, the ω2-frequencies of the peaks match the frequencies of the CH3 stretching vibrations. Such signals are produced by a two-quantum transition upon interaction with the infrared laser pulse.17 In this case, the interaction with the visible pulse promotes a single-quantum transition and does not require any anharmonicity of the polarizability—i.e., we assume constant polarizability of CH3 stretching vibrations that equals its ensemble average value. We derive relative polarizabilities of symmetric and asymmetric modes from the Raman spectrum of DMSO (Figure S2 in Supporting Information). The integral Raman intensity of a mode is proportional to the square of its polarizability. Therefore, the polarizabilities of the two modes are ⟨⟨Πq (Q)|s,g⟩⟩ = 1 a.u. and ⟨⟨Πq (Q)|a,g⟩⟩ = 0.72 a.u. (here, a.u. stands for arbitrary units). The two-quantum transition upon infrared interaction requires mechanical anharmonicity and/or anharmonicity of the CH3 stretching transition dipole moment. We consider the response function S(3) (t2,t1) for these two extreme cases separately.
First, we consider the anharmonicity of the transition dipole moment. In this case, in eq 6, the coefficient Cmn =0. In the approximation of small deviation, the transition dipole moment μmn between the ground and first excited state of the mth CH3 stretch oscillator depends linearly on the low-frequency coordinates (Taylor series truncated at the first order term), so that
| 7 |
where μ0m is the transition dipole moment at the equilibrium position of Q, and the coefficients Bmn represent the strengths of HFM-LFM anharmonicity for each pair of vibrational modes. We derive μ0 of symmetric and asymmetric CH3 stretches from their integral intensities in the absorption spectrum. Assuming the transition dipole moment of symmetric stretch μ0s = 1 a.u., we obtain the relative transition dipole moment of asymmetric stretch μ0a=1.48 a.u. (see Supporting Information). We note that in the case of electrical coupling μ0m does not contribute to 2D TIRV signal generation. However, for the mechanical coupling considered below, the constant transition dipole influences the relative intensities of symmetric and asymmetric CH3 stretching vibrations.
The dipole moment of LFMs is linearly proportional to the coordinate Q for small deviations. Thus, the total dipole moment of low-frequency degrees of freedom is given by
| 8 |
Coefficients Zn represents the partial charges associated with the corresponding LFMs.
We use a harmonic model of the LFMs of DMSO because of their narrow line width and Lorentzian lineshapes. However, we emphasize that eqs 2 and 5 can be used for any kind of motion of a classical subsystem. We simulate trajectories of harmonic LFMs assuming an amplitude Q0n, a random initial phase φmn, and frequency fluctuation δΩmn (t) of each mode.
| 9 |
Thus, the time-dependent dipole moment of LFMs has the form
| 10 |
The product ZnQ0n is the transition dipole moment of a mode and can be obtained from the absorption spectrum (Supporting Information Figures S1 & S3). The integral absorbance of a vibration is proportional to (ZnQ0n)2. Assuming Z1Q01 = 1 a.u., relative transition dipoles are 3.69 and 3 a.u. for n = 2 and 3, respectively (see Supporting Information). For the mode n = 4, which is weak in the absorption spectrum, we assume a transition dipole moment of 1 a.u. In the Supporting Information, we demonstrate that this assumption is consistent with the linear absorption spectrum (Figure S4).
Realization of Q(t) and ωmn(t) generates a trajectory. To perform averaging over an ensemble of classical coordinates (∬dQdP...), we calculate the expression below the integral in eq 5 for time intervals of t1 = 0···3000 fs and t2 = 0···1500 fs in time steps of Δt = 15 fs for 2 × 10⁶ trajectories. To properly sample CH3 stretch oscillations, we decreased their frequency by 2912 cm–1. This offset is then added to the ω2-frequency produced in the calculation. At every time step, we assume a uniform probability distribution for frequency fluctuations δΩmn (t) and δωmn(t) and a phase change given by δΩmn (t)Δt and δωmn (t)Δt, respectively. Averaging the responses generated by the trajectories produces time-domain response function S(3) (t2,t1). The 2D spectrum is obtained by two-dimensional Fourier transformation of the calculated S(3) (t2,t1).
The simulated spectrum reproduces the experiment reasonably well (Figure 3a,b) with values of the parameters Bmn, Ωn, ωmn, and the range of frequency fluctuations δΩmn and δωmn listed in Table I (difference spectrum is shown in Figure S5 in Supporting Information). Still, there is a subtle but noticeable discrepancy in lineshapes, which is most pronounced in the upper part of the s3 resonance. In this spectral range of ω1 = 315–405 cm–1, ω2 = 2915–2947 cm–1 the slopes of contours are significantly different in both real and imaginary parts of the spectra (Figure S6 in Supporting Information).
Figure 3.

Comparison of theoretical and experimental spectra of DMSO. Colored contours show real (a, c) and imaginary (b, d) parts of the 2D TIRV spectrum calculated for the case of electrical (a, b) and mechanical (c, d) coupling. The corresponding color bars are shown on the right. Line contours show the real and imaginary parts of the measured spectrum. The corresponding grayscale bar is shown on the right. Note the better agreement with the mechanical anharmonicity model.
Table I. Parameters of the DMSO Model with Electrical/Mechanical HFM-LFM Coupling Shown in Figure 3a,b/c,d.
| mn | Ωn (cm–1) | δΩmn (cm–1) | ωmn (cm–1) | δωmn (cm–1) | Bmn (a.u.)/Cmn (cm–1/Q0n) |
|---|---|---|---|---|---|
| s1 | 300/300 | ±210/ ±195 | 2915/2918 | ±130/ ±130 | 26/109 |
| s2 | 326/326 | ±107/ ±107 | 2911/2912 | ±152/ ±152 | 2.7/21 |
| s3 | 372/375 | ±141/ ±141 | 2912/2913 | ±169/ ±104 | 3.8/20 |
| s4 | 406/412 | ±238/ ±271 | 2914/2916 | ±165/ ±54 | 30/178 |
| a1 | 300/300 | ±210/ ±195 | 3000/3000 | ±133/ ±173 | 4.9/51 |
| a2 | 326/326 | ±107/ ±107 | 2994/2994 | ±165/ ±228 | 1.3/10 |
| a3 | 372/375 | ±141/ ±141 | 2994/2995 | ±152/ ±184 | 1.2/9 |
| a4 | 406/412 | ±238/ ±271 | 2997/2998 | ±169/ ±141 | 17/122 |
In the second limit, we consider only the mechanical anharmonicity of the CH3 stretching vibrations. Similar to the first case, coupling with dark bath degrees of freedom causes the fluctuation δωmn(t) of the CH3 stretch frequencies. Besides that, mechanical coupling with bright LFMs produces additional perturbation of CH3 frequencies—i.e., in eq 6, coefficient Cmn ≠ 0.. Polarizabilities and transition dipole moments of CH3 modes are constant with the relative values discussed above (in eq 7, coefficient Bmn = 0).
Figure 3c,d shows excellent agreement between this model and the experiment (Figure S5 in Supporting Information shows the difference spectrum), with model parameters listed in Table I. The lineshapes match exceptionally well for both the real and imaginary parts of the response (see also Figure S6 in Supporting Information). Note that lineshapes produced by mechanical and electrical anharmonicities are qualitatively different, and this difference is rooted in the correlation of frequency fluctuations. In the computational model, HFMs and LFMs of DMSO are always broadened homogeneously, and their individual lineshapes are given by Lorentzian functions, in agreement with the absorption spectrum (Figure S3 in Supporting Information). With electrical HFM-LFM anharmonicity, the frequency fluctuations of CH3 stretching vibrations and bright LFMs are not correlated. In this case, a single resonance in the 2D TIRV spectrum has line shape symmetric with respect to its center (Figure 4a,b). This line shape is identical to that of a homogeneously broadened vibrational resonance with uncorrelated frequency fluctuations in 2D IR spectra.10,29 The lack of frequency fluctuation correlations results in a symmetric Lorentzian profile of a vertical cut taken through the resonance (Figure S7 in Supporting Information),10 at odds with the experimental line shape. In contrast, the correlation of frequency fluctuations produced by mechanical coupling causes asymmetry in the line shape of individual 2D TIRV peaks (Figure 4c,d, Figure S7 in Supporting Information). This results in an asymmetry in the overall spectrum in Figure 3 (see also Figure S6 in Supporting Information), in agreement with experimental line shape.
Figure 4.

Comparison of single resonance line shape in 2D TIRV spectrum calculated assuming electrical (a,b) and mechanical (c,d) anharmonicity.
The 2D TIRV spectra thus show that the interaction between CH3 stretching vibrations and intramolecular LFMs of DMSO is dominated by mechanical coupling. This is plausible because of the modulation of the CH3 frequency caused by molecule distortion upon low-frequency motions. The parameters in Table I indicate similar coupling strength with intramolecular twist and wagging vibrations and about five times stronger coupling with the C–S–C bending mode. The n = 4 mode is not pronounced in the absorption spectrum, which hinders the unambiguous quantification of its transition dipole moment. However, its intense signal in the 2D TIRV spectrum demonstrates a particularly strong coupling with the CH3 stretching vibrations. Notably, the coupling is about two times stronger for the symmetric than the asymmetric stretch mode of the CH3 group.
Our results demonstrate that for isolated vibrational quantum modes, such as the C–H stretch, their coupling to the bath can be derived from experimental data using eq 5 and a stochastic model. In a more detailed description, the time dependence of coordinates Q and P in eq 2 is given by the classical Hamilton’s equations of motion
| 11 |
where Hc(Q,P) is Hamiltonian of a classical subsystem. Thus, in an exact approach, Q(t) and P(t) can be obtained from equilibrium classical MD simulations. For a given trajectory of classical coordinates, one can use numerical integration of the Schrodinger equation (NISE)38,39 to calculate the evolution of the quantum subsystem during a time period t2 (given by Uq(Q,P,t2)|f,g⟩⟩ in eq 2). Averaging the term
calculated for multiple MD trajectories provides an ensemble average over classical coordinates, which is represented in eq 2 by integral ∬dQdP...f(Q,P,–∞). Such exact consideration of coupled quantum and classical dynamics can be particularly critical for systems with interacting quantum oscillators, like the O–H stretch in water and the C=O stretch in peptides—where the dependence of interaction strength on classical coordinates needs to be accounted for explicitly.
In summary, in this work, we use 2D TIRV spectroscopy experiments together with a novel quantum-classical description of sample response to directly measure and quantify the mode-specific coupling between quantum vibrational states and their classical environment. Using the example of CH3 stretching vibrations of liquid DMSO, we demonstrate that seemingly simple homogeneous energy broadening of a quantum oscillator can involve unequal interaction strengths with different thermally excited classical bath modes. The high quality of the experimental data and their excellent agreement with the theoretical model allow for determining a predominantly mechanical mechanism of HFM-LFM interaction; i.e., fluctuations of bath modes affect the potential of C–H covalent bonds. This coupling in the DMSO molecule can influence the reaction coordinate and facilitate intramolecular energy redistribution in several chemical reactions that involve breaking the C–H bonds. The developed quantum-classical description of sample response enables simultaneous explicit quantum consideration of high-frequency and classical consideration of thermally excited low-frequency vibrational dynamics. This formalism may especially benefit the investigation of excitonically delocalized quantum vibrations in molecular solids, liquids, and biomolecules, where inhomogeneity and correlations of quantum and classical subsystems can be critical.
Experimental Methods
We use a femtosecond amplified Ti:sapphire laser system (Astrella, Coherent) with a repetition rate of 1 kHz, central wavelength of 800 nm, and full width at half-maximum (fwhm) of ∼60 nm. The output of the laser is split into three beams to generate broad-band terahertz (THz), broad-band infrared (IR), and narrow-band visible (VIS) pulses. THz pulse is produced from a laser beam with an energy of about 1.1 mJ/pulse by two-color mixing in air plasma.40 IR pulse is produced using commercial TOPAS (traveling wave optical parametric amplification of superfluorescence) coupled to NDFG (noncollinear difference frequency generation) unit. The TOPAS is pumped by a laser beam with ≈1 mJ/pulse energy. The VIS pulse (fwhm ≈ 10 cm–1) is produced using a 4f pulse shaper from a laser beam with ≈0.8 mJ/pulse energy. The local oscillator (LO) pulse is generated in a displaced Sagnac interferometer by the sum frequency mixing of IR and VIS fields in a type 1 BBO crystal (10 μm thickness, Newlight Photonics Inc.). All of the pulses are focused and overlapped at the sample to generate the third-order signal. After the sample, the signal and LO are collimated and directed to a spectrometer (SpectraPro HRS-300, Princeton Instruments) equipped with an electron-multiplying charge-coupled device (EMCCD) detector (Newton 971, Andor). We use parallel polarization of THz, IR, VIS, and signal fields. Energies of IR and VIS pulses at the sample are about 1.5 and 4.5 μJ/pulse, respectively. More details on the experimental setup, methods of data acquisition, and processing are provided elsewhere.17
Time domain data are acquired by varying the time delay between THz and the IR/VIS pulse pair in steps of 10 fs using a motorized delay stage (V-551.2B, Physik Instrumente (PI)). The total time intervals of scans for DMSO and SiNx are 7.33 and 1.33 ps, respectively, with the same start position. It takes around 25 (5) min to acquire one spectrum of DMSO (SiNx).
The front window of the DMSO sample cell is a 50 nm thick low-stress SiNx membrane (NX5050A, Norcada) with 0.5 mm × 0.5 mm aperture (in 5 mm × 5 mm, 200 μm thick silicon frame). The back window is 2 mm thick CaF2 window. Front and back windows are separated by a 1 mm thick Viton O-ring.
Supporting Information Available
The Supporting Information is available free of charge at https://pubs.acs.org/doi/10.1021/acs.jpclett.3c01974.
Open access funded by Max Planck Society.
The authors declare no competing financial interest.
Supplementary Material
References
- Berkelbach T. C.; Thoss M. Special Topic on Dynamics of Open Quantum Systems. J. Chem. Phys. 2020, 152 (2), 20401. 10.1063/1.5142731. [DOI] [PubMed] [Google Scholar]
- Scott A. Davydov’s Soliton. Phys. Rep. 1992, 217 (1), 1–67. 10.1016/0370-1573(92)90093-F. [DOI] [Google Scholar]
- Tanimura Y. Numerically “Exact” Approach to Open Quantum Dynamics: The Hierarchical Equations of Motion (HEOM). J. Chem. Phys. 2020, 153 (2), 20901. 10.1063/5.0011599. [DOI] [PubMed] [Google Scholar]
- Ito H.; Tanimura Y. Simulating Two-Dimensional Infrared-Raman and Raman Spectroscopies for Intermolecular and Intramolecular Modes of Liquid Water. J. Chem. Phys. 2016, 144 (7), 74201. 10.1063/1.4941842. [DOI] [PubMed] [Google Scholar]
- Valleau S.; Eisfeld A.; Aspuru-Guzik A. On the Alternatives for Bath Correlators and Spectral Densities from Mixed Quantum-Classical Simulations. J. Chem. Phys. 2012, 137 (22), 224103. 10.1063/1.4769079. [DOI] [PubMed] [Google Scholar]
- Wang X.; Ritschel G.; Wüster S.; Eisfeld A. Open Quantum System Parameters for Light Harvesting Complexes from Molecular Dynamics. Phys. Chem. Chem. Phys. 2015, 17 (38), 25629–25641. 10.1039/C5CP03891J. [DOI] [PubMed] [Google Scholar]
- Tanimura Y.; Ishizaki A. Modeling, Calculating, and Analyzing Multidimensional Vibrational Spectroscopies. Acc. Chem. Res. 2009, 42 (9), 1270–1279. 10.1021/ar9000444. [DOI] [PubMed] [Google Scholar]
- Edler J.; Pfister R.; Pouthier V.; Falvo C.; Hamm P. Direct Observation of Self-Trapped Vibrational States in α-Helices. Phys. Rev. Lett. 2004, 93 (10), 1–4. 10.1103/PhysRevLett.93.106405. [DOI] [PubMed] [Google Scholar]
- Cho M.Two-Dimensional Optical Spectroscopy ;CRC Press: Boca Raton, FL, 2009. [Google Scholar]
- Hamm P.; Zanni M.. Concepts and Methods of 2D Infrared Spectroscopy ;Cambridge University Press: Cambridge, UK, 2011. [Google Scholar]
- Woutersen S.; Bakker H. J. Resonant Intermolecular Transfer of Vibrational Energy in Liquid Water. Nature 1999, 402 (6761), 507–509. 10.1038/990058. [DOI] [Google Scholar]
- Naraharisetty S. R. G.; Kasyanenko V. M.; Zimmermann J.; Thielges M. C.; Romesberg F. E.; Rubtsov I. V. C-D Modes of Deuterated Side Chain of Leucine as Structural Reporters via Dual-Frequency Two-Dimensional Infrared Spectroscopy. J. Phys. Chem. B 2009, 113 (14), 4940–4946. 10.1021/jp8112446. [DOI] [PubMed] [Google Scholar]
- Kurochkin D. V.; Naraharisetty S. R. G.; Rubtsov I. V. A Relaxation-Assisted 2D IR Spectroscopy Method. Proc. Natl. Acad. Sci. U. S. A. 2007, 104 (36), 14209–14214. 10.1073/pnas.0700560104. [DOI] [PMC free article] [PubMed] [Google Scholar]
- Ginsberg N. S.; Cheng Y.-C.; Fleming G. R. Two-Dimensional Electronic Spectroscopy of Molecular Aggregates. Acc. Chem. Res. 2009, 42 (9), 1352–1363. 10.1021/ar9001075. [DOI] [PubMed] [Google Scholar]
- Mehlenbacher R. D.; McDonough T. J.; Grechko M.; Wu M.-Y.; Arnold M. S.; Zanni M. T. Energy Transfer Pathways in Semiconducting Carbon Nanotubes Revealed Using Two-Dimensional White-Light Spectroscopy. Nat. Commun. 2015, 6 (1), 6732. 10.1038/ncomms7732. [DOI] [PubMed] [Google Scholar]
- Grechko M.; Hasegawa T.; D’Angelo F.; Ito H.; Turchinovich D.; Nagata Y.; Bonn M. Coupling between Intra-and Intermolecular Motions in Liquid Water Revealed by Two-Dimensional Terahertz-Infrared-Visible Spectroscopy. Nat. Commun. 2018, 9 (1), 885. 10.1038/s41467-018-03303-y. [DOI] [PMC free article] [PubMed] [Google Scholar]
- Vietze L.; Backus E. H. G.; Bonn M.; Grechko M. Distinguishing Different Excitation Pathways in Two-Dimensional Terahertz-Infrared-Visible Spectroscopy. J. Chem. Phys. 2021, 154 (17), 174201. 10.1063/5.0047918. [DOI] [PubMed] [Google Scholar]
- Begušić T.; Blake G. A. Two-Dimensional Infrared-Raman Spectroscopy as a Probe of Water’s Tetrahedrality. Nat. Commun. 2023, 14 (1), 1950. 10.1038/s41467-023-37667-7. [DOI] [PMC free article] [PubMed] [Google Scholar]
- Begušić T.; Tao X.; Blake G. A.; Miller T. F. Equilibrium-Nonequilibrium Ring-Polymer Molecular Dynamics for Nonlinear Spectroscopy. J. Chem. Phys. 2022, 156 (13), 131102. 10.1063/5.0087156. [DOI] [PubMed] [Google Scholar]
- Takahashi H.; Tanimura Y. Discretized Hierarchical Equations of Motion in Mixed Liouville-Wigner Space for Two-Dimensional Vibrational Spectroscopies of Liquid Water. J. Chem. Phys. 2023, 158 (4), 44115. 10.1063/5.0135725. [DOI] [PubMed] [Google Scholar]
- Auer B.; Kumar R.; Schmidt J. R.; Skinner J. L. Hydrogen Bonding and Raman, IR, and 2D-IR Spectroscopy of Dilute HOD in Liquid D2O. Proc. Natl. Acad. Sci. U. S. A. 2007, 104 (36), 14215–14220. 10.1073/pnas.0701482104. [DOI] [PMC free article] [PubMed] [Google Scholar]
- Corcelli S. A.; Lawrence C. P.; Skinner J. L. Combined Electronic Structure/Molecular Dynamics Approach for Ultrafast Infrared Spectroscopy of Dilute HOD in Liquid H 2O and D 2O. J. Chem. Phys. 2004, 120 (17), 8107–8117. 10.1063/1.1683072. [DOI] [PubMed] [Google Scholar]
- Jansen T. la C.; Saito S.; Jeon J.; Cho M. Theory of Coherent Two-Dimensional Vibrational Spectroscopy. J. Chem. Phys. 2019, 150 (10), 100901. 10.1063/1.5083966. [DOI] [PubMed] [Google Scholar]
- Hasegawa T.; Tanimura Y. Calculating Fifth-Order Raman Signals for Various Molecular Liquids by Equilibrium and Nonequilibrium Hybrid Molecular Dynamics Simulation Algorithms. J. Chem. Phys. 2006, 125 (7), 074512. 10.1063/1.2217947. [DOI] [PubMed] [Google Scholar]
- Hazra M. K.; Bagchi B. Collective Excitations in Liquid Dimethyl Sulfoxide (DMSO): FIR Spectrum, Low Frequency Vibrational Density of States, and Ultrafast Dipolar Solvation Dynamics. J. Chem. Phys. 2017, 146 (2), 024505. 10.1063/1.4973641. [DOI] [PubMed] [Google Scholar]
- Horrocks W. D.; Cotton F. A. Infrared and Raman Spectra and Normal Co-Ordinate Analysis of Dimethyl Sulfoxide and Dimethyl Sulfoxide-D6. Spectrochim. Acta 1961, 17 (2), 134–147. 10.1016/0371-1951(61)80059-3. [DOI] [Google Scholar]
- Wiewiór P. P.; Shirota H.; Castner E. W. Aqueous Dimethyl Sulfoxide Solutions: Inter- and Intra-Molecular Dynamics. J. Chem. Phys. 2002, 116 (11), 4643–4654. 10.1063/1.1449864. [DOI] [Google Scholar]
- Seliya P.; Bonn M.; Grechko M. Extracting the Sample Response Function from Experimental Two-Dimensional Terahertz-Infrared-Visible Spectra. J. Chem. Phys. 2023, 158 (13), 134201. 10.1063/5.0138442. [DOI] [PubMed] [Google Scholar]
- Khalil M.; Demirdöven N.; Tokmakoff A. Coherent 2D IR Spectroscopy: Molecular Structure and Dynamics in Solution. J. Phys. Chem. A 2003, 107 (27), 5258–5279. 10.1021/jp0219247. [DOI] [Google Scholar]
- Ito H.; Jo J.-Y.; Tanimura Y. Notes on Simulating Two-Dimensional Raman and Terahertz-Raman Signals with a Full Molecular Dynamics Simulation Approach. Struct. Dyn. 2015, 2 (5), 054102. 10.1063/1.4932597. [DOI] [PMC free article] [PubMed] [Google Scholar]
- Ikeda T.; Ito H.; Tanimura Y. Analysis of 2D THz-Raman Spectroscopy Using a Non-Markovian Brownian Oscillator Model with Nonlinear System-Bath Interactions. J. Chem. Phys. 2015, 142 (21), 212421. 10.1063/1.4917033. [DOI] [PubMed] [Google Scholar]
- Mukamel S.Principles of Nonlinear Optical Spectroscopy ;Oxford University Press: New York, 1995. [Google Scholar]
- Markland T. E.; Ceriotti M. Nuclear Quantum Effects Enter the Mainstream. Nat. Rev. Chem. 2018, 2 (3), 109. 10.1038/s41570-017-0109. [DOI] [Google Scholar]
- Torii H. Influence of Liquid Dynamics on the Band Broadening and Time Evolution of Vibrational Excitations for Delocalized Vibrational Modes in Liquids. J. Phys. Chem. A 2002, 106 (14), 3281–3286. 10.1021/jp011688k. [DOI] [Google Scholar]
- Hanna G.; Geva E. Computational Study of the One and Two Dimensional Infrared Spectra of a Vibrational Mode Strongly Coupled to Its Environment: Beyond the Cumulant and Condon Approximations. J. Phys. Chem. B 2008, 112 (41), 12991–13004. 10.1021/jp804120v. [DOI] [PubMed] [Google Scholar]
- Auer B. M.; Skinner J. L. IR and Raman Spectra of Liquid Water: Theory and Interpretation. J. Chem. Phys. 2008, 128 (22), 224511. 10.1063/1.2925258. [DOI] [PubMed] [Google Scholar]
- Auer B. M.; Skinner J. L. Dynamical Effects in Line Shapes for Coupled Chromophores: Time-Averaging Approximation. J. Chem. Phys. 2007, 127 (10), 104105. 10.1063/1.2766943. [DOI] [PubMed] [Google Scholar]
- Jansen T. L. C.; Knoester J. Waiting Time Dynamics in Two-Dimensional Infrared Spectroscopy. Acc. Chem. Res. 2009, 42 (9), 1405–1411. 10.1021/ar900025a. [DOI] [PubMed] [Google Scholar]
- Jansen T. L. C.; Auer B. M.; Yang M.; Skinner J. L. Two-Dimensional Infrared Spectroscopy and Ultrafast Anisotropy Decay of Water. J. Chem. Phys. 2010, 132 (22), 224503. 10.1063/1.3454733. [DOI] [PubMed] [Google Scholar]
- D’Angelo F.; Mics Z.; Bonn M.; Turchinovich D. Ultra-Broadband THz Time-Domain Spectroscopy of Common Polymers Using THz Air Photonics. Opt. Express 2014, 22 (10), 12475–12485. 10.1364/OE.22.012475. [DOI] [PubMed] [Google Scholar]
Associated Data
This section collects any data citations, data availability statements, or supplementary materials included in this article.