

Abstract
In the four decades since 1980, U.S. colleges and universities have seen the number of students from abroad quadruple. This rise in enrollment and degree attainment affects the global supply of highly educated workers, the flow of talent to the U.S. labor market, and the financing of U.S. higher education. Yet, the impacts are far from uniform, with significant differences evident by level of study and type of institution. The determinants of foreign flows to U.S. colleges and universities reflect both changes in student demand from abroad and the variation in market circumstances of colleges and universities, with visa policies serving a mediating role. The consequences of these market mechanisms impact global talent development, the resources of colleges and universities, and labor markets in the U.S. and countries sending students.
1. Introduction
“Internationalization” of post-secondary education and the flow of students across borders is not a new phenomenon in higher education. At some level, university learning has greatly facilitated the flow of individuals and knowledge for centuries. What is unprecedented is the scale of student flows and the magnitude of tuition revenues from foreign students across the globe as international student mobility has risen markedly in the past two decades. The number of students pursuing higher education degrees outside their home countries more than doubled between 2000 and 2017 to reach 5.3 million (UNESCO/UIS, 2018).
And for the U.S., which has a large number of colleges and universities and a disproportionate share of the most highly ranked colleges and universities in the world, total enrollment of foreign students increased by more than a factor of three between 1980 and 2017, from 305,000 to over a million students in 2017 (IPEDS Enrollment, 2018). As such, the flow of students from abroad has made higher education a major export sector of the U.S. economy, generating $42.4 billion in export revenue in 2017, with many analysts placing the overall economic activity generated by foreign students at a much greater level (Larmer, 2019).1 Yet, there is recent evidence that this trend is slowing dramatically, if not reversing.
The economic forces at work behind these trends are not hard to understand. Talented undergraduate and graduate students from abroad have engaged with educational and labor market opportunities that exist in the U.S. that did not exist in their home countries, which likely have more limited high-quality university options. In addition, for students, especially those in STEM fields, time spent studying in the U.S. has facilitated access to job opportunities, with the U.S. visa system structured to encourage this behavior. Unlike work visas, student visas are not subject to a cap and constitute an important pathway for the foreign-born to enter the U.S. labor market (Rosenzweig, 2006; Bound et al., 2014). The participation of students from abroad in U.S. higher education impacts the global production of skills and ultimately alters the allocation of university-educated workers to labor markets in the U.S. and abroad.
On the supply side of higher education, U.S. colleges and universities saw the opportunity to recruit talented students and, in some cases, generate revenue. Competition for talent and resources determines the level and distribution of enrollment at U.S. institutions from a range of countries. Here the distinction between doctorate education, where institutions often make net investments in students from abroad, and undergraduate or master’s programs, where foreign students are often revenue generating, serves as a key factor in explaining differential timing and source countries of foreign student flows.
Our objective in this paper is to present plausible explanations for these trends. Although it is not difficult to understand the basic economic forces at work, providing definitive quasi-experimental evidence for our claims typically may not be possible. The fact that a simple framework aligns with various empirical details strengthens our confidence in the validity of the explanations. Ultimately, we would like to evaluate counterfactuals, such as the following: how might a more restrictive immigration policy with respect to students and skilled workers have influenced the U.S. economy in general and the U.S. higher education system in particular? And in the future, if the flow of foreign students into our universities decreases either because of factors outside the direct control of U.S. policy (such as the COVID-19 pandemic) or because of changes in U.S. immigration policy, what would be the likely impact? Large policy changes affecting either student visas or work visas (e.g., tightening the cap on H-1Bs or providing green cards to PhDs) are likely to have substantial unintended effects, exacerbated by the feedback loop between the education and labor markets.
The framework we develop points to predictions about the direction and scope of likely impacts. First, given the formidable levels of tuition revenue generated by foreign students at the undergraduate and master’s levels, any reduction in the flow of foreign students would have a direct and negative impact on university resources that would not be easily offset by other sources of support, at least in the short term. And, while reductions in the flow of foreign students at the doctorate level would not tie to a direct reduction in resources, there would likely be sizable impacts on the quality and quantity of academic research that would not be offset in full by a growth in doctorate study among domestic students.
Foreign students who attend U.S. institutions are part of a global market for talent (Kerr, 2018). Even if there is some crowd out of U.S. natives, they are likely to expand the supply of skilled workers to the U.S. economy particularly in science and engineering fields, ultimately affecting productivity and innovation. U.S.-educated foreign students who return home (or migrate to other countries) also affect the global supply of educated workers, particularly in science and engineering fields.
The basic evidence of student flows to U.S. colleges and universities by degree level and type of institution and the visa policies which mediate these flows sets the stage for this analysis. We examine how factors driving the demand for higher education, reflecting socio-economic and demographic change abroad, and supply-side factors, reflecting the behavior of U.S. colleges and universities, impact these flows. The final section will explore the potential consequences of changes in foreign student flows for talent development and labor markets in the U.S. and abroad.
2. Trends in Higher Education Flows
The number of foreign students enrolled in U.S. universities at both the undergraduate and graduate levels has grown considerably over the last four decades, with total foreign enrollment rising from 305,000 in 1980 to over a million students in 2017 (IPEDS Enrollment, 2018). This represents a rise in foreign students as a share of total enrollment from 2.5 to 5.1 percent over this interval. Turning to degrees awarded by U.S. institutions, where distinctions by level of study are easier to observe, about 5 percent of all bachelor’s degrees (BAs) were awarded to international students in 2017–18, 18 percent of master’s degrees (MAs), and 13 percent of doctorate degrees (PhDs; Figure 1).
Figure 1—
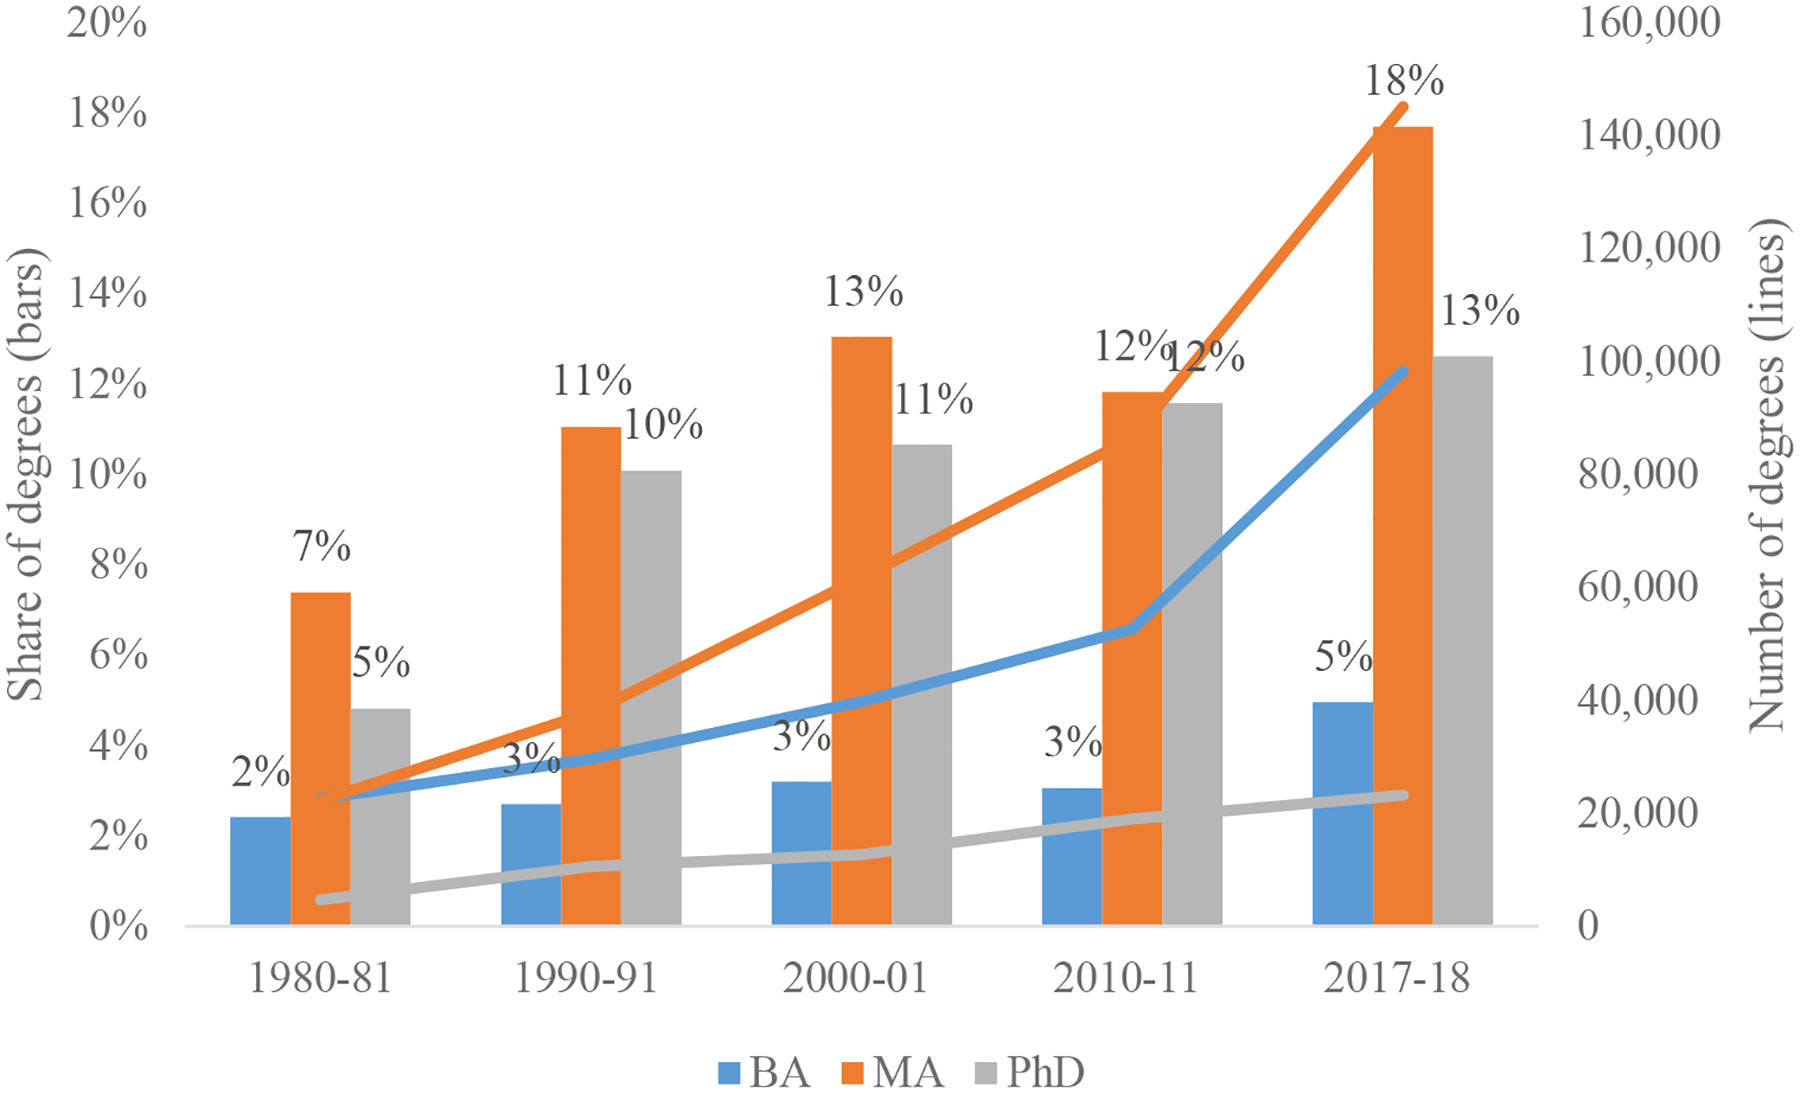
Total and Share of Non-Resident Degrees by Academic Level
Source: IPEDS Degrees Awarded (1980–2017). BA are all undergraduate degrees, MA are all master’s degrees, and PhD are all doctoral degrees granted to non-resident students. Left axis shows the share of total (resident plus non-resident) degrees, and right axis the number of degrees granted to non-residents.
The increase in demand for education from international students is not a uniquely U.S.-centric phenomena. In fact, colleges and universities in Australia, Canada, and the United Kingdom also experienced a rapid increase in the enrollment of students from China and India since 2000 (Table 1). Although the U.S. remains the largest destination country for students from these countries, the U.S. is no longer as dominant a player as it was 20 years ago. To illustrate, student flows from China to the U.S. were more than 10 times larger than the flows to Australia and Canada in 2000; by 2017, those ratios fell to 2.5 to 1 and 3.3 to 1, respectively. Yet, even as competition for international students has increased, the world market remains highly concentrated with only three countries (the U.S., U.K., and Australia) accounting for 34% of all student imports in 2017 and only eight countries accounting for 58% of net student inflows (UNESCO/UIS, 2018).2
Table 1—
International Students Enrolled in Post-Secondary Intuitions by Destination Country
| Panel A—Students from China | |||
|---|---|---|---|
| Year | 2000 | 2010 | 2017 |
| Australia | 5,008 | 87,588 | 128,498 |
| Canada | 4,701 | 26,298 | 66,161 |
| U.K. | 6,158 | 55,496 | 96,543 |
| U.S. | 50,281 | 126,498 | 321,625 |
| Panel B—Students from India | |||
| Year | 2000 | 2010 | 2017 |
| Australia | 4,578 | 20,429 | 51,976 |
| Canada | 969 | 5,868 | 32,616 |
| U.K. | 3,962 | 38,205 | 16,421 |
| U.S. | 39,084 | 103,968 | 142,618 |
| Panel C—Students from South Korea | |||
| Year | 2000 | 2010 | 2017 |
| Australia | 2,361 | 7,311 | 8,316 |
| Canada | 1,116 | 4,320 | 5,277 |
| U.K. | 2,165 | 4,347 | 5,157 |
| U.S. | 38,026 | 71,514 | 56,186 |
Notes: UNESCO/UIS, 2018. Numbers depict total number of international students enrolled across all degree statuses (undergraduate and graduate) in 2000, 2010, and 2017.
While undergraduate and graduate enrollment maintain broadly similar trajectories over the past 40 years (Figure 1), the underlying causes of enrollment growth are quite distinct, as we discuss below. In addition, over the past two decades, it is the rise in master’s-level enrollment that has generated the majority of the increase in graduate enrollment. While the number of doctorate degrees awarded to international students increased by 22% between 2010 and 2017 (from 18,965 to 23,199), the number of master’s degrees increased by 68% (from 163,827 to 184,074) over the same period.
Today, China is the largest source country for enrollment at both the undergraduate and graduate levels (Figure 2), with a substantial increase in Chinese enrollment since 2006. Other countries with substantial student flows include India, South Korea, and Saudi Arabia.3 In particular, the enrollment of Indian students is typically concentrated in master’s programs, with more than 90,000 Indian students enrolled in master’s programs in 2015.
Figure 2—
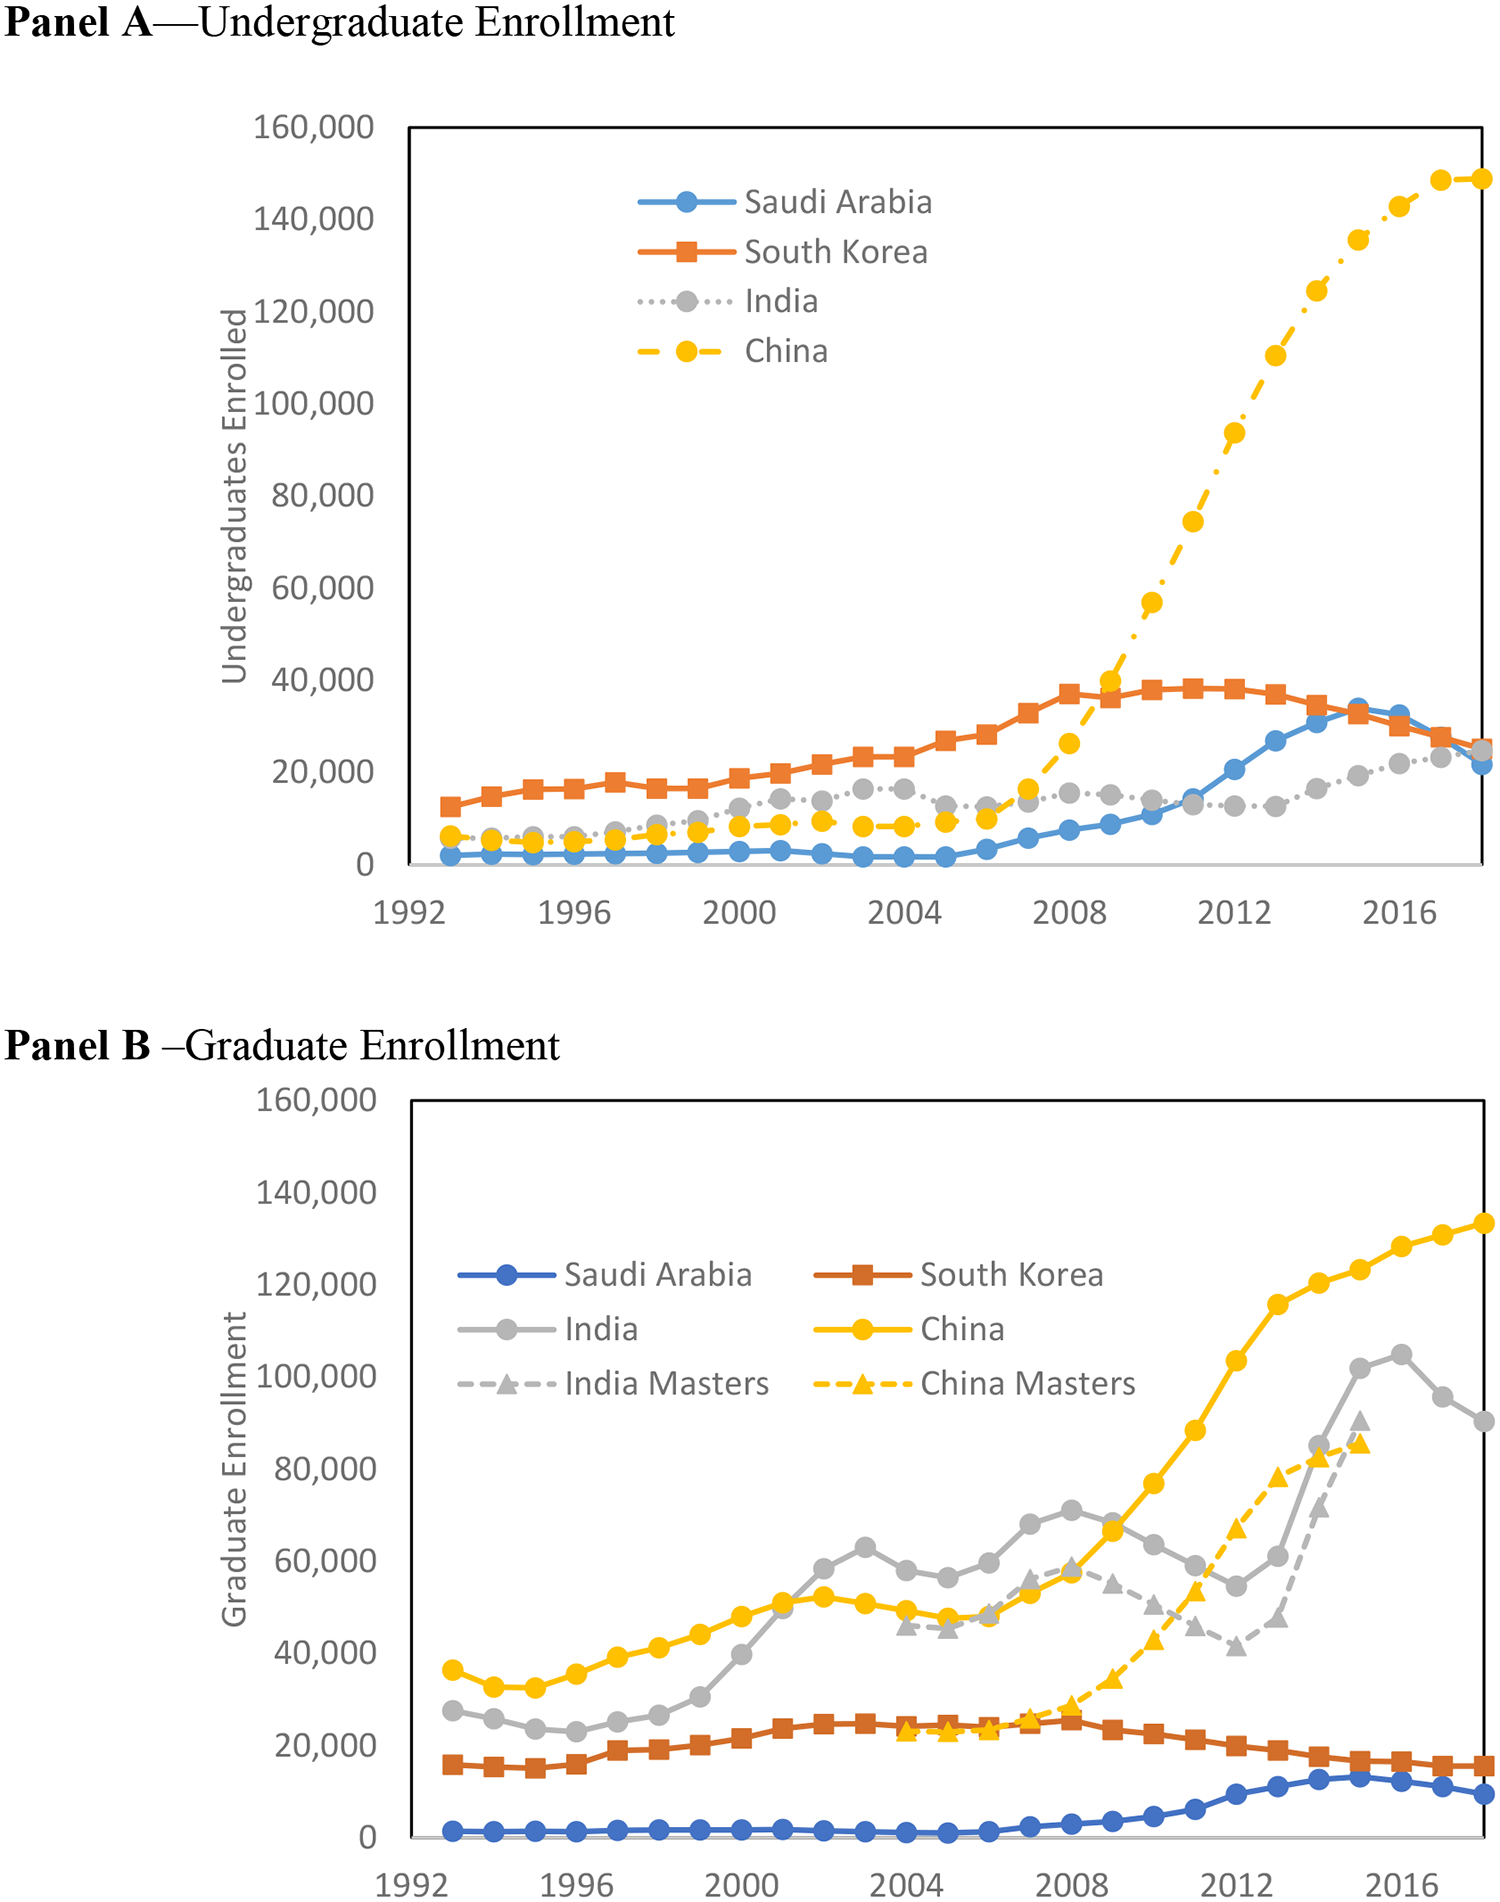
Foreign Enrollment at U.S. Higher Education Institutions by Source Country
Source: Open Doors 1993–2018 and F1 Data 2004–15. To construct the numbers for master’s degrees from China and India, we use the F1 administrative data on new visas granted by degree status and measure the share of graduate degrees allocated to master’s students. We apply that fraction to the number of graduate students enrolled to estimate the number of master’s students by country of origin.
The enrollment of international students varies considerably across post-secondary institutions (Figure 3). In the 21st century, foreign enrollment of undergraduate students is largely concentrated at public research universities, including large Midwestern institutions like the University of Illinois Urbana-Champaign and Purdue University, which are somewhat less selective than top private research universities. The concentration of international students at these public universities reflects their scale but also the fact that these universities have relied on tuition revenue from foreign students to cushion the effects of falling appropriations in the last decade (Bound et al. 2020). Still, the reliance of U.S. colleges and universities on tuition revenue from abroad is not a 21st century phenomenon. In the late 1970s, the exposure of many private colleges to risk of a foreign enrollment shock became evident when relations (and financial flows) with Iran soured, and some colleges and universities found themselves at financial risk when payments from Iran ceased (Hechinger, 1979).
Figure 3—
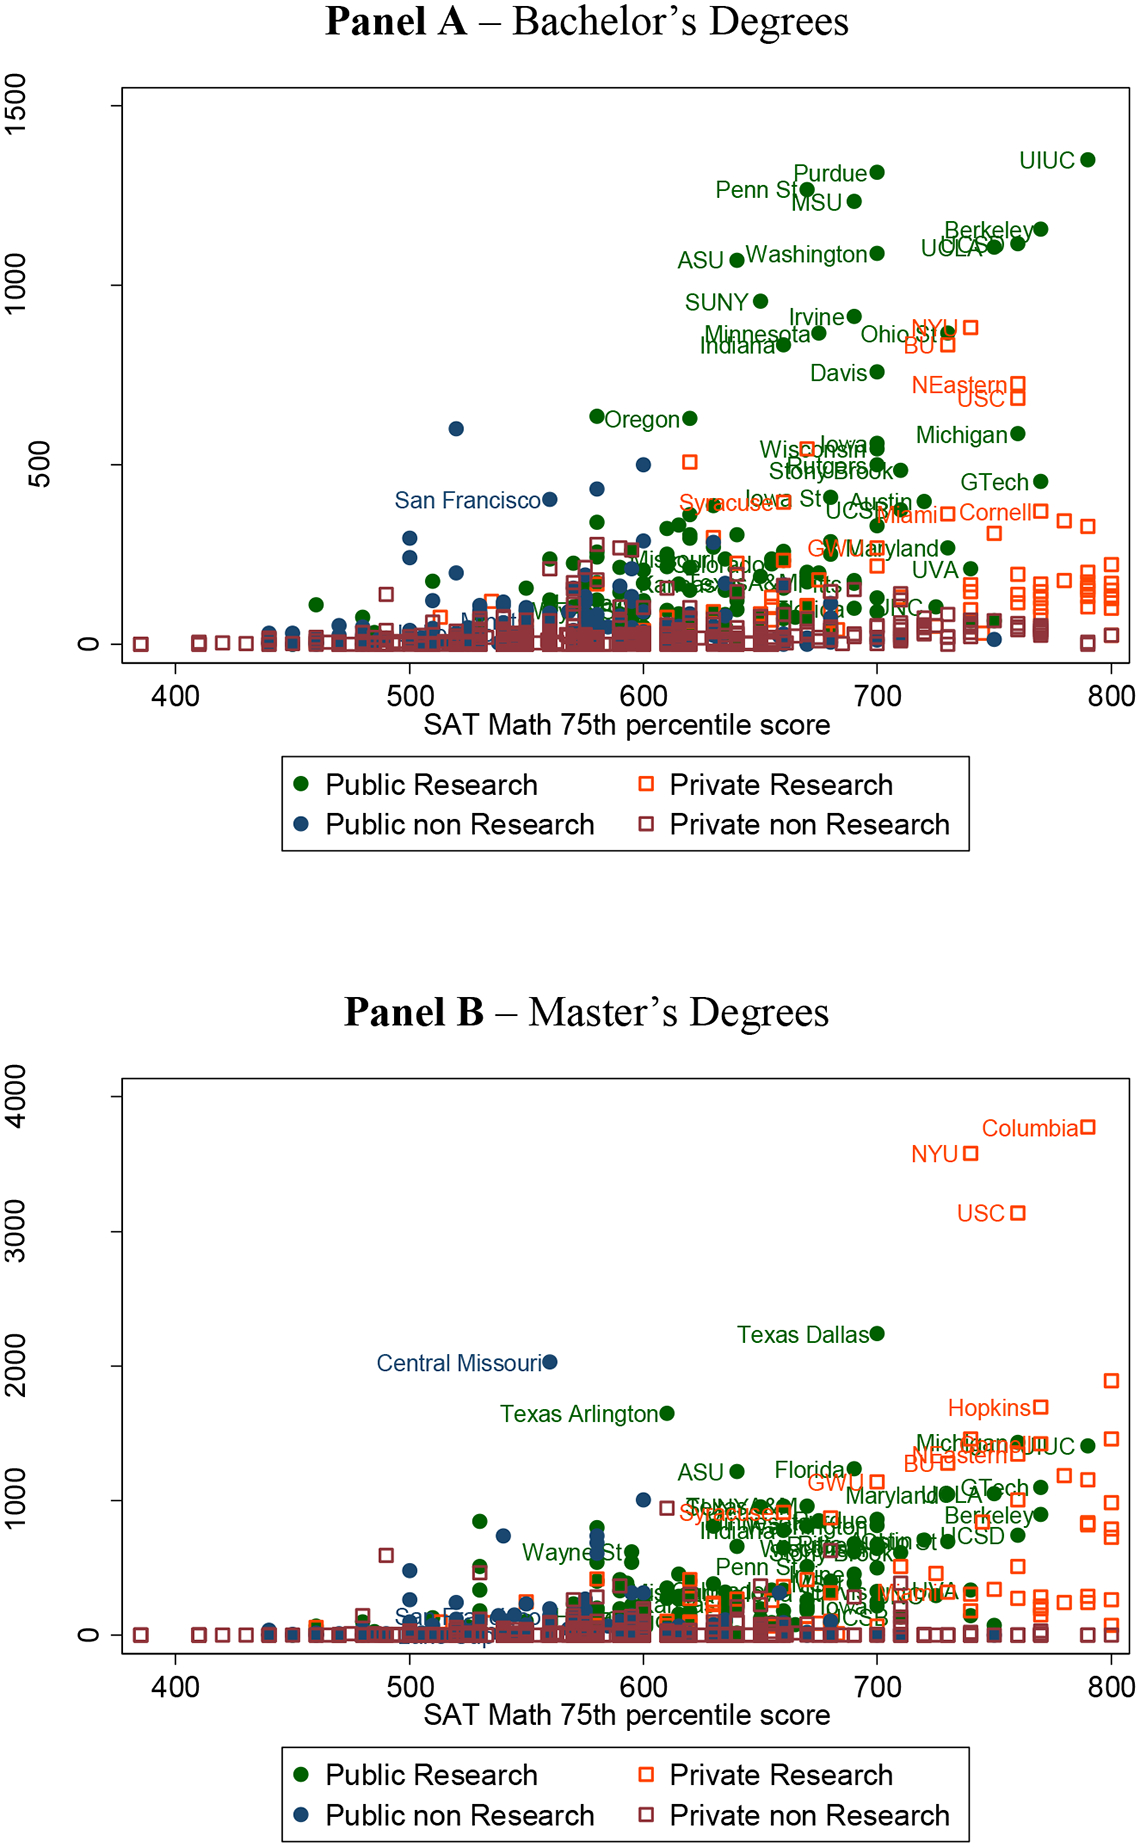
Degrees Awarded to Foreign Student by University in 2016
Source: IPEDS Degrees Awarded 2016. Horizontal axes plot the SAT Math 75th percentile of the incoming cohort as a measure of college selectivity. Research/non-research classifications based on the Carnegie Classifications 2015.
The enrollment of international master’s students is more difficult to characterize. For international students, incentives for pursuing an MA degree are diverse and include the desire to live in a major U.S. city like New York or Los Angeles, the acquisition of skills to better position them for employment or doctorate programs, or simply direct access to employment options in those areas where IT-related employment is expanding.4 It is also noticeable that some less selective public universities, such as the University of Central Missouri, have a high number of foreign MA level students. While lower prices than more highly ranked institutions may be part of these institutions’ attraction (Redden, 2017), it is also the case that many of these colleges actively pay foreign recruiters (Chen and Korn, 2015).5
International students represent a higher share of students in science, technology, engineering, and mathematics (STEM) programs than any other fields at the bachelor’s, master’s and PhD levels (Figure 4). In fact, about 17 percent of all BA degrees in mathematics were awarded to temporary residents in 2017. The concentration of international students in STEM master’s programs is even more remarkable, with foreign students receiving about 62 percent of all master’s degrees in computer science and 55 percent in engineering. Nonetheless, the representation of foreign students was higher in 2017 than 2002 in virtually all fields in both bachelor’s and master’s programs.
Figure 4—
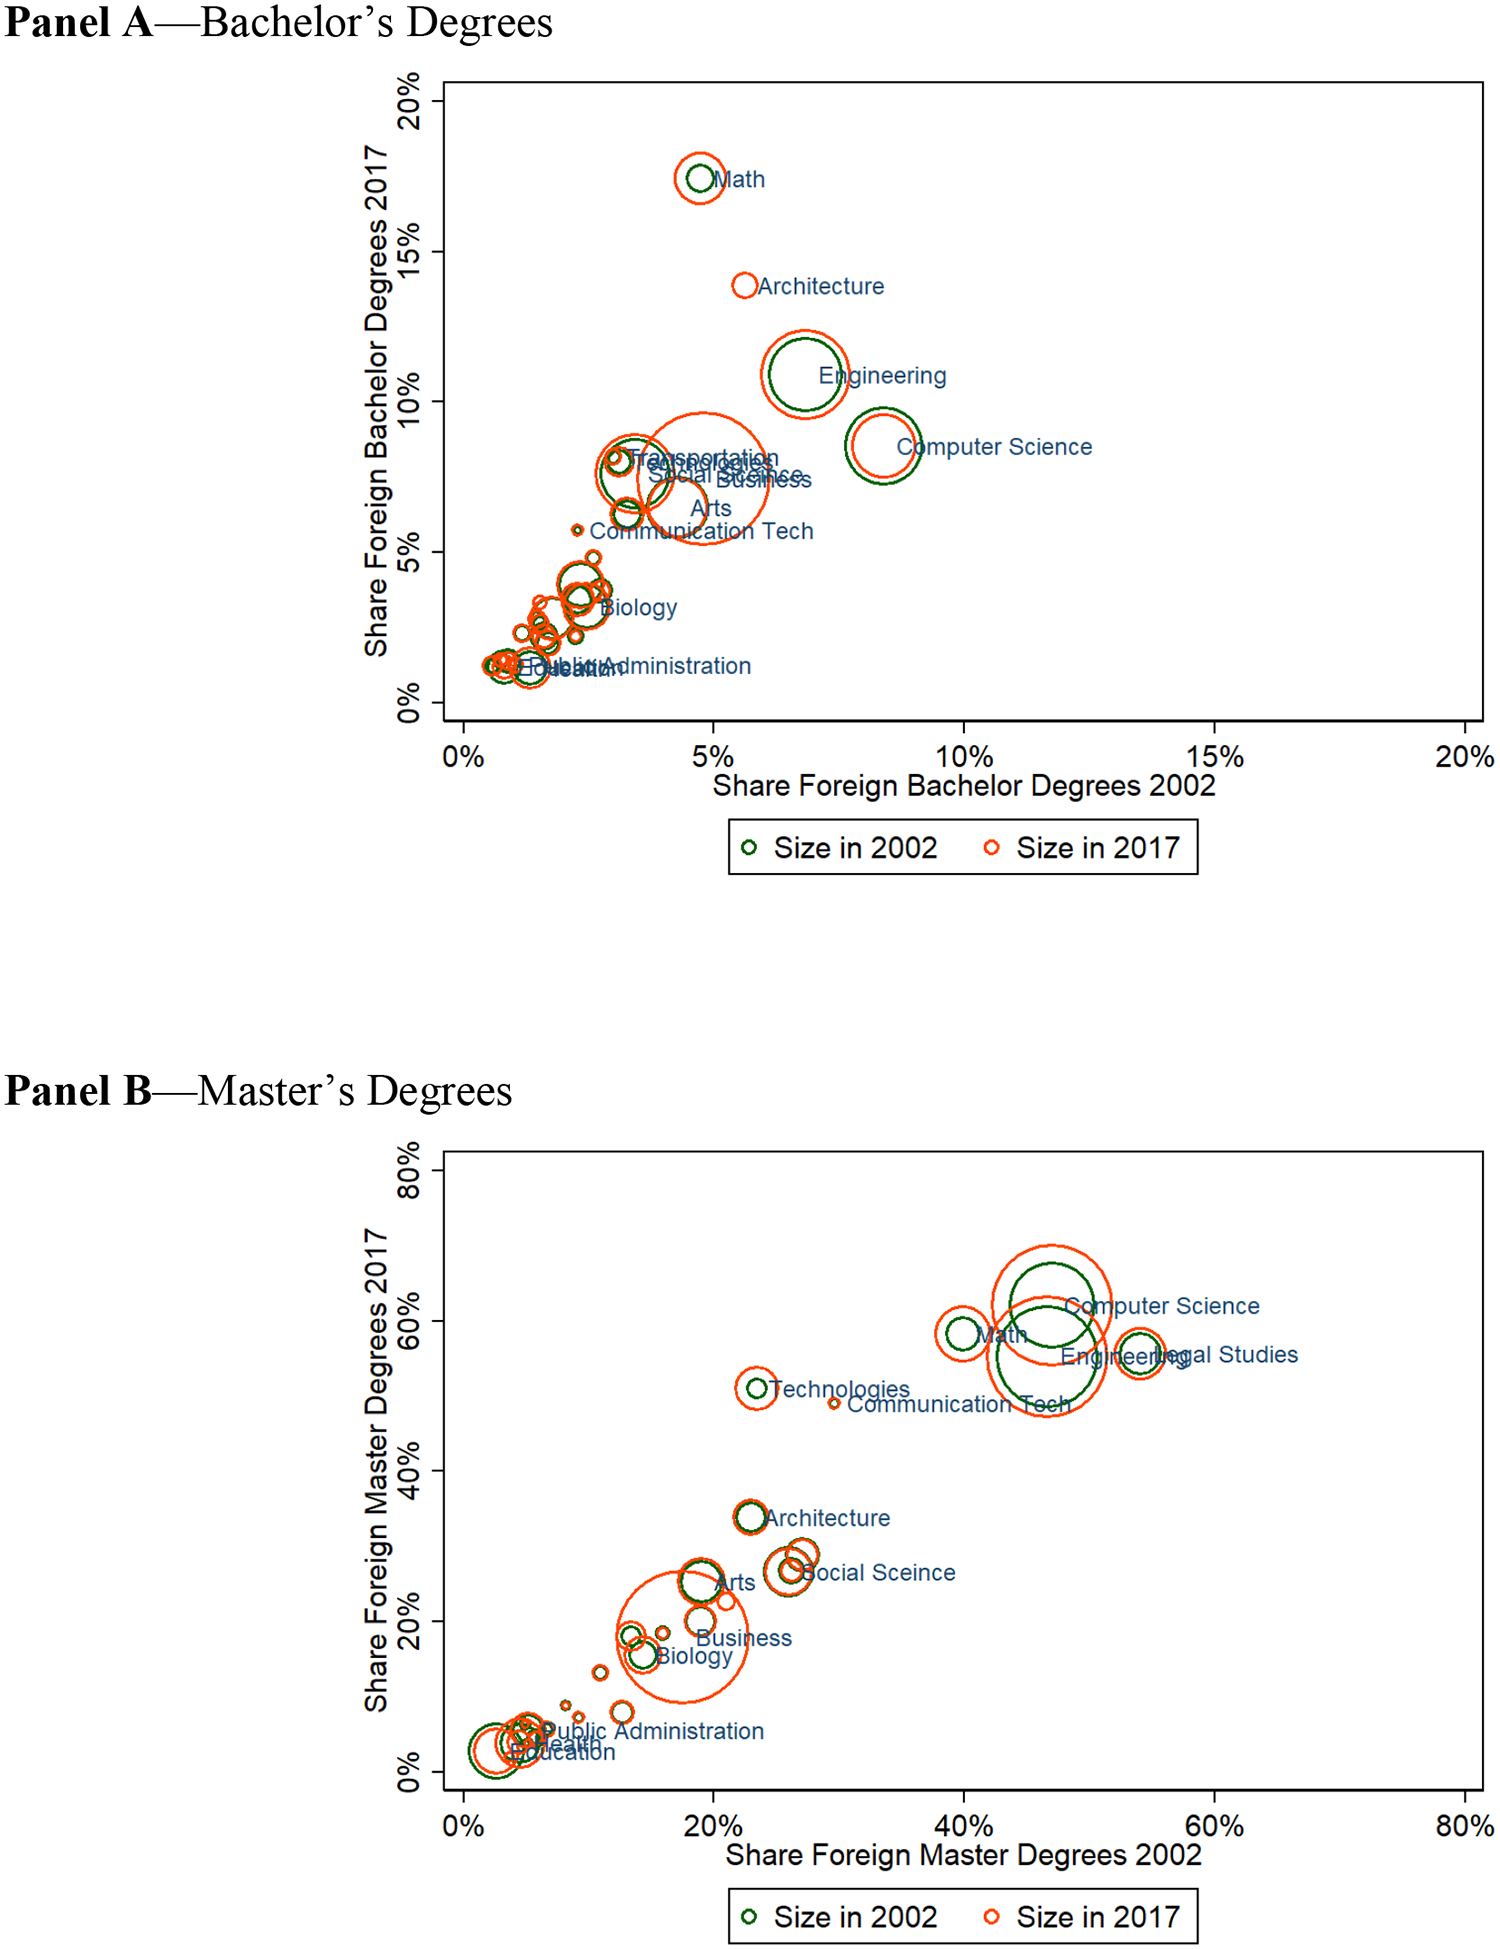
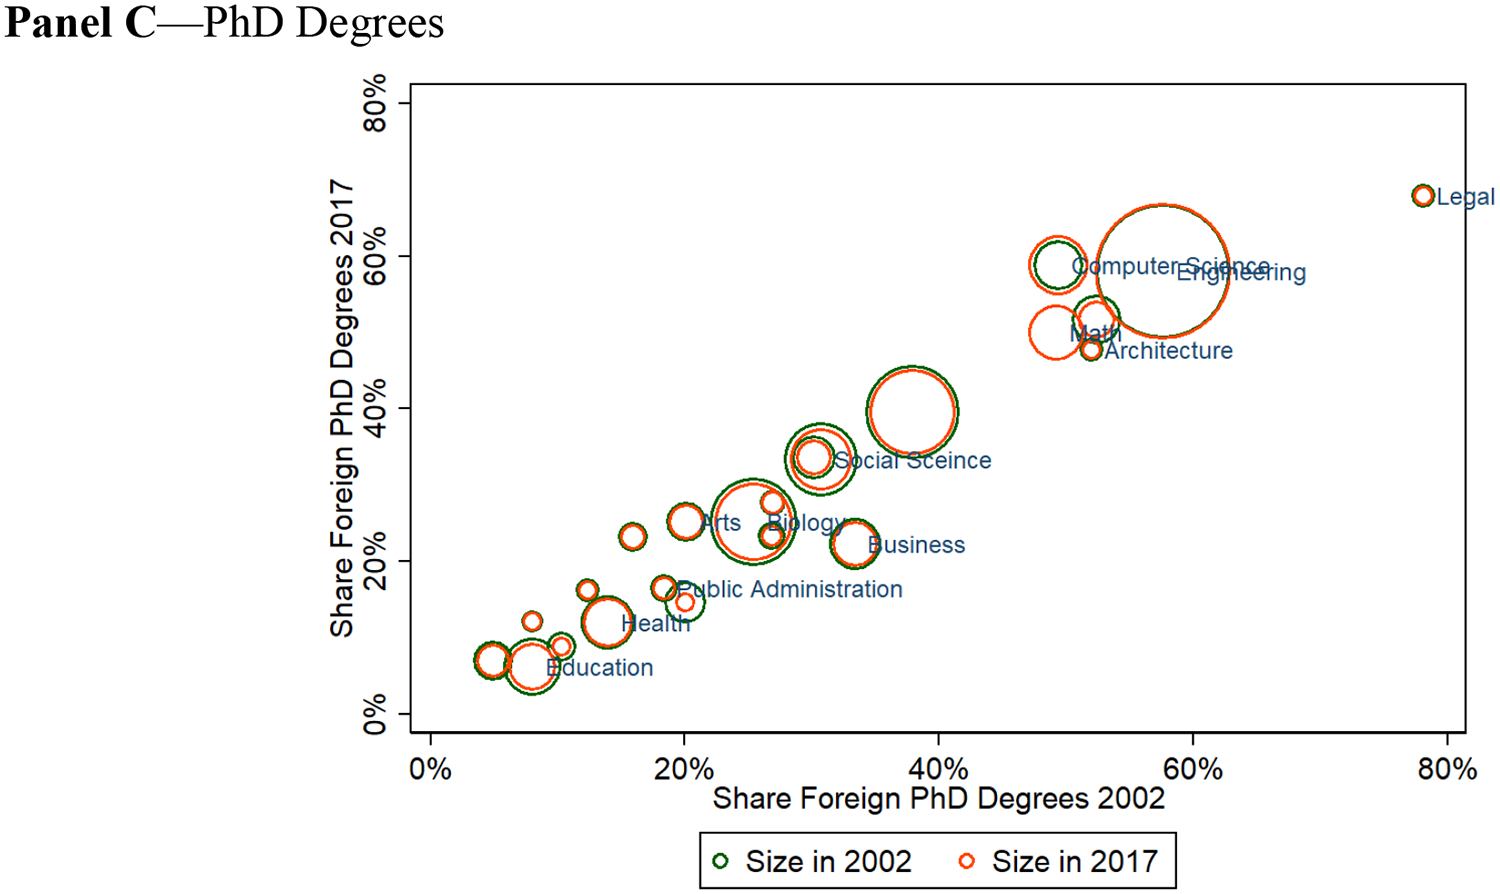
Share Degrees Awarded to Foreign Student by Field in 2002–17
Note: The size of each bubble is proportional to the number of foreign graduates in 2002 (green bubbles) and 2017 (orange bubbles). The location of each bubble (across axes) corresponds to share foreign born in 2002 (x-axis) and 2017 (y-axis). Sample is restricted to fields awarding more than 100 degrees to temporary residents in 2017. Source: IPEDS Degrees 2002–03 and 2017–18.
3. U.S. Visa Policy for Foreign Study in the U.S.
International students enter the U.S. on F, M, or J student non-immigrant visas, with the F-1 student visa being the primary mode for full-time foreign students. J-1 visas are for exchange students and researchers, while the less frequently used M-1 visa is for those attending vocational or technical education. F-1 students must first be accepted by any Student and Exchange Visitor Program (SEVP)-certified U.S. higher education institution, which provides the student with a certificate of eligibility for non-immigrant student status (I–20 form). The student pays a SEVIS fee to USCIS ($200 in 2020) and applies for a visa at a U.S. Embassy before entering the U.S. To maintain legal status, the student must maintain a full course load but can engage in part-time work at the college or university.
The term of the F visa can be extended beyond formal enrollment through participation in Optional Practical Training (OPT) that allows for temporary employment related to a student’s major area of study. One motivation for pursuing this course is that it provides an extended period in the U.S. to search for employment, outside the constraints of a numerical quota. In 2008, the duration of OPT was extended from 12 to 29 months for those in STEM fields; in 2016, this term was further extended to 36 months. A further administrative change extended the number of designated STEM programs from about 90 to nearly 400 in June 2012.
Student visas differ from work visas in that they are largely unconstrained in quantity. The primary work visa for those with a college degree is the H-1B, which requires that the employee be in a specialty occupation, defined as one that requires “theoretical and practical application of a body of highly specialized knowledge and attainment of a Bachelor’s or higher, or its equivalent.” H-1B visas require employer application and sponsorship and are subject to a binding cap (currently binding at 65,000 per year with some additional allowances).6 While binding in the private sector, higher education institutions, non-profit research organizations, and government agencies are exempt from the H-1B visa cap, providing an additional pathway to the labor market for F-1 students.
Figure 5, panel A presents the different types of high-skill visas and the transitions between them. Panel B shows the number of visas for each category issued between 1997 and 2018. It demonstrates the lack of numerical constraints on student visas—since the mid-2000s, student visas have increased sharply, even as the numbers dwarf the frequently debated H-1B visa program. Student visas are an important pathway into the U.S. labor market. Yet, as the figure shows, the transition rates from student visas to work visas have steadily declined over time, because even as student visas have increased, the number of new H-1B visas has stayed roughly constant.7
Figure 5—
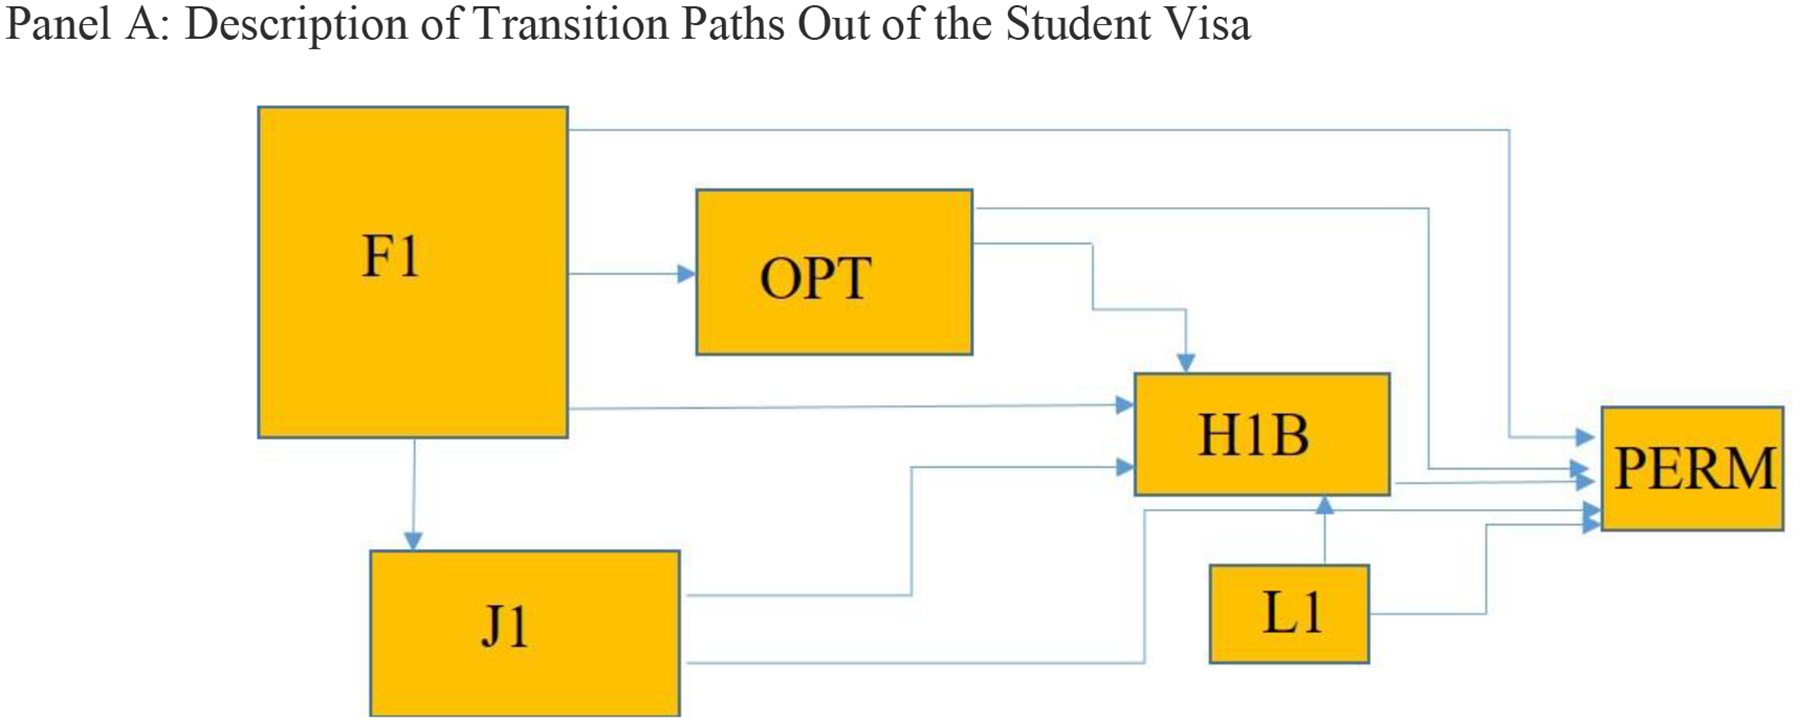
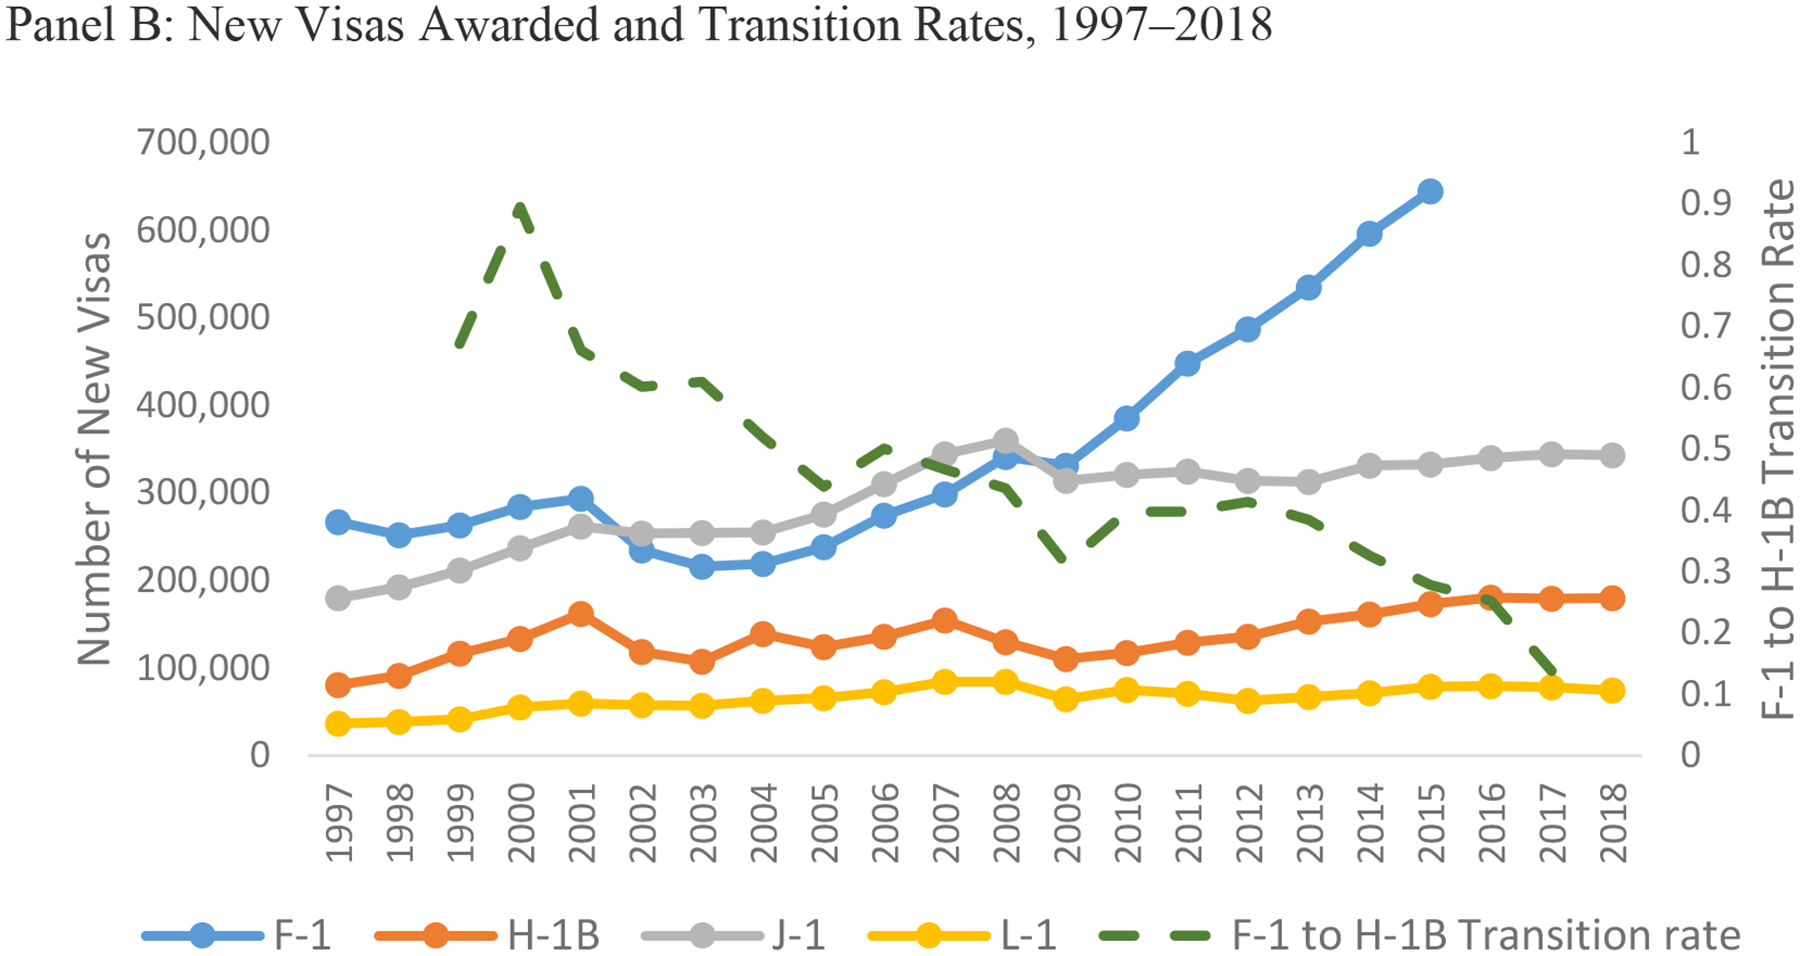
Transitions from Student to Work Visas
Notes: The diagram describes transition rates across types of visas. The F-1 visa is the student visa applicable to most students. The OPT is the Optional Practical Training that allows those on an F-1 visa to work for a U.S. based employer post graduation. The J-1 is the exchange researcher visa (also used by international medical graduates for medical residencies). The H-1B is the high-skill work visa. The L-1 is a high-skill visa for intra-firm executive transfers. PERM are applications for immigration status (green cards). The sizes of the boxes crudely, but not accurately, depict the size of the visas granted..
Source: Department of State (1997–2015F-1 visas are issues to full-time students at certified U.S. universities. The J-1 visa is for exchange students, researchers, and physicians undergoing training. The L-1 visa is for intra-company transfers of executives and managers. The H-1B visa is for high-skill workers in specialty occupations. The right-axis measures the green dotted line, where we use USCIS data to estimate the fraction of F-1 visas that converted to a (new, initial employment) H-1B visa each year. For the transition rates we use the 2000–18 Characteristics of H-1B Specialty Workers Reports of the USCIS, and 1999–2018 Completion Surveys by Race of the Integrated Post-Secondary Data System. The ratio of initial H-1B petitions processed to aliens in the U.S. to the number of foreign graduates of U.S. universities in that class of graduation is an approximation of the transition rate from F visas to H-1B for each year of graduation. We omit the F1 visa data after 2015 because of the change of visa regime in visa renewals for Chinese students.
After graduating from U.S. institutions, foreign students have three primary options.8 First, they may enroll in a different degree program, with a new F-visa, such as when continuing from a bachelor’s to a master’s program, or from a master’s to a PhD program. Second, they may start working for a U.S. employer either through an OPT extension on the same F-visa or through a work visa, such as an H-1B. Or third, they must leave the country.
Since student visas are an important stepping stone for participating in the U.S. labor market, changes to visa policy and the availability of H-1B opportunities impact decisions to study in the U.S. (Kato and Sparber, 2013). Indeed, recent policy adjustments, such as the extension of the OPT period for F-1 degree recipients in STEM fields and a rulemaking change favoring U.S. advanced degree recipients in the allocation of H-1B visas, potentially impact both foreign educational investments and persistence in the U.S. labor market (Radnofsky, 2019, and Amuedo-Dorantes, Furtado and Xu, 2019).
4. The Demand for U.S. Education from Abroad
Demand for admission to U.S. degree programs depends importantly on the individual’s alternative options in their home country and, increasingly, in other countries. Because post-secondary options in the U.S. depend on academic qualifications, as well as capacity to pay, changes in educational attainment and personal incomes in developing countries have been a major driver in the overall growth in demand.
The growth in both secondary and post-secondary educational attainment over the last 20 years in a number of developing countries is remarkable. China experienced a 15 million increase in the number students enrolled in secondary education between 1997 and 2017 (from about 68 million students) and a 38 million increase in students enrolled in post-secondary education (from about 6 million) during the same period (UNESCO/UIS, 2018). In 2017, India had 61 million more students enrolled in secondary education and 27 million more students enrolled in a post-secondary education than in 1997. The growth in educational attainment reflects the increase in human capital investments made by both countries over the past few decades.
Over the past 20 years, a substantial number of families in developing countries have also experienced increasing income levels, which provide them with the capacity to pay for U.S. higher education (Bird and Turner, 2014). For instance, Bound et al. (2020) estimate that the fraction of Chinese families with incomes greater than the average amount charged by U.S. public universities for out-of-state tuition and room and board grew from 0.005 percent in the year 2000 to more than 2 percent by 2013. Because foreign doctoral students commonly receive full support in the form of fellowships and teaching assistantships, their enrollment is often less sensitive to home country income. Indeed, Bound, Turner, and Walsh (2009) show that for countries like China and South Korea, enrollment in doctorate programs often increased before the growth in enrollment in programs charging tuition.
That home-country income-driven growth is a major driver of international student flows is supported by Table 1. If the increased supply of U.S. higher education was the only factor driving these trends, we would not expect to see rapid growth in international enrollment at universities in Australia, Canada, and the U.K. This growth in the ability of Chinese families to pay for a U.S. education in the first part of the 21st century allowed U.S. universities to enroll increasing numbers of qualified full-fare paying students from abroad, particularly at the undergraduate and master’s levels.
Khanna et al. (2020) show how trade-induced income growth in Chinese cities was strongly associated with the outflow of international students to U.S. universities from these cities. Rather than staying on in their locally booming economies, Chinese families used their new trade-liberalization driven wealth to send students abroad. As such, the U.S.’s goods-deficit with China, partially cycled back as an export surplus in higher education services, outside the doctorate level.
Foreign enrollment demand at U.S. colleges and universities often reflects the limited quantity and quality of home country options. At the doctorate level, the U.S. has a clear absolute advantage in program offerings in many fields. Overall, U.S. universities represent 32 of the 50 most highly ranked universities in the world (Shanghai Ranking 2018). At the undergraduate level, enrollment demand reflects the presence of types of programs rarely available in other countries such as liberal arts colleges and other broad-based programs of study, along with a greater supply of selective and resource-intensive options. Indeed, both China and India have highly competitive elite universities, but seats are so scarce at these institutions that admission to top-ranked U.S. colleges may be no more difficult.9
Changes in demand generated by increased undergraduate degree attainment abroad and political shocks are also important factors explaining the dramatic growth in foreign enrollment in U.S. PhD programs (Bound, Turner, and Walsh 2009). The expansion of undergraduate degree attainment in countries with relatively modest university systems typically translates to increases in demand for doctorate education from U.S. institutions. In the same way, PhD enrollment of students from countries like India, South Korea, and Taiwan has tended to fall as the research capacities of universities in these countries expands (Blanchard, Bound and Turner, 2009).
Beyond (potential) access to post-secondary options unavailable in their home countries, obtaining a U.S. degree provides the advantage of potentially easier access to U.S. employment options (Rosenzweig, 2006; Bound et al., 2014). Because most students graduating from a U.S. university are eligible for an extension of their visas with the pursuit of OPT, they are able to gain employment in the U.S. labor market without needing an H-1B visa in the supply-constrained lottery. In addition, obtaining a degree from a U.S. college or university provides advantages for foreign students searching for jobs over those educated abroad, to the extent that U.S. employers have more information on skills acquired at familiar educational institutions, and employers might find it more straightforward to interview candidates on site.10
In turn, as the option value to pursuing employment in the U.S. changes, we would expect enrollment demand from abroad to adjust. Using the number of GRE takers as a measure of students’ willingness to come to the U.S. for graduate education, Figure 6 shows that for most of the past two decades, the demand from Indian students for a U.S. education is higher when unemployment rates in the U.S are low. Nonetheless, there is a significant drop in the number of Indians taking the GRE since 2016, a period of relative prosperity in U.S. history. One potential explanation for this trend is the shift in perception of the willingness of the U.S. to welcome immigrants after the 2016 election, which makes the U.S. less attractive to international students (Anderson and Svrluga, 2018).
Figure 6—
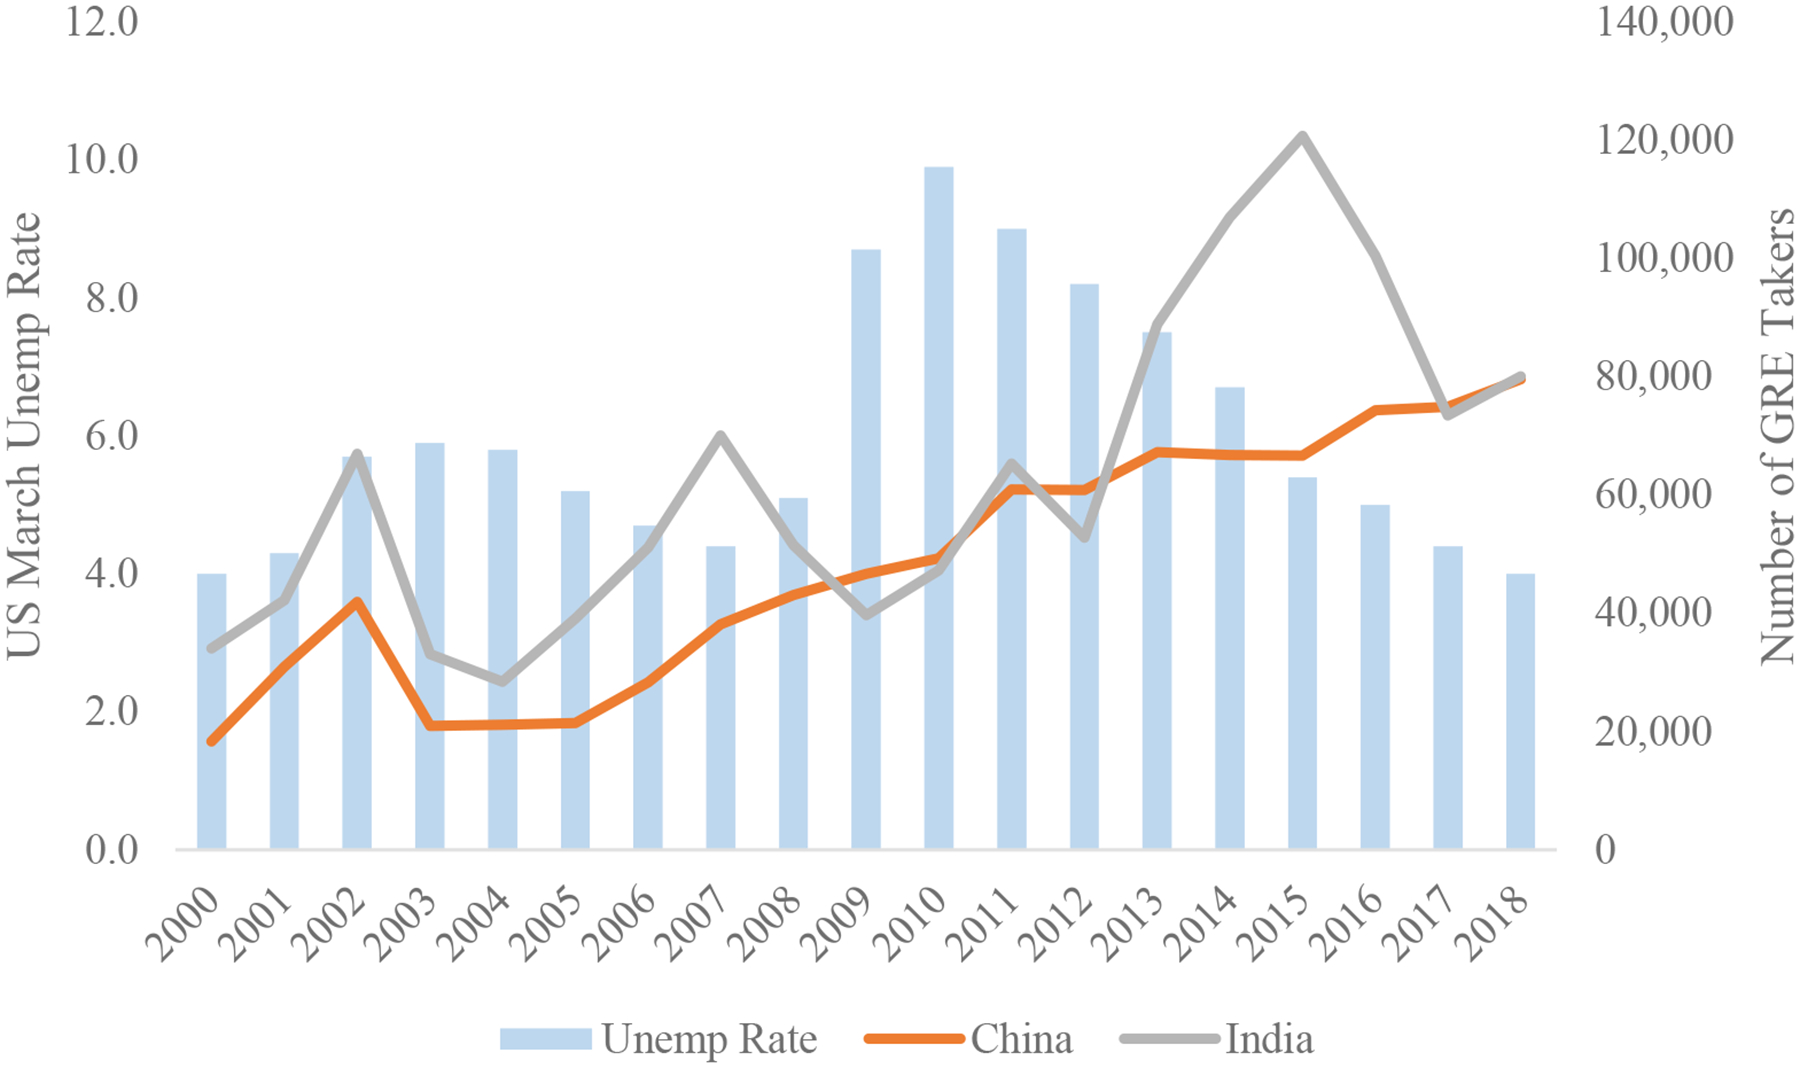
Number of GRE Test Takers and the Business Cycle
Source: GRE test takes by country from Electronic Testing Services (ETS) (2000–18). U.S. March unemployment rate from the Bureau of Labor Statistics (2000–18)
Our interpretation of why foreign students might want to come of the U.S. for part or all of their post-secondary education implies that the countries that send the most post-secondary students to the U.S. should be the countries with fewer university options, and those countries from which students are likely to want to migrate to the U.S. Similarly, the likelihood that foreign students stay in the U.S. after finishing their studies is also a function of economic conditions in their home countries. Generally, students from richer nations are less likely to convert their student status to an OPT than students from poor countries (Figure 7). Notably, about 65% of all Indian bachelor’s graduates converted to a OPT in 2015, while only 28% of Canadian graduates switched to an OPT over the same periods.
Figure 7—
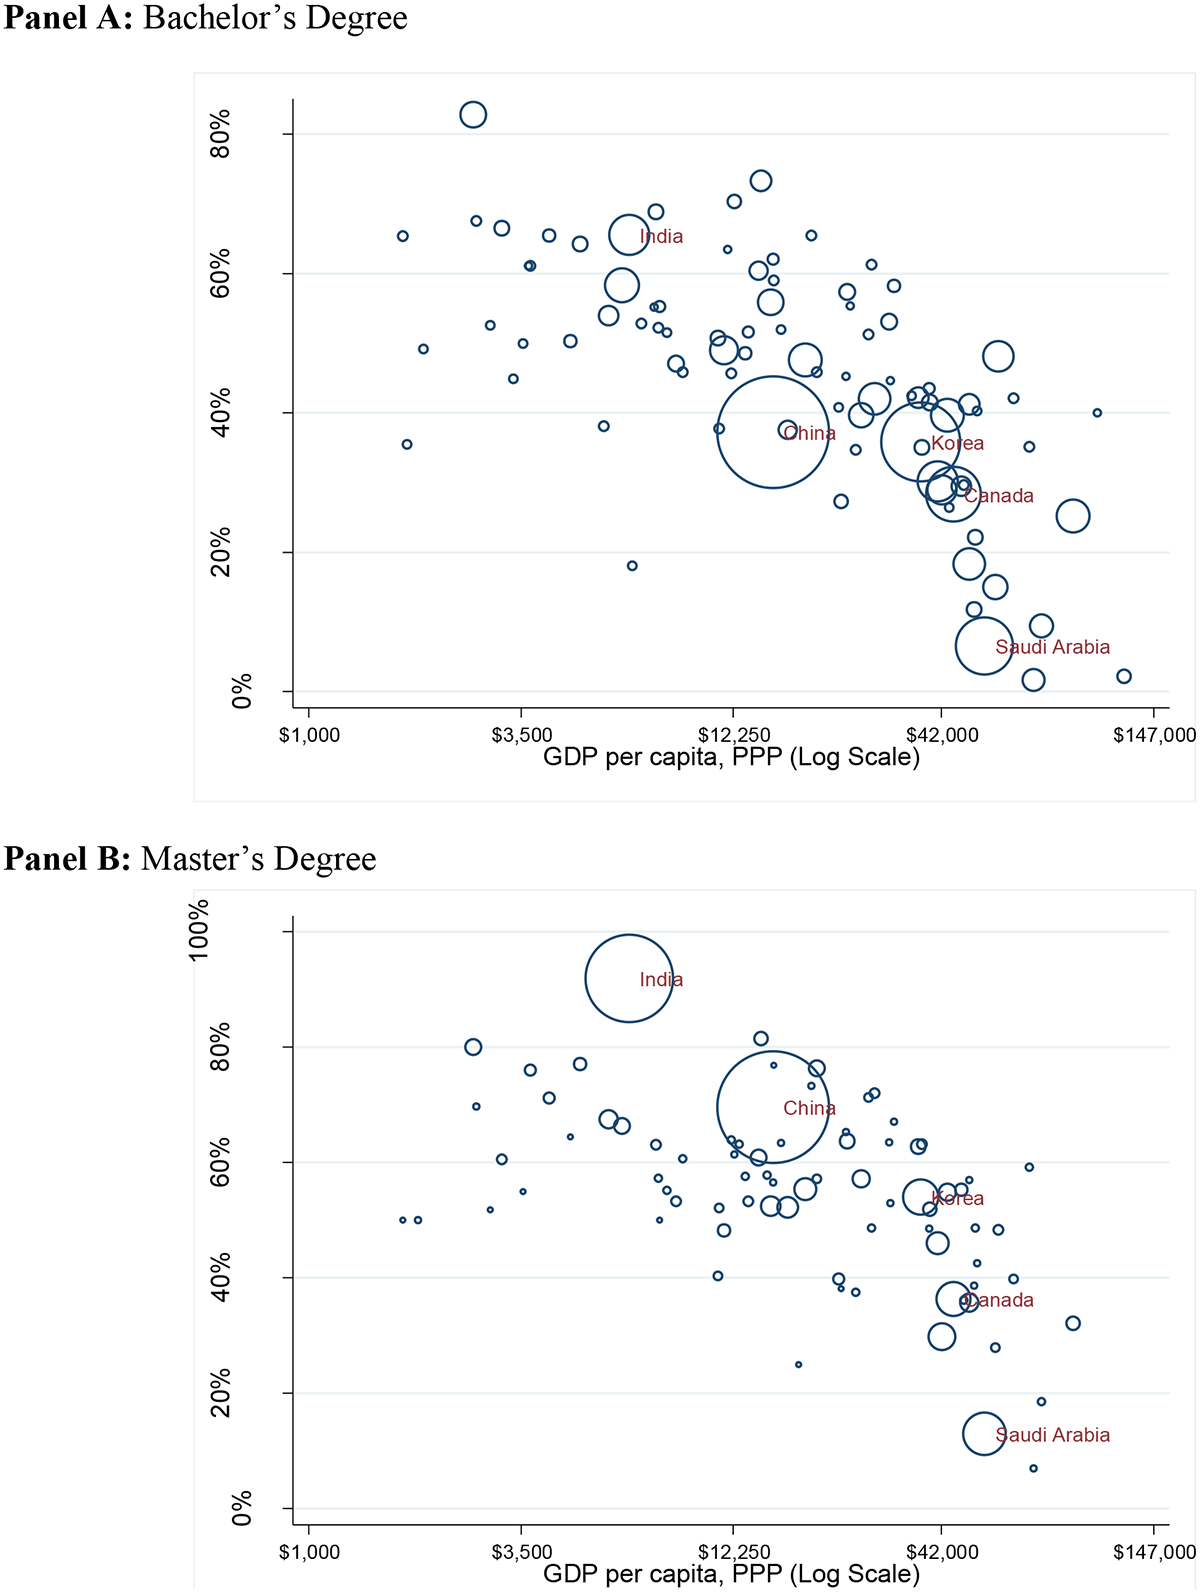
Share of F1 Visas Converted to OPT by Country’s per Capita GDP
Note: Size of each bubble is proportional to the number of foreign graduates in 2015. Sample is restricted to countries with more than 50 graduates in 2015. Source: F1 Data 2015 and World Bank 2016.
Finally, political conditions in both sending countries and the U.S. have affected the decisions of international students to enroll in an American post-secondary institution. For instance, the increase in PhD enrollment of students from China in the early 1980s and from Eastern Europe and the former Soviet Union in the late 1980s and early 1990s are associated with political changes in those countries (Blanchard, Bound, and Turner, 2009). The establishment of diplomatic relations between China and the United States in 1979 dramatically changed the level of educational exchange between these two countries (Bound, Turner, and Walsh, 2009). In addition to the opening of doors, both public and private investments occurred in institutions designed to support such human capital investment.11 The collapse of the former Soviet Union also led to an exodus of scholars and graduate students to the United States and universities in Europe and Israel. Political developments have also sometimes worked to close down foreign student enrollment, as happened for students from China in the early 1950s, Hungary in the mid-1950s, and Iran after the 1979 Iranian Revolution.
5. The Supply Side: Why U.S. Colleges and Universities Want Foreign Students
U.S. colleges and universities seek talent and resources from international students. The relative importance of capacity to pay and academic skills varies markedly by degree program and type of university.
For students at the doctorate level, capacity to pay is secondary (and often irrelevant) as admission to many programs is accompanied by full tuition waivers and guaranteed living expenses for multiple years and academic promise, with the specific expectation of contribution to the research enterprise, the primary criteria for admission. At the other extreme, many MA programs and undergraduate programs have quite modest academic requirements and can attract foreign students who are able to pay tuition levels that only a minority of U.S. students are able to pay in full. In the middle ground are selective colleges and universities that face excess demand among highly qualified students. These institutions, often competing on quality, see both academic talent and capacity to pay among foreign students as inputs in their objective functions.
Distribution of Students across Institutions
As shown in Table 2, foreign students studying at the undergraduate level are most numerous at large public research universities (about 33%). Although the concentration of students at public research institutions is noteworthy, there are many foreign students studying at non-doctorate and less selective private and public institutions. Indeed, the concentration of foreign undergraduates at public universities ties in part to declines in state support, which induced publicly funded universities to seek tuition revenue from full-fee paying international undergraduates (Bound et al., 2020).12
Table 2:
Distribution of Foreign Students at Public and Non-Profit Universities and Tuition Status, 2015
| Private, Non-Profit | Public | ||||||||
|---|---|---|---|---|---|---|---|---|---|
| Degree Type | Institution Type | # Students | Tuition & Fee | Expected Contribution | Fully Funded | # Students | Tuition & Fee | Expected Contribution | Fully Funded |
| BA | Non-PhD | 79,527 | $31,138 | $20,355 | 13% | 54,399 | $15,324 | $13,099 | 6% |
| BA | Other PhD | 28,800 | $37,526 | $30,486 | 5% | 48,055 | $20,313 | $18,321 | 6% |
| BA | Very High Research PhD | 34,133 | $45,266 | $38,466 | 11% | 121,440 | $29,245 | $28,249 | 2% |
| MA | Non-PhD | 57,870 | $20,358 | $17,748 | 3% | 38,351 | $13,899 | $12,918 | 5% |
| MA | Other PhD | 35,440 | $26,564 | $24,313 | 3% | 52,170 | $18,020 | $15,517 | 10% |
| MA | Very High Research PhD | 61,490 | $45,512 | $39,858 | 5% | 74,006 | $27,410 | $23,709 | 11% |
| PhD | Non-PhD | 3,950 | $27,353 | $20,589 | 20% | 3,466 | $14,613 | $4,857 | 73% |
| PhD | Other PhD | 7,188 | $25,667 | $10,645 | 51% | 21,205 | $16,217 | $4,498 | 72% |
| PhD | Very High Research PhD | 28,055 | $38,451 | $4,394 | 87% | 70,675 | $22,238 | $4,504 | 79% |
Note: Very High Research PhD are universities classified as having very high research activity by the Carnegie 2010 classifications. Other PhD are universities classified as having high research activity by the Carnegie 2010 classifications and other Doctoral-awarded universities. Non-PhD are all other post-secondary institutions. Tuition & Fee are the average tuition and fee charged to the foreign student. Expected Contribution is the average tuition and fee not funded by the post-secondary intuition. Fully funded are the share of students who are fully funded by the post-secondary intuition Source is F-1 visa administrative data, from United States Citizenship and Immigration Services (USCIS).
Enrollment in MA programs is evident across all institutions and in both the private and public sectors. There are a few private universities in big coastal metros such as New York University and the University of Southern California with particularly high levels of MA enrollment (Figure 3). Naturally, doctorate-level enrollment is concentrated at research universities, with the public research universities having a somewhat higher level of foreign PhD enrollment owing to both greater scale and large programs in engineering and other STEM fields, which tend to attract foreign students.
Revenue Implications
It would be naïve to understate the revenue implications of foreign students for U.S. colleges and universities. Data on tuition, living expenses and institutional financial support available to foreign students reveal the magnitude. In 2015, data on F-visa recipients point to nearly $17 billion dollars in tuition revenue from foreign students studying at the BA level and above to public universities and private, non-profit institutions, with for-profit providers drawing an additional $800 million dollars from foreign students.
But, the revenue implications differ markedly by degree level as shown in Table 2. BA and MA students rarely have a “free ride,” while it is quite common for doctorate-level students to have university resources cover tuition and fees. International undergraduate students pay nearly 96% of tuition costs from personal or home country sources at public research universities. Among undergraduate students at private universities, the share paid by individuals is somewhat smaller but the levels are higher, reflecting the higher tuition prices at private institutions. Two different factors yield a modest wedge between the sticker price and what students pay for foreign students at the undergraduate level: first, a modest number of very wealthy private institutions like Princeton University provide some financial aid for foreign undergraduates and, second, somewhat less selective private universities regularly engage in “discounting,” offering financial aid to increase enrollment (Bowen and Breneman, 1993).
Foreign students studying at the MA level represent a significant source of revenue in both the public and private sectors of higher education, representing $3 billion and $4.3 billion in revenues respectively. Although top research universities have the largest numbers of MA students and are able to extract the highest prices (net tuition revenue of $39,858 on a posted tuition and fee level averaging $45,512), there are also a substantial number of full-pay foreign students outside this tier in the public and private sectors.
The importance of MA-level training for foreign students as a revenue source for universities has increased markedly in recent years with a number of universities adding revenue-generating programs precisely to cater to foreign students. Figure 8 illustrates the growth in master’s programs (with more than five students) that are more than 80% foreign. The growth, accelerating after universities lost other sources of revenue following the Great Recession, has primarily been in STEM-based programs. Indeed, changes in federal funding for science may tie to the eagerness of U.S. colleges and universities to accommodate students from abroad in STEM-based master’s programs, and these programs may in turn, cross-subsidize doctorate programs.
Figure 8—
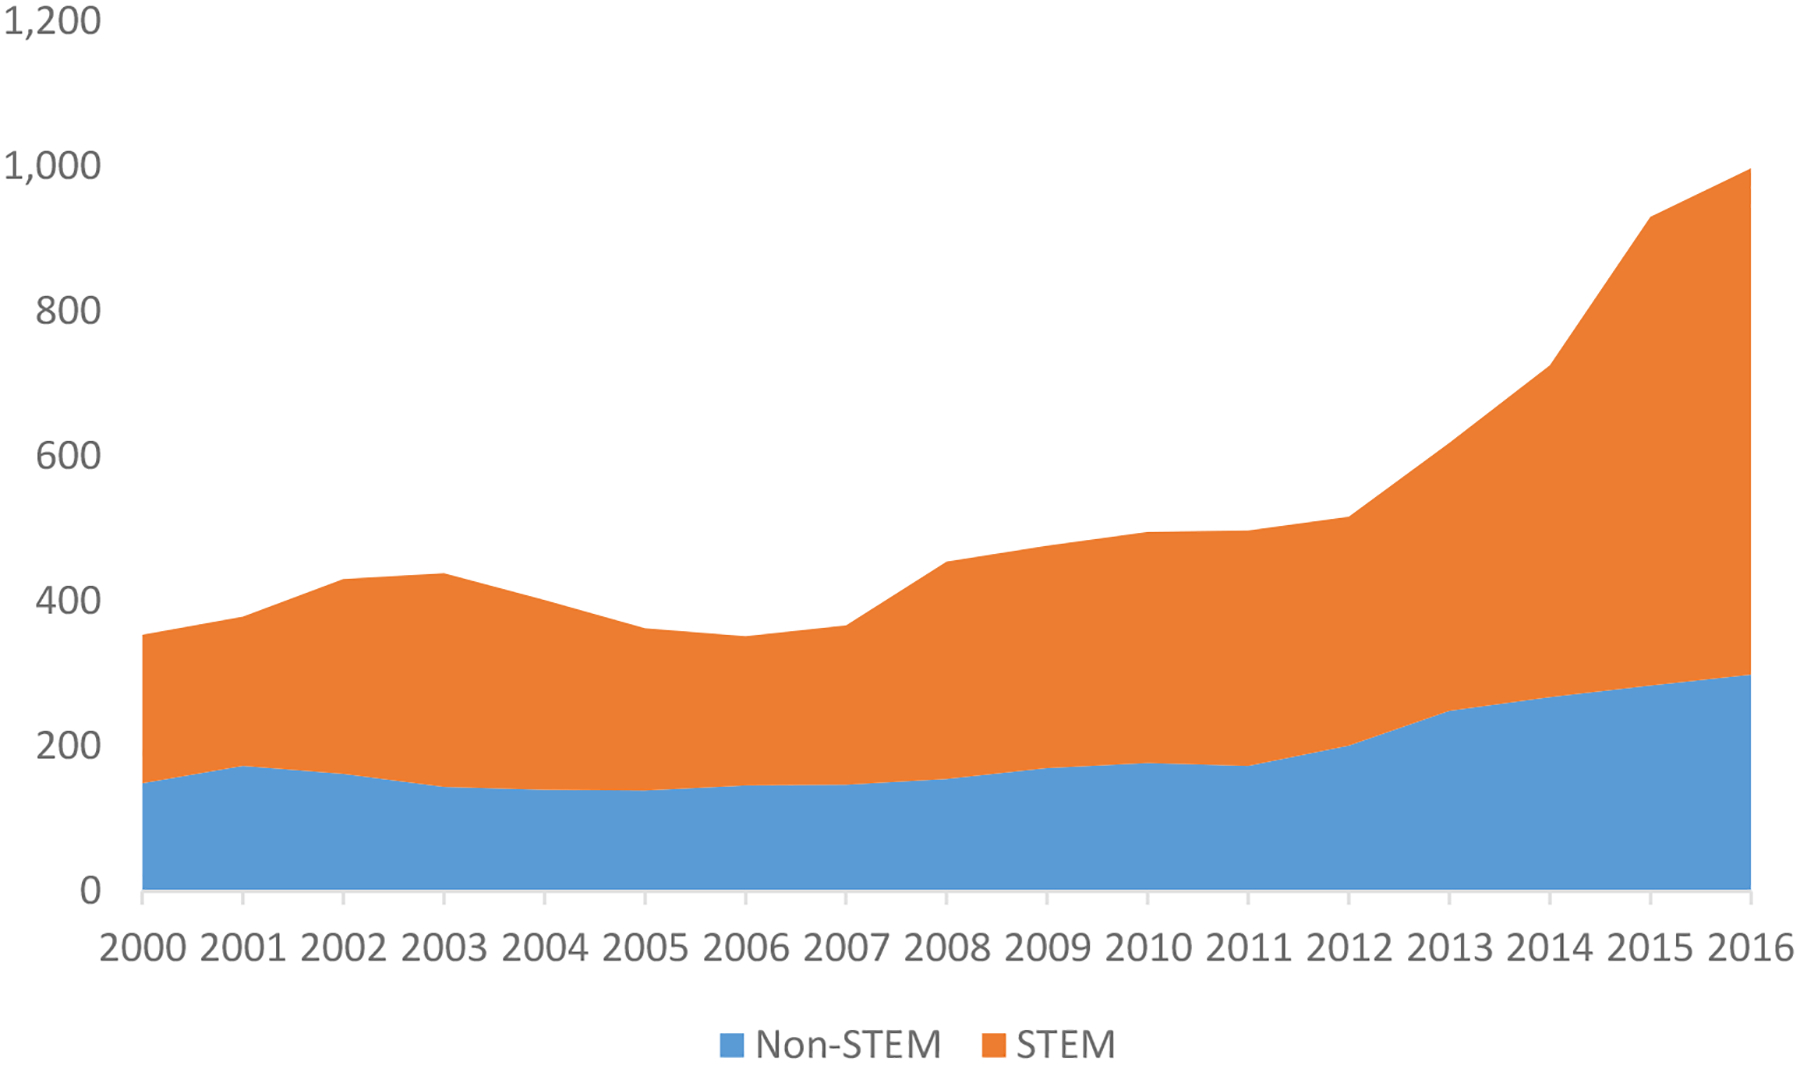
Number of Master’s Programs with Majority Foreign Graduates (80 percent of more)
Source: IPEDS Degrees 2000–16. Counts of number of master’s programs with five or more students that have at least 80% of enrollment share being foreign students. STEM degrees are those in Science, Technology, Engineering, and Mathematics.
In a strict accounting sense, doctorate programs are cost drivers, not sources of revenue generation, and this is evidently true for foreign students as well as domestic students. Using data on total cost of attendance (which includes living expenses), it is evident that universities in the private and public sectors make a substantial investment in foreign doctorate students. For 2015, average total expenses (tuition and living expenses) for doctorate students and top private research universities were nearly $62,000, with funds from universities averaging $55,572 (about 90% of the total); at public research universities, the comparable numbers are $39,803 in total expenses with $34,396 funded from universities.13 A revealed preference indication from this cost structure at the doctorate level is that the benefits for foreign students to the research enterprise must exceed costs.
6. Consequences of Flows
Dramatic increases (and decreases) in foreign student flows may have implications for not only the university sector, but also labor markets and the broader economy in both the sending and receiving countries. A body of work examines such consequences, most notably focused on the consequences on the native-born and institutions in the U.S.
One obvious question is related to whether the spillovers of international flows on native students are beneficial or not. There is some indication that foreign PhD students “crowd out” domestic students (Borjas 2007). Indeed, in contexts where there are capacity constraints on enrollment along with an excess demand for slots among domestic students, some crowd out may occur. In addition, there is some indication that at the undergraduate level, the concentration of international students in certain majors like business, economics, or science and engineering may dilute per-student resources or lead local students to concentrate in other fields (Anelli, Shih, and Williams, 2017). In addition, some suggest that growth in foreign students may have generated institution-level administrative challenges, while others have questioned how well foreign students are integrated at U.S. universities (Jordan, 2015; Redden, 2014; Gareis, 2012).
Yet, much evidence also points to the potential cross-subsidization of native students. International students are an important source of revenue for public research universities facing declining state appropriations (Bound et al., 2020). Such universities would have had to navigate reductions in instructional resources per student or substantially raise in-state tuition in the absence of a ready supply of foreign students. Declining resources and higher tuition rates may have, in turn, made college not a worthwhile investment for domestic undergraduate students.
Such cross-subsidization may also be present in graduate programs, specifically dependent on revenue from master’s programs (Shih, 2017). Revenue-generating master’s programs are not only more likely to charge full sticker price than subsidized PhDs, but they are also relatively more elastic in their supply. Indeed, many large research revenues now draw as much as 20 percent of their tuition revenue from foreign students (Larmer, 2019), potentially allowing institutions to improve curricular offerings and limiting tuition increases for domestic students. Yet, such a change shifts the budget risk from local economic shocks to dependence on foreign flows, which respond to global political crises, home-country economies, growth in home-country institutional quality, and competition from other developed economies like Canada, the U.K., and Australia.
International student flows also help generate a ready supply of high-skill foreign workers for the U.S. labor market. The OPT program allows students between one and two years of additional labor market experience in the U.S. post graduation, and the stringently capped high-skill H-1B program has a separate category of 20,000 visas that makes it easier for foreign citizens who have a graduate degree from U.S. universities. Such features help facilitate the transition to the U.S. workforce.
Since the H-1B program is capped, students who transition to the H-1B may be crowding out other foreigners who may have taken such visas. However, if foreigners who were students in the U.S. are either better trained, or trained in a way consistent with U.S. employers’ expectations, than their foreign-trained counterparts, this may raise the productivity of these workers (relative to their foreign-trained counterparts). In turn, the pool of foreign students considering U.S. employment facilitates matches and reduces the monopsony power employers have over foreign workers.14 Foreign students looking for work in the U.S. are likely to have spillover effects on U.S. students for a combination of reasons. The fact that employers could easily prefer foreign over comparable U.S. students because the foreign student is likely willing to accept a lower wage may give the foreign student an advantage over U.S.-born students.
Additionally, some limited and anecdotal evidence exists that the expansion of OPT combined with the potential for limited employment while enrolled has contributed to the rise of fraudulent post-secondary institutions.15 One such example is the case of Tri-Valley University in California, which appears to have nearly 1,000 students enrolled on F-1 visas by May of 2010, with 185 listed as pursuing a doctorate degree in Computer Science. The institution was shut down in 2011 by Immigration and Customs Enforcement with the founder charged with fraud and money laundering.16
While cases of outright fraud are likely to represent a very small share of the utilization of OPT and the extended provisions associated with STEM degrees, there is a legitimate question of how the OPT extension from 12 to 29 months in 2008 for STEM degree recipients affected outcomes in the U.S. Demirci (2015) finds increases in the incidence and duration of persistence in the U.S. for F-1 visa recipients at least in the immediate period after degree completion, with these effects particularly marked for MA degree recipients.
While stay rates are difficult to measure among foreign students at the undergraduate level, the five-year stay rate for doctorate recipients exceeds 70 percent and is higher for those from China (84 percent) and India (86 percent) than from other countries (authors’ calculations using the Survey of Earned Doctorates).17 Yet, as Figure 5 shows, given the capped nature of work visas and the rising share of international students, the transition rates from student to work visas have been steadily declining.
Transitions to the U.S. workforce are often concentrated in high-skill sectors, such as IT and health care (Bound et al. 2014). Foreign workers may help facilitate innovation and production by allowing firms to draw from a large pool of global talent abroad (Kerr, 2018). This innovation, in say IT, may have downstream effects in other sectors that utilize such products as inputs, potentially raising productivity and consumer welfare more broadly. Indeed, a number of studies have identified the outsized role played by immigrants in science and engineering innovation, including elite settings like membership in the National Academy of Sciences, Nobel prize receipt, and authorship of very highly cited papers (e.g., Chellaraj et al., 2008; Black and Stephan, 2010; Stuen et al., 2012; Gaule and Piacentini, 2013). Immigrants have also played prominent roles in tech entrepreneurship (Anderson and Platzer, 2006; Saxenian 2000; Wadhwa et al., 2007). But not all immigration in the tech fields is concentrated in the tail end of the distribution of innovation and productivity.18
Although it is straightforward to calculate the contributions of skilled immigrants educated in the U.S., evaluating their effects on the U.S. economy involves evaluating counterfactuals in a context in which there are many actors and multiple feedback loops. Estimates looking at cities or states as labor markets (Hunt and Gauthier-Loiselle 2010;, Kerr and Lincoln 2010; Peri et al. 2015) tend to find immigration increases local innovation and productivity, with stable or rising native employment and wages.19 On the other hand, studies that consider the impact of immigrants on natives within specialized fields of study have found mixed results (e.g., Borjas and Doran 2012; Moser, Voena, and Waldinger 2014). Bound et al. (2015) provide a conceptually similar analysis by analyzing the employment and wage adjustments of computer scientists across two tech booms, while many contributions to Hanson, Kerr, and Turner (2018) model the impact of skilled immigration into the U.S. on firm and human capital investments within both partial and general equilibrium settings.
Labor market opportunities may also have substantial impacts on home economies. Sending countries may experience “brain drain” as the best and brightest minds move abroad. On the other hand, the potential to migrate abroad may encourage the foreign-born to acquire skills (such as undergraduate Engineering degrees) valued abroad. Such a brain gain, combined with return migration at the end of their education or once their H-1Bs expire, may facilitate the shifting of knowledge and production to home countries (Khanna and Morales, 2020). Indeed, PhDs trained in the U.S. and other western countries may have fostered the growth of tertiary education and scientific research in a range of counties (Kahn and MacGarvie, 2016).
Evaluating the impact that the availability of foreign students interested in and capable of attending U.S. universities, on these institutions and the U.S. economy more generally, involves much more than an accounting exercise. As we have emphasized, there are important feedback effects between the educational sector and the rest of the economy. Thus, for instance, changes in the U.S. H-1B program are likely to have significant effects on the demand for education by both foreign and domestic students. Further, U.S. immigration policy interacts with other features of the U.S. economy including, for example, state higher education funding decisions. To evaluate the relevant counterfactuals essentially involves working implicitly or explicitly with general equilibrium models. To date, there is very little such work.20
7. Moving Forward: The Future of the Higher Education Sector
The flow of foreign student revenues and talent from abroad has had a substantial impact on U.S. higher education. Yet, market forces and political crises could destabilize such flows. To that end, universities have started taking precautionary methods like diversifying the portfolio of origin countries, and even as far as getting insurance companies to cover them against any losses to foreign-student revenue (Bothwell, 2018).
Political concerns following the recent escalation of U.S.-China trade relations, and the handling of pandemics, may curb the flow of foreign students from abroad. Indeed, recent analysis by Khanna et al. (2020) suggests that if the U.S.-China trade war were to continue, it could cost U.S. universities about 30,000 Chinese students or $1.15 billion in revenue over the next 10 years. This loss, about 8% of educational service exports to China, is likely an underestimate as it does not account for broader effects on local economies surrounding universities.
More generally, changes to the likelihood of obtaining a work visa may discourage many students who were looking at U.S. education as a stepping-stone to the labor market, from coming to U.S. universities. Indeed, for the first time in many decades, new foreign undergraduate enrollment has actually declined. At the same time, universities in other parts of the world have become global players in this market and threaten the U.S.’s dominant position in attracting foreign students. Table 1 shows how countries like Australia, Canada, and the U.K. have, over time, increased their capacity to accommodate foreign students.
Importantly, the expansion of home-country institutional capacity may keep students back in China or India. In India, the expansion of numerous Institutes of National Importance (INI) has consistently stemmed the flow of bachelor’s students. These INIs are primarily teaching-based institutions but do produce a stream of high-quality students ready for graduate programs. China, on the other hand, has recently increased investments in both the instructional and research capacity of their higher education institutions. The introduction of the Project 985 and Project 211 increased university resources at multiple tiers of the quality distribution. This is reflected in the Shanghai Rankings shown in Figure 9, where a dramatic increase in the fraction of Chinese universities in the top 500 worldwide mirrors (in percentage points) the decline in U.S. universities. As such, the universities on the margin that the Chinese colleges are “overtaking” are the lower mid-tier U.S. institutions. Such changes may affect the future flow of students from abroad.
Figure 9—
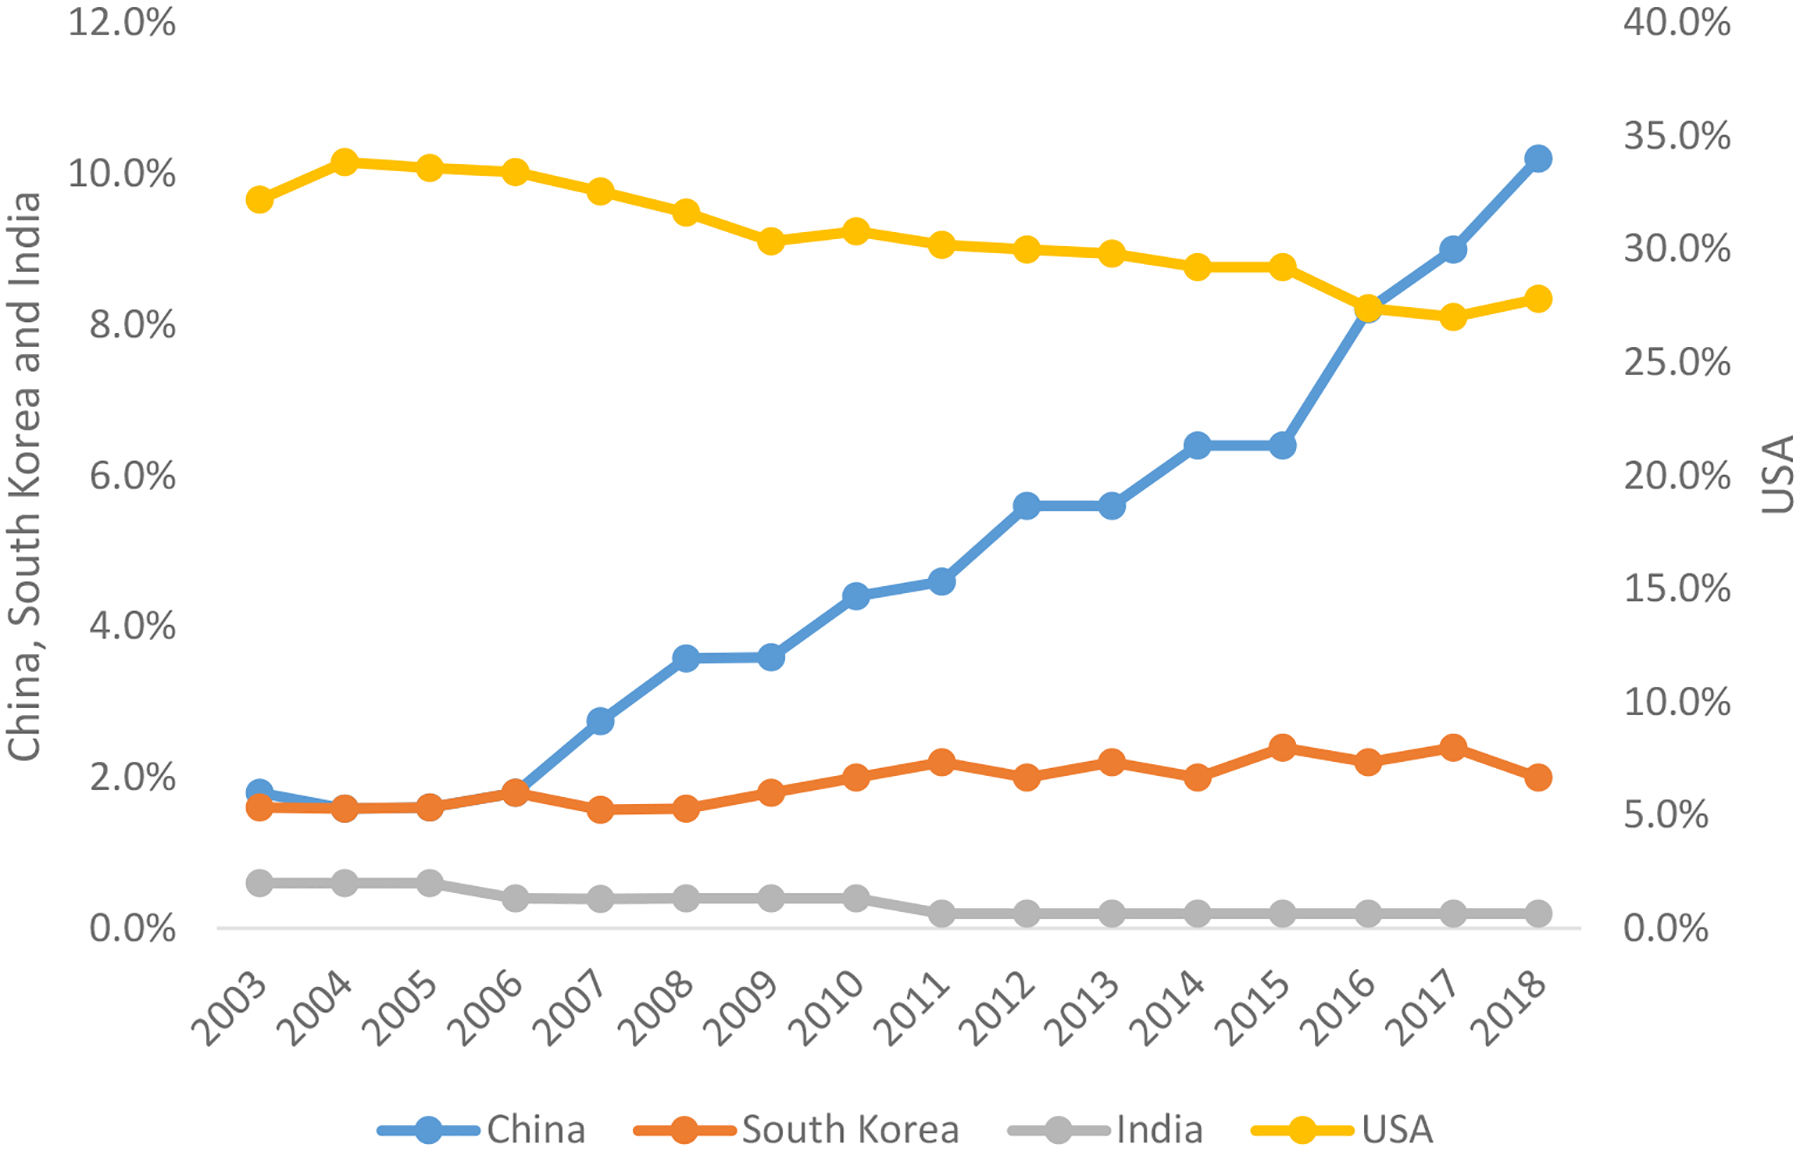
Share of Universities among the Top 500 rank
Note: The graph shows the share of universities among the 500 top ranked research universities according to the Shanghai’s Academic Ranking of World Universities (ARWU). Left y-axis is for China, South Korea, and India Universities. Right y-axis is for American Universities. Source: Shanghai Ranking, 2003–18.
Finally, universities are expected to face drastic revenue shortfalls in the second half of 2020 and beyond because of the COVID-19 crisis. These near-term projected losses range from $100 million at the University of Wisconsin-Madison to $224 million for university system in Illinois to and $300 million at the University of Minnesota.21 Possible in-person enrollment reductions in the summer and fall and tightening visa and mobility restrictions tend to exacerbate these shortfalls. As such, universities most reliant on foreign enrollment may be most adversely affected.
Acknowledgments
We thank the National Science Foundation for generous research support. We are grateful to Nathaniel Ruby for superb research assistance.
Footnotes
A New York Times columnist summarized, “The idea that a student taking classes in Iowa City or Ann Arbor can be counted as an export might seem strange. In economic terms, however, the student’s situation is not so different from, say, a Japanese company buying American soybeans: Foreign money flows into the United States from abroad—except that in this case, the product doesn’t leave the country.”
The top 8 destiny countries are the United States, United Kingdom, Australia, Germany, France, Russia, Canada, and Japan.
Saudi Arabia is a special case. There was a substantial growth in the number students in the U.S. from Saudi Arabia over the decade from 2003 to 2013. Much of this growth was concentrated at the undergraduate level, increasing from 2,022 students in 2003 to 26,865 in 2013. A clear impetus behind this increase was the introduction of the King Abdullah Scholarship Program, which stemmed from efforts to improve Saudi-US relations post-9/11, but has since grown into a substantial program aimed at boosting Saudi human capital. Yet, decreased budgets and new restrictions on approved universities have limited its growth since 2016. See Saudi Arabian Cultural Bureau (2014).
Focusing on MA degrees in CS and IT-related fields, Bound et al. (2014) note that there is substantial heterogeneity in the programs awarding degrees to temporary residents. Institutions awarding large numbers of master’s degrees in CS to temporary residents in 2013 include Carnegie Mellon University (464), Illinois Institute of Technology (397), University of Southern California (377), Columbia University in the City of New York (292), and University of Texas at Dallas (214). Ghose and Turner (2020) demonstrate the sensitivity of MA enrollment from foreign students to labor demand variation, with much of the MA enrollment changes concentrated among less-selective and for-profit institutions.
Chen and Korn (2015) note that Wichita State pays foreign agents between $1,000 and $1,600 per student for recruiting.
Although the original H-1 visa did not have a numerical cap, the Immigration Act of 1990 imposed an annual cap of 65,000 visas. The cap was not reached during the early 1990s, but the cap became binding in the mid-1990s. In 1999 and 2000, the cap was raised to 115,000, and then to 195,000 in 2001. This limit held until 2004, when the H-1B cap reverted to 65,000 once again. In 2004, Congress authorized, through the Visa Reform Act, that an extra 20,000 H-1B visas could be issued to foreign workers holding advanced degrees from U.S. universities.
Since 2016, there has been a drop in new student visas, perhaps reflecting a change in the visa renewal requirements of Chinese students, as well as other global trends in the demand for higher education from abroad. In 2014, Chinese students were given an extension for their F-1 student visas, making them valid for five years instead of one.
Secondary options that are numerically less frequently used include a direct path to permanent residency as a spouse/relation of a U.S. citizen.
Evidence suggests that most qualified students in India are being crowded out of top Indian colleges (Najar, 2011).
Amuedo-Dorantes, Furtado, and Xu (2019), find evidence that when the OPT policy was changed in 2008 to extent the time for STEM graduates to stay in the U.S. after graduation, it induced an increasing number of foreign students to major in STEM fields.
Bound, Turner, and Walsh (2009) and Blanchard, Bound, and Turner (2009) include some discussion of these institution investments. Central European University, founded in 1991, is a classic example of such investments.
Since the mid-1980s, there has been a substantial decline in state appropriations per student from about $12,000 per full-time equivalent (FTE) to less than $7,000 per FTE in 2015. The secular decline is punctuated by clear downward cycles following recessions in 1990, 2001, and 2008. As such, for public universities, the balance between state appropriations and tuition revenues has shifted markedly over time toward greater reliance on tuition revenues.
Note that some of what appears as university funding may reflect grant funding from federal or private sources allocated at the university level.
Much of the criticism leveled at the H-1B program involves the limited mobility H-1B workers have. Similarly, to be eligible for the OPT extensions, foreign students need to find jobs within two months of finishing their degrees.
CPT (Curricular Practical Training) allows for some internship-like employment while enrolled; in addition, F-visas recipients are eligible for limited on-campus employment.
One report in the Chronicle of Higher Education suggests, “Tri-Valley is only the beginning. Other colleges—most of them unaccredited—exploit byzantine federal regulations, enrolling almost exclusively foreign students and charging them upward of $3,000 for a chance to work legally in the United States. They flourish in California and Virginia, where regulations are lax, and many of their practices—for instance, holding some classes on only three weekends per semester—are unconventional, to say the least. These colleges usher in thousands of foreign students and generate millions of dollars in profits because they have the power, bestowed by the U.S. government, to help students get visas” (Bartlett, Fischer, and Keller, 2011).
At the PhD level, Finn and Pennington (2018) find that 10-year stay rates (2002–03 to 2013) were highest among students from China and India (85%), with students from South Korea, Europe, and the Americas less likely to stay.
Using patent data, Hunt and Gauthier-Loiselle (2010) find that, conditional on occupation, immigrants are equally likely to innovate as U.S. -born workers.
The location of high-skilled immigration is clearly endogenous. The cited authors address this issue by using shift-share instrumental variables. For a fuller discussion of this issue, see Bound et al., (2015) and Bound, Khanna, and Morales (2018).
Given the complexity of the factors at work, authors who have addressed general equilibrium issues (e.g., Bound et al., 2015; Bound, Khanna and Morales, 2018; Yeaple, 2018; Jaimovich and Siu, 2018; Waugh, 2018; Demirci, 2020; Llull, 2018; Khanna and Morales, 2020) have typically focused on specific sectors of the economy.
For the university system in Illinois, see Week.com (2020); for University of Minnesota, see Moini (2020); and for University of Wisconsin- Madison, see Lock (2020).
Contributor Information
John Bound, Department of Economics, University of Michigan – Ann Arbor, and NBER.
Breno Braga, The Urban Institute, Washington, DC.
Gaurav Khanna, School of Global Policy and Strategy, University of California – San Diego.
Sarah Turner, Department of Economics, University of Virginia, and NBER.
References
- Amuedo-Dorantes Catalina, Furtado Delia, and Xu Huanan. 2019. “OPT Policy Changes and Foreign Born STEM Talent in the US.” Labour Economics 61: 101752. [Google Scholar]
- Anderson Stuart, and Platzer Michaela. 2006. “American Made: The Impact of Immigrant Entrepreneurs and Professionals on US Competitiveness.” Arlington, VA: National Venture Capital Association. [Google Scholar]
- Anderson Nick, and Svrluga Susan. 2018, November 13. “What’s the Trump Effect on International Enrollment? Report finds new foreign students are dwindling.” The Washington Post. [Google Scholar]
- Anelli Massimo, Shih Kevin, and Williams Kevin. 2017. “Foreign Peer Effects and STEM Major Choice.” IZA Working Paper [Google Scholar]
- Bartlett Tom, Fischer Karin, and Keller Josh. 2011, March 20. “Little-Known Colleges Exploit Visa Loopholes to Make Millions Off Foreign Students.” The Chronicle of Higher Education. https://www.chronicle.com/article/Little-Known-Colleges-Make/126822 [Google Scholar]
- Bird Kelli, and Turner Sarah. 2014. “College in the States: Foreign Student Demand and Higher Education Supply in the U.S” EdPolicyWorks Paper, Curry School of Education University of Virginia. [Google Scholar]
- Black Grant C., and Stephan Paula E.. 2010. “The Economics of University Science and the Role of Foreign Graduate Students and Postdoctoral Scholars.” In American universities in a global market, pp. 129–61. University of Chicago Press. [Google Scholar]
- Blanchard Emily, Bound John, and Turner Sarah. 2009. “Opening (and Closing) Doors: Country-Specific Shocks in U.S. Doctorate Education.” Population Studies Center Report 09–674. [Google Scholar]
- Borjas George. 2007. “Do Foreign Students Crowd Out Native Students from Graduate Programs?” in Stephan Paula E. and Ehrenberg Ronald G. (eds.) Science and the University (Science and Technology in Society). University of Wisconsin Press. [Google Scholar]
- Borjas George J., and Doran Kirk B.. 2012. “The Collapse of the Soviet Union and the Productivity of American Mathematicians.” The Quarterly Journal of Economics 127(3): 1143–1203. [Google Scholar]
- Bothwell Ellie. 2018, November 29. “Insuring Against Drop in Chinese Students” Inside Higher Ed https://www.insidehighered.com/news/2018/11/29/university-illinois-insures-itself-against-possible-drop-chinese-enrollments [Google Scholar]
- Bound John, Braga Breno, Khanna Gaurav, and Turner Sarah. 2020. “A Passage to America: University Funding and International Students.” American Economic Journal: Economic Policy 12(1): 97–126. [DOI] [PMC free article] [PubMed] [Google Scholar]
- Bound John, Braga Breno, Golden Joseph, and Khanna Gaurav. 2015. “Recruitment of Foreigners in the Market for Computer Scientists in the United States.” Journal of Labor Economics July 33 (S1): 197–223. [DOI] [PMC free article] [PubMed] [Google Scholar]
- Bound John, Demirci Murat, Khanna Gaurav, and Turner Sarah. 2014. “Finishing Degrees and Finding Jobs: U.S. Higher Education and the Flow of Foreign IT Workers” Innovation, Policy and The Economy [also NBER Working Paper No. 20505]. [Google Scholar]
- Bound John, Khanna Gaurav, and Morales Nicolas. 2018. “Understanding the Economic Impact of the H-1B Program on the United States.” High-Skilled Migration to the United States and Its Economic Consequences: 109. eds. Hanson Gordon, Kerr William, and Turner Sarah. University of Chicago Press. [Google Scholar]
- Bound John, Turner Sarah, and Walsh Patrick. 2009. “Internationalization of U.S. doctorate education.” In Science and engineering careers in the United States: analysis of markets and employment, edited by Freeman RB and Goroff DL. Chicago: University of Chicago Press. [Google Scholar]
- Bowen WG, and Breneman DW, 1993. “Student Aid: Price Discount or Educational Investment?” The Brookings Review 11(1), p. 28. [Google Scholar]
- Chellaraj Gnanaraj, Maskus Keith, and Mattoo Aaditya. 2008. “The Contribution of International Graduate Students to US Innovation.” Review of International Economics 16(3): 444–62. [Google Scholar]
- Chen Te-Ping, and Korn Melissa. 2015. “American Colleges Pay Agents to Woo Foreigners, Despite Fraud Risk” Wall Street Journal. https://www.wsj.com/articles/american-colleges-payagents-to-woo-foreigners-despite-fraud-risk-1443665884 [Google Scholar]
- Demirci Murat. 2015. “OPT and The Impact of High Skill Immigration on Career Decisions of College-Educated Natives.” Working paper. [Google Scholar]
- Demirci Murat. 2020. “The Effects of High-skill Immigration on Choice of College Major, Occupation, and Earnings.” Working paper. [Google Scholar]
- Finn Michael, and Ann Pennington Leigh. 2018. “Stay Rates of Foreign Doctorate Recipients from U.S. Universities, 2013” Oak Ridge Institute for Science and Education. [Google Scholar]
- Gareis Elizabeth. 2012. “Intercultural Friendship: Effects of Home Region and Sojourn Location.” Journal of International and Intercultural Communication, 5: 309–28. [Google Scholar]
- Gaule Patrick, and Piacentini Mario. 2013. “Chinese Graduate Students and US Scientific Productivity.” Review of Economics and Statistics 95(2): 698–701. [Google Scholar]
- Ghose Devaki, and Turner Sarah. 2020. “Enrollment as Access to Employment: Evidence from Foreign Student Enrollment in CS.” Working Paper. [Google Scholar]
- Hanson Gordon H., Kerr William R., and Turner Sarah, eds. 2018. High-Skilled Migration to the United States and Its Economic Consequences. University of Chicago Press. [Google Scholar]
- Hechinger F 1979. “Iranian Plight Puts a Spotlight on U.S. Colleges.” New York Times (February 20), p. c4. [Google Scholar]
- Hunt Jennifer, and Gauthier-Loiselle Marjolaine. 2010. “How Much does Immigration Boost Innovation?” American Economic Journal: Macroeconomics 2(2): 31–56. [Google Scholar]
- Integrated Postsecondary Education Data System (IPEDS) Enrollment. 2018. [Data file]. Retrieved from https://nces.ed.gov/ipeds/
- Jaimovich Nir, and Siu Henry E.. 2018. “High Skilled Immigration, STEM Employment and Nonroutine-Biased Technical Change.” High-Skilled Migration to the United States and Its Economic Consequences: 109. eds. Hanson Gordon, Kerr William, and Turner Sarah. University of Chicago Press. [Google Scholar]
- Jordan Miriam. 2015, March 24. “International Students Stream into U.S. Colleges.” Wall Street Journal. http://www.wsj.com/articles/international-students-stream-into-u-s-colleges-1427248801 [Google Scholar]
- Kahn Shulamit, and MacGarvie Megan. 2016. “Do Return Requirements Increase International Knowledge Diffusion? Evidence from the Fulbright Program,” Research Policy 45(6), 1304–22. [Google Scholar]
- Kato Takao, and Sparber Chad. 2013. “Quotas and Quality: The effect of H-1B Visa Restrictions on the Pool of Prospective Undergraduate Students from Abroad.” The Review of Economics and Statistics, 95(1): 109–26. [Google Scholar]
- Kerr William. 2018. The Gift of Global Talent: How Migration Shaped Business, Economy, & Society. Stanford, CA: Stanford University Press. [Google Scholar]
- Kerr William R., and Lincoln William F.. 2010. “The Supply Side of Innovation: H-1B Visa Reforms and US Ethnic Invention.” Journal of Labor Economics 28(3): 473–508. [Google Scholar]
- Khanna Gaurav, and Morales Nicolas. 2020. “The IT Boom and Other Unintended Consequences of Chasing the American Dream.” Working Paper. [Google Scholar]
- Khanna Gaurav, Shih Kevin, Weinberg Ariel, Xu Mingzhi, and Yu Miaojie. 2020. “Trade Liberalization and Chinese Students in US Higher Education.” Working Paper. [Google Scholar]
- Larmer Brook. 2019. “One of America’s Most Vital Exports, Education, Never Goes Abroad, but It Still Faces Threats.” The New York Times. https://www.nytimes.com/2019/01/03/magazine/one-of-americas-most-vital-exports-education-never-goes-abroad-but-it-still-faces-threats.html [Google Scholar]
- Llull Joan. 2018. “Immigration, Wages, and Education: A Labor Market Equilibrium Structural Model.” Review of Economic Studies, 85(3): 1852–96. [Google Scholar]
- Lock Morgan. 2020. “COVID-19 Outbreak Could Affect UW-Madison’s Fall Semester” The Daily Cardinal. https://www.dailycardinal.com/article/2020/04/covid-19-outbreak-could-affect-uw-madisons-fall-semester [Google Scholar]
- Moini Nina. 2020. “U of M considers budget cuts due to COVID-19 pandemic” MPR News https://www.mprnews.org/story/2020/04/08/u-of-m-considers-budget-cuts-due-to-covid19-pandemic [Google Scholar]
- Moser Petra, Voena Alessandra, and Waldinger Fabian. 2014. “German Jewish Émigrés and US Invention.” American Economic Review 104 (10): 3222–55. [Google Scholar]
- Najar Nida. 2011. “Squeezed Out in India, Students Turn to U.S.” New York Times https://www.nytimes.com/2011/10/14/world/asia/squeezed-out-in-india-students-turn-to-united-states.html [Google Scholar]
- Peri Giovanni, Shih Kevin, and Sparber Chad. 2015. “STEM Workers, H-1B Visas, and Productivity in US Cities.” Journal of Labor Economics 33(S1): S225–55. [Google Scholar]
- Radnofsky Louise. 2019. “U.S. Changes Visa Process for High-Skilled Workers” Wall Street Journal https://www.wsj.com/articles/u-s-changes-visa-process-for-high-skilled-workers-11548879868 [Google Scholar]
- Redden Elizabeth. 2017. “Boom in Indian Enrollments, Followed by Bust”, Inside Higher Ed. https://www.insidehighered.com/admissions/article/2017/10/30/after-huge-surge-enrollment-india-central-missouri-sees-substantial [Google Scholar]
- Redden Elizabeth. 2014, February 20. “Integrating International Students; So You Have X number of International Students on Your Campus. So What?” Inside Higher Education https://www.insidehighered.com/news/2014/02/20/gathering-senior-international-educatorsintegration-international-students-was [Google Scholar]
- Rosenzweig Mark. 2006. “Global Wage Differences and International Student Flows.” Brookings Trade Forum, pp. 57–86. [Google Scholar]
- Saudi Arabian Cultural Bureau 2014. “KASP Scholarship Program.” https://www.saudibureau.org/en/inside.php?ID=16
- Saxenian AnnaLee. 2000. “Silicon Valley’s New Immigrant Entrepreneurs.”
- Shanghai Ranking, Consultancy. 2018. “Academic Ranking of World Universities 2018.” http://www.shanghairanking.com/ARWU2018.html
- Shih Kevin. 2017. “Do International Students Crowd-out or Cross-subsidize Americans in Higher Education?” Journal of Public Economics 156: 170–84. [Google Scholar]
- Stuen Eric T., Mobarak Ahmed Mushfiq, and Maskus Keith E.. 2012. “Skilled Immigration and Innovation: Evidence from Enrolment Fluctuations in US doctoral Programmes.” The Economic Journal 122(565): 1143–76. [Google Scholar]
- UNESCO Institute for Statistics (UIS) database, 2018. [Data file]. http://data.uis.unesco.org/
- Wadhwa Vivek, Saxenian AnnaLee, Rissing Ben, and Gereff Gary. 2007. “America’s New Immigrant Entrepreneurs.” Kauffman Foundation report. [Google Scholar]
- Waugh Michael E. 2018. “Firm Dynamics and Immigration, the Case of High-Skilled Immigration.” High-Skilled Migration to the United States and Its Economic Consequences: 109. eds. Hanson Gordon, Kerr William and Turner Sarah. University of Chicago Press. [Google Scholar]
- Week.com. 2020. “Illinois universities asking for more federal money for COVID-19 related costs” https://week.com/2020/04/08/illinois-universities-asking-for-more-federal-money-forcovid-19-related-costs/
- Yeaple Stephen Ross. 2018. “The Innovative Activities of Multinational Enterprises and the Demand for Skilled-Worker non Immigrant Visas.” High-Skilled Migration to the United States and Its Economic Consequences: 109. eds. Hanson Gordon, Kerr William and Turner Sarah. University of Chicago Press. [Google Scholar]