Abstract
Centella asiatica (CA) is a culinary vegetable and well-known functional food that is widely used as a medicinal herb and dietary supplement. CA is rich in pentacyclic triterpenes (TTs), including asiaticoside (AS), madecassoside (MS) and the related aglycones asiatic acid (AA), madecassic acid (MA). Traditionally, TTs have been associated with the bioactivity and health promoting effect of CA. Recently, mono-caffeoylquinic acids (MonoCQAs) and di-caffeoylquinic acids (DiCQAs) have been found to contribute to the bioactivity of CA as well. This work reports an analytical strategy based on liquid chromatography coupled to multiple reaction monitoring mass spectrometry (LC-MRM–MS) for the simultaneous rapid and accurate quantification of 12 bioactive compounds in CA, namely AS, MS, AA, MA, 5-CQA, 4-CQA, 3-CQA, 1,3-DiCQA, 3,4-DiCQA, 1,5-DiCQA, 3,5-DiCQA, 4,5-DiCQA. Method selectivity, accuracy, precision, repeatability, robustness, linearity range, limit of detection (LOD), and limit of quantitation (LOQ) were validated. The validated LC-MRM-MS method has been successfully applied to quantify the 12 bioactive compounds in CA aqueous extracts and two related formulations: a standardized CA product (CAP) used in a phase I clinical trial and formulated CA rodent diets used in preclinical studies. The validated method allows us to support the standardization of CA products used for clinical trials and conduct routine LC-MRM-MS analyses of formulated preclinical diets to confirm correct levels of CA phytochemical markers.
Keywords: Centella asiatica, Caffeoylquinic acids, Triterpenes, LC-MRM-MS, Formulations
1. Introduction
Centella asiatica (CA) is a tropical, traditional medicinal plant that is native to Southeast Asian countries including China, India, and Malaysia 1. Numerous experiments have reported that the bioactive compounds of CA are triterpenes (TTs), including asiaticoside (AS), madecassoside (MS) and the related aglycones asiatic acid (AA), madecassic acid (MA), which contribute to the observed pharmacological properties of CA extracts 2–3. As one of the TTs, AA has received extensive attention, and its pharmacological effects and medicinal ability in different diseases have been well researched 2. Our group has a long history dating back to 2005 4 of investigating the biological activities and mechanisms associated with a hot water extract of CA (CAW) and well documented the neurotropic and neuroprotective effects of TTs in CAW 5. Our preclinical studies have demonstrated that aqueous extracts of CA improve cognition in mouse models of aging and Alzheimer’s disease 6, and caffeoylquinic acids (CQAs) reduce amyloid-β-induced cell deaths and attenuate amyloid-β-induced changes in tau expression and phosphorylation in both the MC65 and SH-SY5Y neuroblastoma cell lines 7. Other studies have also shown that 3-O-Caffeoylquinic acid (3-CQA, chlorogenic acid) protects neurons from glutamate-induced neurotoxicity by modulating Ca2+ entry into neurons 8. Some DiCQAs, in particular 3,4-DiCQA and 3,5-DiCQA, inhibit glutamate-induced neuronal death, elevation of intracellular calcium, generation of reactive oxygen species, thereby inhibiting neuronal apoptosis 9. These results suggest that CQAs also contribute to the neurologically relevant bioactivities of CA. To further evaluate the impact of CA on human health and associated pharmacological mechanisms, it has become necessary and important to properly analyze and quantify the amount of TTs and CQAs in CA extracts and related formulations.
The most common methods for the identification and quantification of bioactive compounds in CA plants are liquid chromatography (LC), mass spectrometry (MS), and LC-MS combinations. However, to the best of our knowledge, there is currently no analytical method reported that allows the accurate quantification of TTs and CQAs in one analysis. Analyzing and quantifying multiple TTs and CQAs in a single run has become feasible due to the availability of modern highly selective, sensitive, and accurate analytical techniques such as multiple reaction monitoring (MRM) mass spectrometry (MS). Tandem mass spectrometers, such as triple quadrupole type instruments, can perform analyses in MRM mode, in which a precursor ion and 2 or 3 product ions are specified and monitored, thus enabling more selective quantitative analysis compared to single product ion monitoring. LC-tandem MS analysis in MRM mode is ideal for sensitive, selective, and accurate quantitation of multiple compounds in very complex plant matrixes 10. Ultrahigh performance LC (UPLC) coupled to a triple-quadrupole mass spectrometer has been successfully applied to quantify major TTs and 3-CQA (chlorogenic acid) in CA leaf extracts with excellent LC resolution (Rs>2) 11.
In our previous study, the high-performance liquid chromatographic (HPLC) separation of DiCQAs isomers, such as 1,3-DiCQA, 3,4-DiCQA, 1,5-DiCQA, 3,5-DiCQA, and 4,5-DiCQA, was achieved on a column packed with phenyl-bonded stationary phase and their MS/MS spectra were acquired by a quadrupole time-of-flight (Q-TOF) mass spectrometer 12. However, 4-CQA and 3-CQA co-eluted 12. Compared to HPLC, UPLC typically results in narrower peaks and better resolution due to smaller column inner diameters and stationary phase particle size, and often minimizes matrix effects. In addition, TOF analyzers can provide high-accuracy mass measurements, but have a linear dynamic range of three to four orders of magnitude, whereas triple quadrupole analyzers reach six orders of magnitude. The wide linear range is especially useful for quantifying high numbers of compounds with widely varying levels, which is particularly common in plant extracts, in which the difference in levels between two compounds can be more than 50-fold 11.
The goal of the current study was to develop a selective, sensitive, and accurate analytical method based on LC-MRM-MS to quantify major TTs and CQAs in CA extracts and formulations in a single analysis. Chromatographic separation conditions, sample injection volume, sample cone voltage, and collision energy were optimized, and MRM transition ions were carefully selected for unambiguous identification and accurate quantification of isomeric CQAs. The method was validated according to the FDA Q2(R1) guidelines13 and allows for the quantification of 12 bioactive compounds in CA, including AS, MS, AA, MA, 5-CQA, 4-CQA, 3-CQA, 1,3-DiCQA, 3,4-DiCQA, 1,5-DiCQA, 3,5-DiCQA, 4,5-DiCQA (Figure 1). A hot-water CA extract, BEN-CAW-8, was chosen as reference material to validate the current method. This extract is also used in ongoing studies in our laboratory to monitor method performance in studies in which quantification of bioactive compounds in CA extracts and preparations is needed and has proven to be chemically stable for over 24 months when stored at −80°C.
Figure 1.
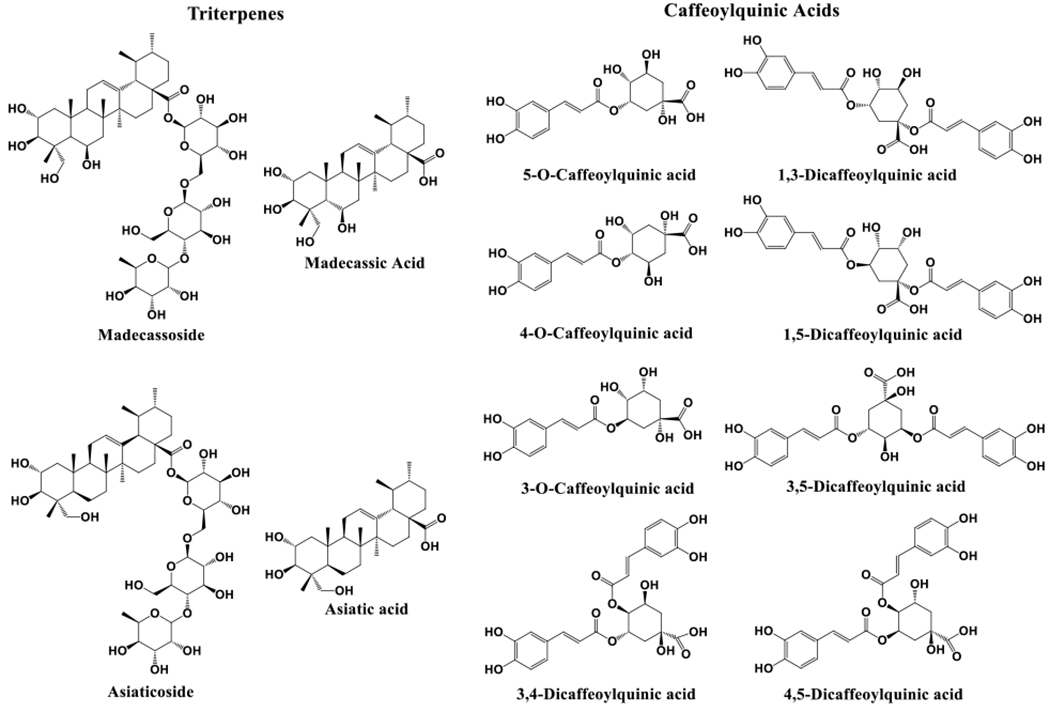
Chemical structures of triterpenes and caffeoylquinic acids quantified in Centella asiatica water extract and derived formulations.
2. Materials and Methods
2.1. Materials and chemicals
LC-MS grade methanol, water, and formic acid were purchased from Fisher Scientific (Hampton, NH, USA). Twelve authentic non-deuterated authentic standards were purchased from Cayman Chemical (Ann Arbor, MI, USA). Names according to the manufacturer were 4-O-caffeoylquinic acid (cryptochlorogenic Acid, 4-CQA), 5-O-caffeoylquinic acid (5-CQA), 1,3-dicaffeoylquinic acid (1,3-DiCQA), 1,5-dicaffeoylquinic acid (1,5-DiCQA), 3,4-dicaffeoylquinic acid (isochlorogenic acid B, 3,4-DiCQA), 4,5-dicaffeoylquinic acid (isochlorogenic acid C, 4,5-DiCQA) and madecassoside (MS), of purity ≥ 98%; and 3-O-caffeoylquinic acid (chlorogenic acid, 3-CQA), 3,5-dicaffeoylquinic acid (isochlorogenic acid A, 3,5-DiCQA), asiaticoside (AS), madecassic acid (MA) and asiatic acid (AA), of purity ≥ 95%.
Due to the inconsistency of the nomenclature used for CQAs in the literature, the chemical structure of each authentic analytical standard was verified and confirmed by NMR analysis (see supplemental materials Figure S1). The collisional cross section (CCS), a physicochemical value related to the size, shape, and charge state of a compound, was measured using trapped ion mobility mass spectrometry (TIMS) to further characterize each standard. Figure S2 reports timsCCSN2 values measured for the 12 target analytes. Digoxin-d3 with purity of ≥ 99% was purchased from Cayman Chemical (Ann Arbor, MI, USA) and was used as the heavy-labeled internal standard. All other materials were obtained from standard commercial sources.
2.2. Preparation of CA aqueous extract (CAW) and derived formulation
Dried CA plant material (aerial parts of the herb) was obtained from commercial sources through the dietary supplements company Oregon’s Wild Harvest (Redmond, Oregon, USA: OWH). Voucher samples of these plant materials have been deposited at Oregon Health and Science University (OHSU) and at the herbarium at Oregon State University (OSU). Two aqueous extracts (BEN-CAW-8 and CAW-61-J2), and three formulated materials containing CA aqueous extracts (GK-blend, CAP-4g, and Rodent diet) were analyzed in this study and compared.
CAW extracts were prepared at Oregon State University Pilot Food plant from CA dried plant materials (OSU Voucher number OSC-V-265416) using a ratio of 80 g plant material to 1 L of water as used in our previous preclinical studies 6. Dried plant material (4 kg) was boiled with deionized water (50 L) in a 15-gallon kettle for 90 min, and water lost by evaporation was periodically replaced. After cooling to a safe handling temperature, the plant material was allowed to settle, and the upper liquid was filtered using a non-woven bag filter (McMaster-Carr #5162K112) to remove any insoluble debris. The filtrate was transferred to aluminum baking trays, frozen in a blast chiller and then lyophilized in 3 separate batches to yield BEN-CAW-7, 8 and 9. BEN-CAW-8 was analyzed in the present study.
CAW-R61-J2 was a mixture of CAW extracts prepared from two different samples of CA plant material (OSU voucher numbers OSC-V-258630 and OSC-V-258631) using the same herb: water ratio and boiling time. Large scale extractions were performed from these CA samples in two batches at Ashland Laboratories (Kearny, NJ) as previously described 14. A small aliquot of each extract batch was retrieved and sent to OHSU for lyophilization. The remaining bulk of each extract batch was spray-dried onto an inert food-grade matrix. The first extraction batch yielded lyophilized extract CAW-R61-F and spray-dried extract CAW-R61-G, and the second extraction batch yielded lyophilized extract CAW-R61-H and spray-dried extract CAW-R61-I. CAW-R61-G and CAW-R61-I were mixed at OWH to yield the spray-dried product intermediary GK-blend. The lyophilized extracts CAW-R61-F and CAW-R61-H were mixed in a ratio mimicking GK-blend to yield CAW-R61-J2 but devoid of spray-dried matrix. The final formulated product CAP-4g was made at OWH and consisted of GK-blend mixed with several excipients that were added to provide water dispersibility, color and palatability. Each dose of CAP-4g contained GK-blend (8.8 g) equivalent to CAW-R61-J2 (4g).
Modified AIN-93M Purified Rodent diet (Dyets Inc, Bethlehem, PA, USA) was used as a base to prepare diets containing 0.2, 0.5 or 1% w/w BEN-CAW-8. CAW diets were prepared at Dyets Inc. by mixing required amounts of CAW with AIN-93M diet components until a homogenous distribution was achieved. After adding cold water (10%), the diet was run through a California Pellet Mill CL-3 lab pellet mill to create pellets, which were air dried at 27°C for 24 hours. Finally, pelleted diets were sterilized by gamma irradiation (5.0-20.0 kGy) at Sterigenics (Oak Brook, IL, USA).
2.3. Preparation of calibration standards
Stock solutions of individual standards were prepared in 95% ethanol at a concentration of 1 mg/mL. Standard mixed stock solution (50 μg/mL of each standard) was prepared by mixing each standard stock solution in 95% ethanol. An intermediate standard mixed stock solution containing 10 μg/mL of each standard and 1 μg/mL digoxin-d3 was prepared by mixing standard mixed stock solution (solution 1), 70% methanol containing 0.1% formic acid, 5 μg/mL digoxin-d3 (solution 2), and 70% methanol containing 0.1% formic acid (solution 3) (v1/v2/v3 = 1:1:3). Calibration curve working solutions were obtained by diluting intermediate standard stock solution with 70% methanol containing 0.1% formic acid and 1 μg/mL digoxin-d3 to obtain the following series of concentrations: 1, 5, 10, 25, 50, 100, 250, 500, 1000, 2500, 5000, 10,000 ng/mL for all standards. We chose 70% methanol with 0.1% formic acid to prepare the standard work solution, because we use the same solution to extract compounds from CAW and CAP.
2.4. Sample preparation of CA water extracts and derived rodent diet samples
Lyophilized CAW powder (10mg) or rodent diet (50 mg) was suspended in 70% methanol containing 0.1% formic acid and digoxin-d3 (1 μg/mL). After vortexing (30 sec), samples were sonicated at room temperature (30 min) with additional vortexing (30 sec) in between. Samples were centrifuged (14,000g, 10 min), and the supernatant transferred to a new Eppendorf tube. All samples were diluted appropriately with 70% methanol containing 0.1% formic acid and digoxin-d3 (1 μg/mL) to 100 μL before LC-MS analysis to make sure each compound concentration was located in linearity range.
2.5. Sample preparation of CAP-4g (Centella asiatica product) sachets
To quantify the 12 CA marker compounds in the CAP-4g sachets, all of the materials in each sachet were weighed and transferred to a 150 mL glass bottle. Then 100 mL of 70% methanol containing 0.1% formic acid extraction solvent was added to each flask, followed by 2 h of sonication (2h) with vigorous shaking (1 min) every 30 minutes. After vortexing (30 sec), the suspension (1 mL) was immediately transferred to a new Eppendorf tube and centrifuged (14,000g, 10 min). The supernatant was diluted with 70% methanol containing 0.1% formic acid and digoxin-d3 (1 μg/mL) to 100 μL before LC-MS analysis to make sure each compound concentration was located in linearity range.
2.6. LC-MS analysis
A Waters Xevo TQ-XS mass spectrometer coupled to a Waters Acquity UPLC I-Class system (Waters, Milford, MA) was used for LC-MRM-MS of TTs and CQAs in CA extracts and derived formulations. Twelve CA marker compounds were separated and eluted on an Inertsil Phenyl-3 column (2 μm, 2.1 x 100 mm; GL Science, Torrance, CA, USA) with a 7-minute gradient containing 0.1% formic acid in water (mobile phase A) and 0.1% formic acid in methanol (mobile phase B). The gradient elution was as follows: 0-0.1 min, 2% B; 0.1-2.5 min, 2-15% B; 2.5-3.0 min, 15-25% B; 3.0-5.0 min, 25-35% B; 5.0-6.0 min, 35-100% B; 6.0-7.0 min, 100% B. One minute equilibration was used before the next sample injection. The column was held at 55 °C, the flow rate was 0.8 mL/min. A 1μL aliquot of each sample was injected onto the column for LC-MS analysis. Using this system, separation of 12 marker compounds was achieved as shown in the LC-MRM-MS chromatogram (Figure 2).
Figure 2.
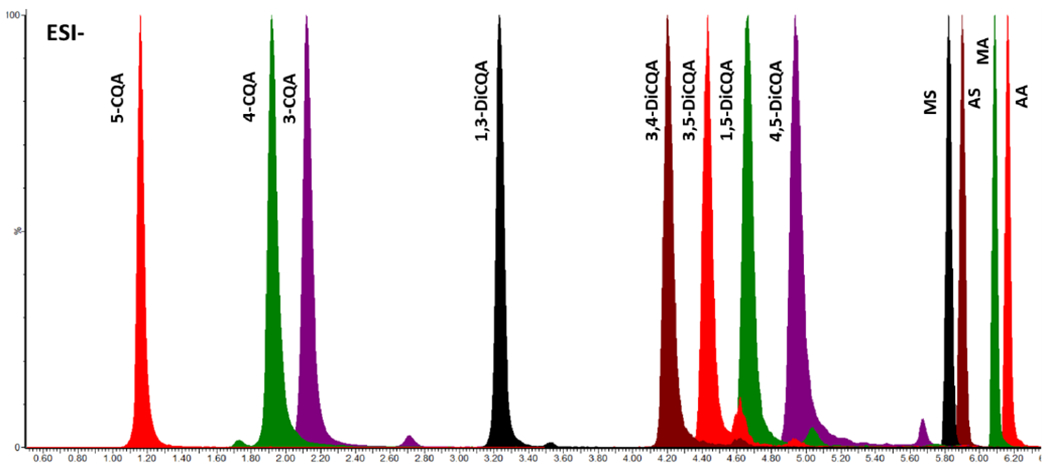
Overlaid MRM chromatograms of transition ions selected for quantitation.
All experiments were performed in negative electrospray ionization (ESI-) mode. Desolvation gas flow and cone gas flow were 1000 L/h and 150 L/h, respectively. Spray voltage and desolvation gas temperature were kept as constants and set at 2300 V and 600 °C. Scheduled MRMs were used for all 12 analytes and internal standard. Table 1 summarizes optimized MRM transitions, cone voltages and collision energies. TargetLynx Application Manager, an option within Waters MassLynx software, was applied to process all raw data files and provide accurate quantification results for the targeted compounds.
Table 1.
Optimized ionization conditions and MRM transition ions for quantification in negative ESI mode.
| Compound | Abbreviation | Formula | Q1 (m/z) | Q3 (m/z) | CV (V) | CE (eV) |
|---|---|---|---|---|---|---|
| 5-O-caffeoylquinic acids | 5-CQA | C16H18O9 | 353 | 191 | 34 | 14 |
| 4-O-caffeoylquinic acids | 4-CQA | C16H18O9 | 353 | 173 | 30 | 16 |
| 3-O-caffeoylquinic acids | 3-CQA | C16H18O9 | 353 | 191 | 38 | 20 |
| 1,3-Dicaffeoylquinic acids | 1,3-DiCQA | C25H24O12 | 515 | 179 | 46 | 28 |
| 3,4-Dicaffeoylquinic acids | 3,4-DiCQA | C25H24O12 | 515 | 173 | 48 | 28 |
| 3,5-Dicaffeoylquinic acids | 3,5-DiCQA | C25H24O12 | 515 | 191 | 42 | 28 |
| 1,5-Dicaffeoylquinic acids | 1,5-DiCQA | C25H24O12 | 515 | 191 | 38 | 36 |
| 4,5-Dicaffeoylquinic acids | 4,5-DiCQA | C25H24O12 | 515 | 173 | 38 | 32 |
| madecassoside | MS | C48H78O20 | 1019* | 973 | 62 | 22 |
| asiaticoside | AS | C48H78O19 | 1003* | 957 | 62 | 20 |
| madecassic acid | MA | C30H48O6 | 549* | 503 | 28 | 34 |
| asiatic acid | AA | C30H48O5 | 533* | 487 | 28 | 22 |
| Digoxin-d3 | NA | C41H61D3O14 | 828* | 782 | 54 | 24 |
Q1: Precursor ion
Q3: Quantifier ion
CV: Cone Voltage
CE: Collision Energy
[M+HCOO] −
NA: Not Available
2.7. Method validation
The quantitative analytical method was validated according to FDA Q2 (R1) guidelines - Validation of Analytical Procedures: Text and Methodology Guidance for Industry13. The validated characteristics of the analytical method include selectivity, linearity, accuracy, precision, range, limit of detection (LOD), limit of quantitation (LOQ), and robustness.
3. Results and Discussion
3.1. Development and optimization of the LC-MRM-MS method.
3.1.1. Column selection and LC gradient optimization.
This work is a continuation of a previous study by Dr. Maier’s group, which reported an LC-HRMS method that allows the characterization of CA aqueous extracts using mass spectral fingerprinting analysis with precursor ion (MS1) quantification 12. A drawback of the HRMS method was that TOF mass analyzers have a limited dynamic range for quantification, which made it necessary to perform two injections for each sample, a low and high concentration injection, to ensure that CQAs (low abundant compounds) and TTs (high abundant compounds) get accurately quantified. Given the encouraging results from previous studies, we chose an Inertsil Phenyl-3 column for the separation of 12 CA markers. Co-elution of MonoCQAs and DiCQAs isomers occurred, especially 4-CQA and 3-CQA were not separated in the previous method 12, complicating their identification and quantification. Therefore, we tested an LC column that uses a smaller column packing material particle size (2 μm) and narrower column inner diameter (2.1 mm) to improve sensitivity and isomer separation. We chose the same mobile phase solvents as previously (0.1% formic acid in water (A) and 0.1% formic acid in methanol (B)). We tested various elution solvent compositions for binary mixtures of A and B solvents on a shorter column (100 mm) and achieved good separation for all 12 authentic standard compounds (Figure 2). Optimized LC conditions reduced the analysis time from 35 minutes 12 to 8 minutes. Retention time for each standard was determined by injecting solutions containing single standards.
3.1.2. Effect of sample injection volume
The sample injection solvent and volume can significantly impact peak shape, especially for less retained compounds 15. A variety of injection volumes (1 μL, 3 μL, 5 μL) were tested (Figure S3), and peak fronting and broadening were observed as the injection volume increased. The first three eluting MonoCQAs showed the most distorted peak shapes (Figure S3A), where even a 3 μL sample injection showed distortion of the peak shape. One cause of peak broadening is the large difference between the sample solvent 70% methanol and the initial mobile phase 2% methanol. The peak shape can be improved by diluting the sample with water to make it more compatible with initial mobile phase composition for larger injection volumes without peak distortion. Considering that 70% methanol is used for extracting the compounds from CAW extracts and formulation, injection reproducibility and method sensitivity, we ultimately chose 1 μL as the injection volume to minimize peak distortion without the need of diluting the samples.
3.1.3. Sample cone voltage and collision energy optimization
The IntelliStart tool within Waters Masslynx software was applied to automatically optimize the sample cone voltage and collision energy of each compound. The IntelliStart fluidics system allowed us to combine the direct infusion with the mobile phase flow path to optimize instrument performance at analytical flow rates. For each compound, the direct infusion rate was 5 μL/min and the LC flow rate was 0.8 mL/min with an isocratic gradient (50:50, A:B). Each standard was prepared as single solution (1000 ng/mL) by diluting the individual standard stock solutions with 70% methanol containing 0.1% formic acid. In the initial phase of MS method development, three MRM transitions per compound were chosen for MonoCQAs and DiCQAs. Five MRM transitions were chosen for triterpenoids and digoxin-d3, because our previous data indicated that the saponins formed both deprotonated ions [M-H]− and formic acid adducted ions [M+HCOO]− in negative ionization mode 12. The optimized sample cone voltages were 100 V, 100 V, 96 V for MS, AS, and digoxin-d3 deprotonated ions [M-H]−, and 62 V, 62 V, 54 V for their formate-adducted ions [M+HCOO]−, respectively. To minimize source fragmentation, formate-adducted ions were selected as precursor ions for MS, AS, and digoxin-d3 (Table 1).
3.1.4. Strategies for choosing selective transitions for quantitation
The general rule for selecting MRM transitions for quantification is based on unique fragment ions. That is impossible in this study because isomeric MonoCQAs and DiCQAs will yield shared common fragments; however fragment ion intensity differs between CQAs 16–17. The m/z of common fragments produced by CQAs are 85, 93, 135, 173, 179, 191 in this study and proposed fragmentation schemes under negative ion mode are shown in Figure S4. Resolving LC conditions need to be combined with a selective Q1 precursor isolation and specific Q3 fragment ion selection to achieve sufficient assay specificity and accurate quantification. A resolution of two adjacent peaks Rs ≥ 1.5 under LC conditions is highly desirable when MonoCQAs and DiCQAs isomers cannot be distinguished solely by MS, as all MonoCQAs have the same precursor ion with m/z 353, and all DiCQAs have the same precursor ion m/z 515. In this work, chromatographic separation of all CQAs was accomplished under optimized LC conditions with Rs ≥ 1.5, except for one pair of isomers 3,4-DiCQA/3,5-DiCQA for which Rs = 1.45 (Table 2). The selectivity of the Q3 fragment ion over the three most sensitive MRM transitions was further checked for 3,4-DiCQA and 3,5-DiCQA. The second most abundant MRM transition ions for 3,4-DiCQA and 3,5-DiCQA are m/z 173 and m/z 191, respectively, but m/z 173 is not present in the top 3 fragments generated by 3,5-DiCQA and m/z 191 is not present in the top 3 fragments generated by 3,4-DiCQA. Although both ions can still be observed at corresponding retention times in the sample, the intensity of the m/z 173 ion from 3,4-DiCQA is about 20-fold higher compared to 3,5-DiCQA under optimized CV 48V and CE 28eV for 3,4-DiCQA (Figure S5A). On the other hand, the intensity of the m/z 191 ion is about 3-fold higher from 3,5-DiCQA compared to 3,4-DiCQA under optimized CV 42V and CE 28eV for 3,5-DiCQA (Figure S5B). Therefore, the selective signals m/z 173 and m/z 191 at the expected retention time for 3,4-DiCQA and 3,5-DiCQA were chosen as the quantifier ions to minimize quantitative interference.
Table 2.
Validation parameters for the linearity, sensitivity and selectivity of the developed LC-MRM-MS method.
| Name | Linearity range (ng/mL) | Coefficient of correlation R | LOD (ng/mL) | LOQ (ng/mL) | RT (min) | W1/2 (min) | Rs |
|---|---|---|---|---|---|---|---|
| 5-CQA | 5-10000 | 0.999 | 0.72 | 2.41 | 1.18 | 0.039 | NA |
| 4-CQA | 5-10000 | 0.992 | 0.48 | 1.61 | 1.94 | 0.072 | 8.10 |
| 3-CQA | 5-10000 | 0.998 | 1.02 | 3.41 | 2.11 | 0.056 | 1.57 |
| 1,3-DiCQA | 5-10000 | 0.998 | 0.93 | 3.12 | 3.20 | 0.056 | 11.52 |
| 3,4-DiCQA | 10-10000 | 0.999 | 1.99 | 6.63 | 4.08 | 0.063 | 8.73 |
| 3,5-DiCQA | 5-10000 | 0.999 | 1.43 | 4.75 | 4.24 | 0.067 | 1.45 |
| 1,5-DiCQA | 5-10000 | 0.999 | 0.88 | 2.94 | 4.46 | 0.070 | 1.90 |
| 4,5-DiCQA | 10-10000 | 0.999 | 2.64 | 8.79 | 4.72 | 0.081 | 2.04 |
| MS | 5-10000 | 0.999 | 1.30 | 4.32 | 5.72 | 0.041 | 9.68 |
| AS | 5-10000 | 0.999 | 1.25 | 4.15 | 5.80 | 0.040 | 1.16 |
| MA | 5-1000 | 0.990 | 1.01 | 3.36 | 5.98 | 0.038 | 2.70 |
| AA | 10-1000 | 0.995 | 1.96 | 6.55 | 6.06 | 0.036 | 1.28 |
LOD: Limit of Detection
LOQ: Limit of Quantitation
RT: Retention Time
W1/2: the width at half-height of peak
Rs: Resolution of two adjacent peaks
NA: Not Available
The deprotonated precursor ions of MA and AA are highly stable and result in poor fragmentation. As shown in Figure 3, the signal ratio between the precursor ion [M-H]− and the most sensitive fragment ion was about 100:1, even when the collision energy was increased to 70 eV (data not shown). Therefore, pseudo-MRM transitions of MA and AA were initially monitored, i.e., deprotonated precursor ions of m/z 503 and m/z 487 were selected in Q3 as well. However, the LC gradient of mobile phase solvent B, methanol with 0.1% formic acid, increased from 35% to 100% from 5 min to 6 min resulting in high chromatographic noise levels, which reduced the accuracy of integrated peak areas of MA and AA, eluting at retention times of 5.98 and 6.06 minutes, respectively (Figure 3). Accurate quantification of MA and AA at low concentrations is difficult given the relatively low content of MA and AA in aqueous extracts of CA. The formic acid adduct ion [M+HCOO]− was selected as the precursor ions for MA (m/z 549) and AA (m/z 533), while the deprotonated ion [M-H]− was selected as quantifier ions for MA (m/z 503) and AA (m/z 487), minimizing the negative effects of high chromatographic noise levels (Figure 3). Table 1 lists the final MRM transitions used to quantify each compound.
Figure 3. Top three transition ions of MA (left) and AA (right) in a standard mixture (250 ng/mL).
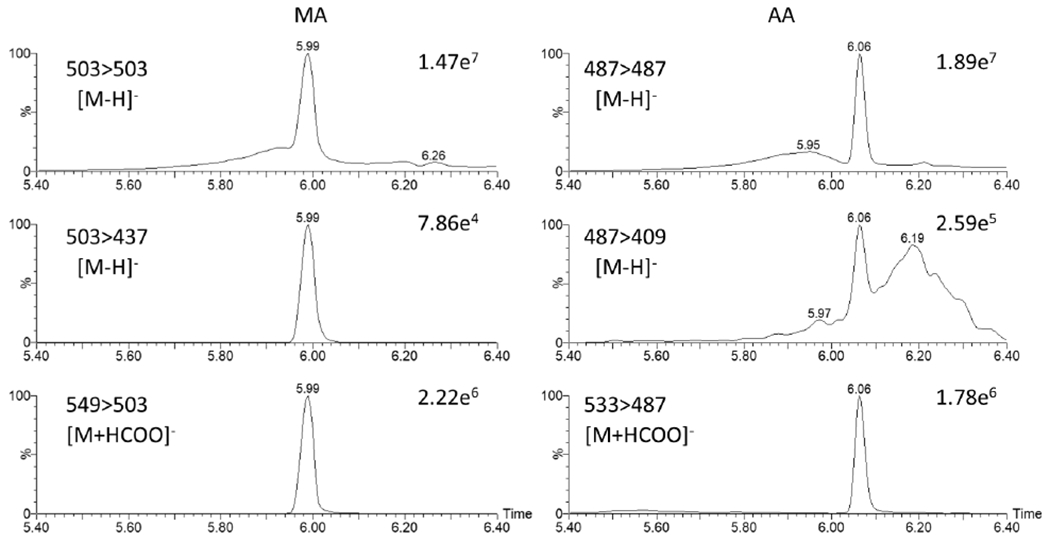
Since only about 1% deprotonated precursor ions of MA or AA can be fragmented, the formic acid adducted precursor ions 549>503 and 533>487 with better selectivity and sensitivity were selected as quantifier ions for MA and AA, respectively.
3.2. Validation of LC-MRM-MS method
3.2.1. Selectivity
The high selectivity of the developed method was achieved by combining LC separation with MS detection. The LC method was able to separate all 12 standards, and the resolution of every two adjacent peaks was calculated by the following equation, where and are the retention times and are the width at half-height (Table 2). Each targeted analyte in the samples was confirmed by comparing retention times with the tolerant limit of deviation less than 0.05 min, fragmentation patterns, and top 3 most sensitive MRM transitions with corresponding authentic standards.
3.2.2. Linearity, linear dynamic range, and sensitivity
The linearity of the calibration curves was assessed by using 12 concentrations of standards with four orders of magnitude and five replicate injections of each concentration. Considering the different amounts of individual compounds in CA, a high number of standard levels were chosen to achieve an optimal linear dynamic range for each target analyte. A linear regression model with 1/x weighting in TargetLynx software was applied to all standard curves. Correlation coefficients (R) and linear dynamic ranges for all target compounds are listed in Table 2. R ranged from 0.990 to 0.999, indicating good linearity over the considered concentration range.
LOD and LOQ were determined according to the following equations, LOD = 3σ/S and LOQ = 10σ/S, where σ is the standard deviation of the instrument response for the 1 ng/mL standard concentration of five measurements, and S is the slope of the linear calibration curve. A recently published study described a UPLC-MRM-MS method for the quantitation of TTs in positive ion mode, reporting LODs and LOQs’ ranges of 45 to 338 and 136 to 1026 ng/mL 11. In our work, LODs and LOQs range from 0.48 to 2.64 and 1.61 to 8.79 ng/mL (Table 2), demonstrating the excellent sensitivity of the developed analytical method.
3.2.3. Accuracy and precision
Accuracy of the analytical method was evaluated in triplicate at ten different concentrations. Results showed that the percentage differences (% deviation) between measured and expected concentration (Figure 4) were ≤ 15%, except for MS with 21% deviation when solutions were analyzed with a 10 ng/mL concentration. The precision was assessed by three scientists independently analyzing BEN-CAW-8 sample in triplicate over a nine-month time span, resulting in relative standard deviations (%RSD) ≤ 15% for 11 analytes, except for AA with a 19% RSD. Figure 5 graphically demonstrates the excellent inter-assay and inter-scientist precision of the developed method. To continuously monitor the analytical quality of the workflow including sample preparation and measurements and to detect systematic errors, lyophilized BEN-CAW-8 powder was selected as a control/reference material and analyzed solely for quality control (QC) purposes. The Levey-Jennings quality control chart (Figure 6) is a type of statistical process control chart that provides a visual indication of whether an analytical method works consistently well. Its y-axis is centered on the mean of all values for each analyte, with a range of ± 3 standard deviations (SD), while the x-axis is arranged in chronological order for replicate analyses. A close inspection of the QC data is triggered whenever a single QC measurement exceeds the 2SD control limit. Multiple measurements should be taken on the QC sample (BEN-CAW-8 in this case) to determine if systematic and/or random error of the method increases and accuracy and/or precision of the method changes.
Figure 4. Accuracy of the developed LC-MRM-MS method.
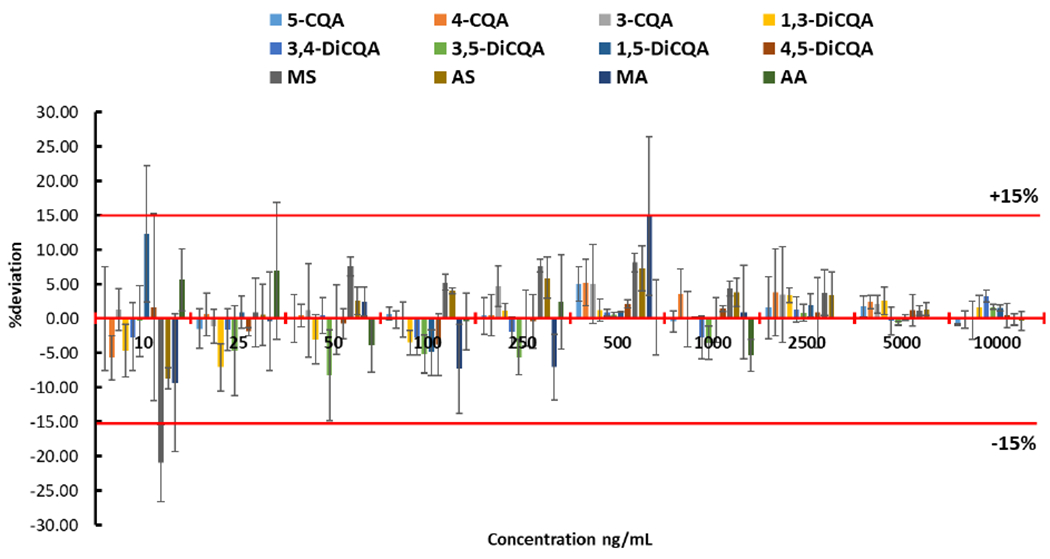
%deviation = (experimental value – theoretical value) × 100 / theoretical value
Figure 5. Precision of the developed LC-MRM-MS method.
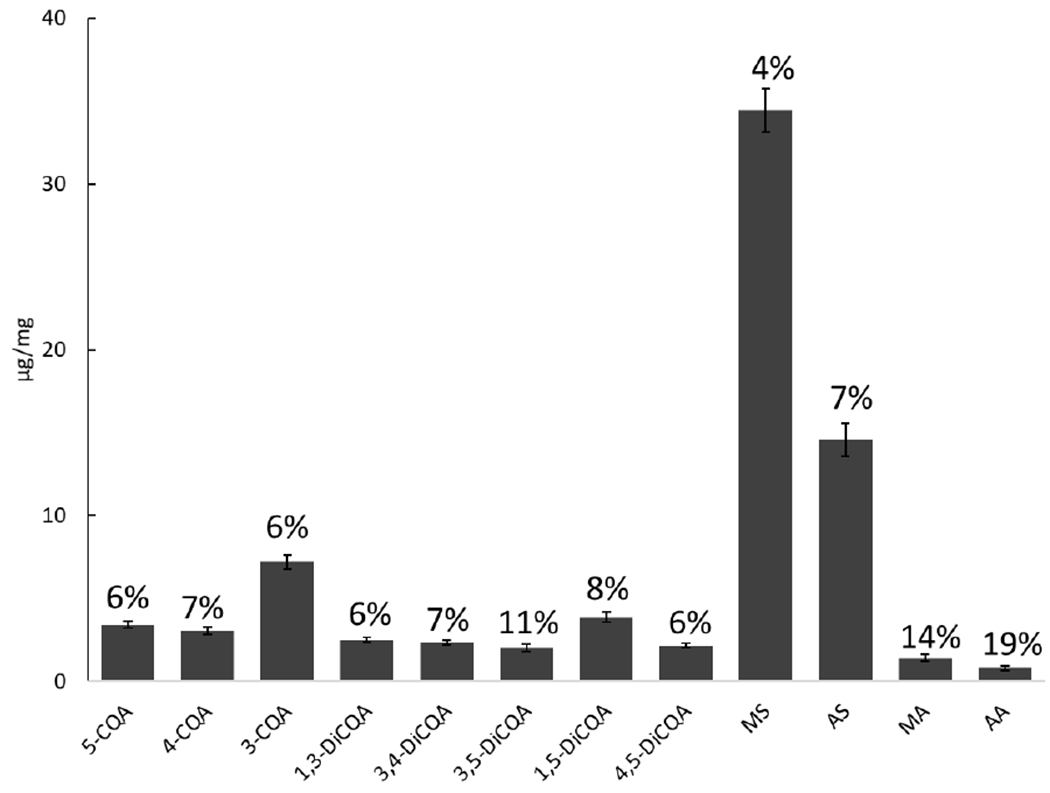
LC-MRM-MS analysis and quantitation were performed independently by three scientists on same instrument on different days in the same lab and over a nine-month time span.
Figure 6. Levey-Jennings plots for the analytical workflow.
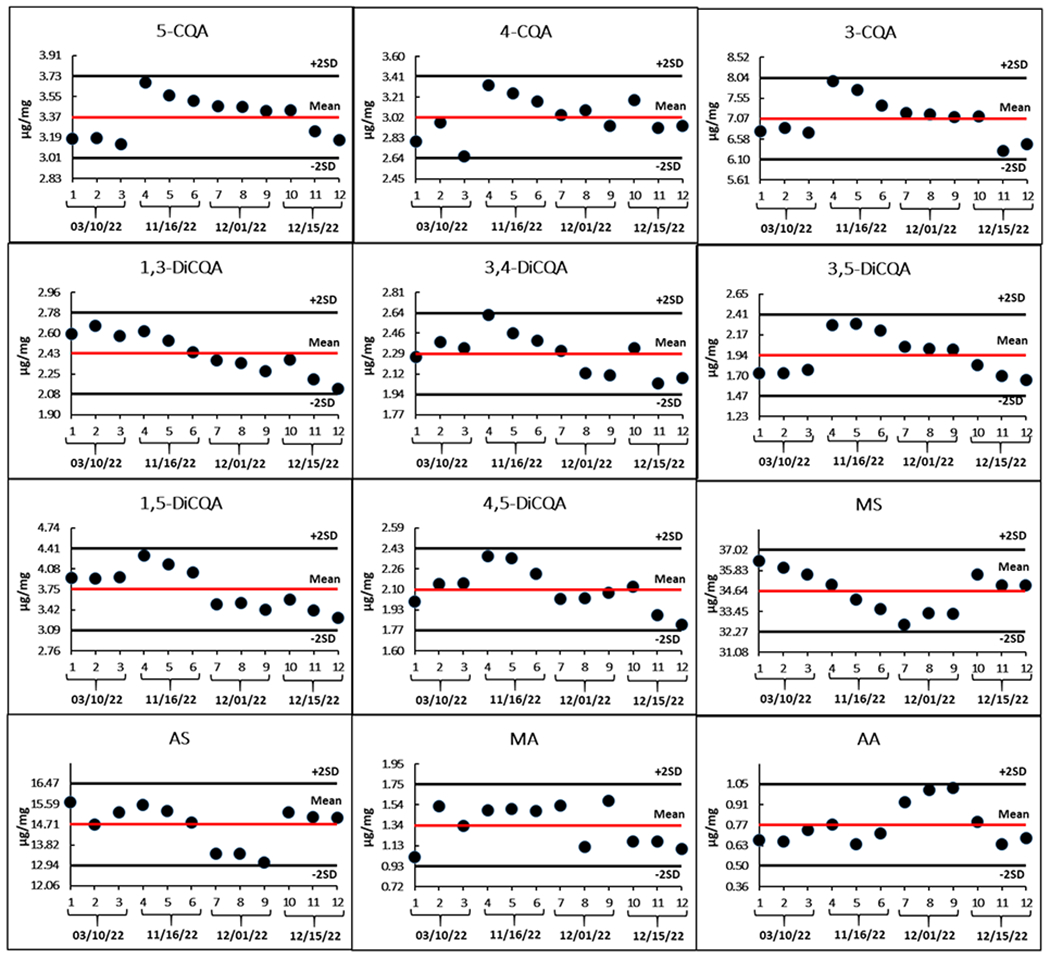
SD is the standard deviation of 12 measurements. The x-axis is in chronological order of replicate analysis. The primary unit on the y-axis is 1SD and the reported amount for each compound ranges from mean – 3SD to + 3SD.
4. Quantification of targeted bioactive compounds in CAW and derived formulations
The developed and validated method was applied to quantify the amount of 12 bioactive compounds in two CA water extract samples, BEN-CAW-8 and CAW-R61-J2 (Table 3). Our LC-MRM-assay confirms the presence of the 12 compounds targeted in both preparations, with the two triterpene glycosides, MS and AS, as the top 2 most abundant constituents, consistent with previous work 11, 18. The method clearly detected difference in the levels of CQAs and TTs levels for the two preparations; each CQA in BEN-CAW-8 is approximately 2-4 times the amount of the corresponding CQA in CAW-R61-J2 (Table 3). Of note, BEN-CAW-8 and CAW-R61-J2 were prepared from different CA plant materials.
Table 3.
Quantified content of 12 bioactive compounds in two different CA aqueous extracts, BEN-CAW-8 and CAW-R61-J2.
| Compound | Amount in BEN-CAW-8 (mg/g) |
Amount in CAW-R61-J2 (mg/g) |
|---|---|---|
| 5-CQA | 3.40 ± 0.19 | 1.81 ± 0.05 |
| 4-CQA | 3.03 ± 0.21 | 1.28 ± 0.07 |
| 3-CQA | 7.21 ± 0.42 | 2.74 ± 0.08 |
| 1,3-DiCQA | 2.49 ± 0.14 | 0.55 ± 0.03 |
| 3,4-DiCQA | 2.33 ± 0.16 | 0.83 ± 0.02 |
| 3,5-DiCQA | 2.01 ± 0.23 | 0.87 ± 0.03 |
| 1,5-DiCQA | 3.86 ± 0.30 | 0.94 ± 0.02 |
| 4,5-DiCQA | 2.15 ± 0.14 | 0.97 ± 0.03 |
| MS | 34.46 ± 1.32 | 30.23 ± 0.84 |
| AS | 14.58 ± 1.00 | 20.40 ± 0.50 |
| MA | 1.40 ± 0.20 | 2.03 ± 0.21 |
| AA | 0.79 ± 0.15 | 1.87 ± 0.33 |
A formulated rodent diet containing CAW (1% w/w) used by our group in a preclinical study to explore the role of TT and CQA in the cognitive effects of CAW demonstrated that CQA reverses cognitive deficits in male 5XFAD mice, a preclinical rodent model of Alzheimer’s disease 19. Freshly prepared rodent diet containing three different levels of BEN-CAW-8 (0.2%, 0.5% and 1% w/w), was analyzed using the newly developed LC-MRM-MS method. The levels of the 12 compounds in rodent diets were quantified and normalized to levels in BEN-CAW-8 for dose determination. A good correlation between the expected and measured content of compounds was observed (Figure 7), indicating successful and uniform manufacture of the three doses.
Figure 7. Comparison of the BEN-CAW-8 content in rodent diet based on analysis of the 12 targeted compounds.
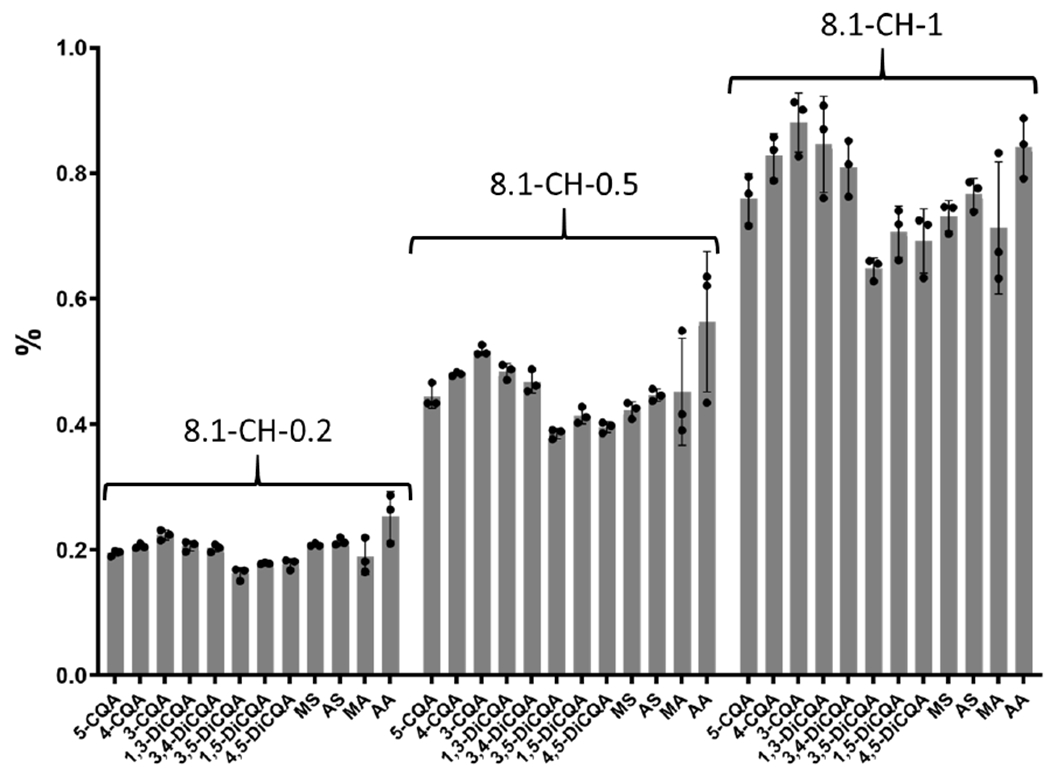
Compound content in each diet was normalized to its content measured in BEN-CAW-8. The y-axis shows the % of BEN-CAW-8 corresponding to the measured content of each compound. The headings 8.1-CH-0.2, 8.1-CH-0.5 and 8.1-CH-1 represent rodent diets prepared to contain 0.2, 0.5 and 1% w/w CAW (i.e. 2, 5, or 10 mg CAW per g rodent diet) respectively. The content of the 12 targeted compounds demonstrated the correct amount of BEN-CAW-8 in each diet.
Since the dispensed dose of CAP-4g will be dissolved in water and administered as a single bolus to clinical trial participants 20, it was necessary to test whether the levels of TTs and CQAs extracted by 70% methanol with 0.1% formic acid represent the level at which they are extracted by pure water. CAW-R61-J2 was prepared by the two different solvents above and analyzed by LC-MRM-MS. The amount of MA and AA in CAW-R61-J2 analytical sample prepared with 70% methanol containing 0.1% formic acid increased more than 5-fold, while the amount of CQAs, MS, and AS decreased slightly (less than 10%) compared to that prepared with water (Figure S6). These data suggested that the aglycones, AA and MA, are more soluble in 70% methanol containing 0.1% formic acid than in water. Comparative steady-state bioavailability studies of AA suggested that the therapeutic effects of AS may be mediated through in vivo conversion to AA 21. Another study indicated that AA can be easily produced by hydrolyzing the sugar moiety of AS structure under acidic conditions 22. A ~2-fold increase in MA and AA was also observed in the GK-blend when prepared from CAW-R61-J2 by a spray-drying process (Figure 8), suggesting that AA and MA levels are disproportionately skewed by possible hydrolysis of the high abundant glycosides, AS and MS, during spray-drying 14. However, there was no significant difference in the content of the 12 targeted compounds in the two derivative formulations, GK-blend and CAP-4g (Figure 8). Considering that human gastric acid has a pH range of 1.5-2.0, these results emphasize the importance of assessing the biological activity of each triterpene individually.
Figure 8. Comparison of the amount of the 12 targeted compounds in CA extracts and related samples.
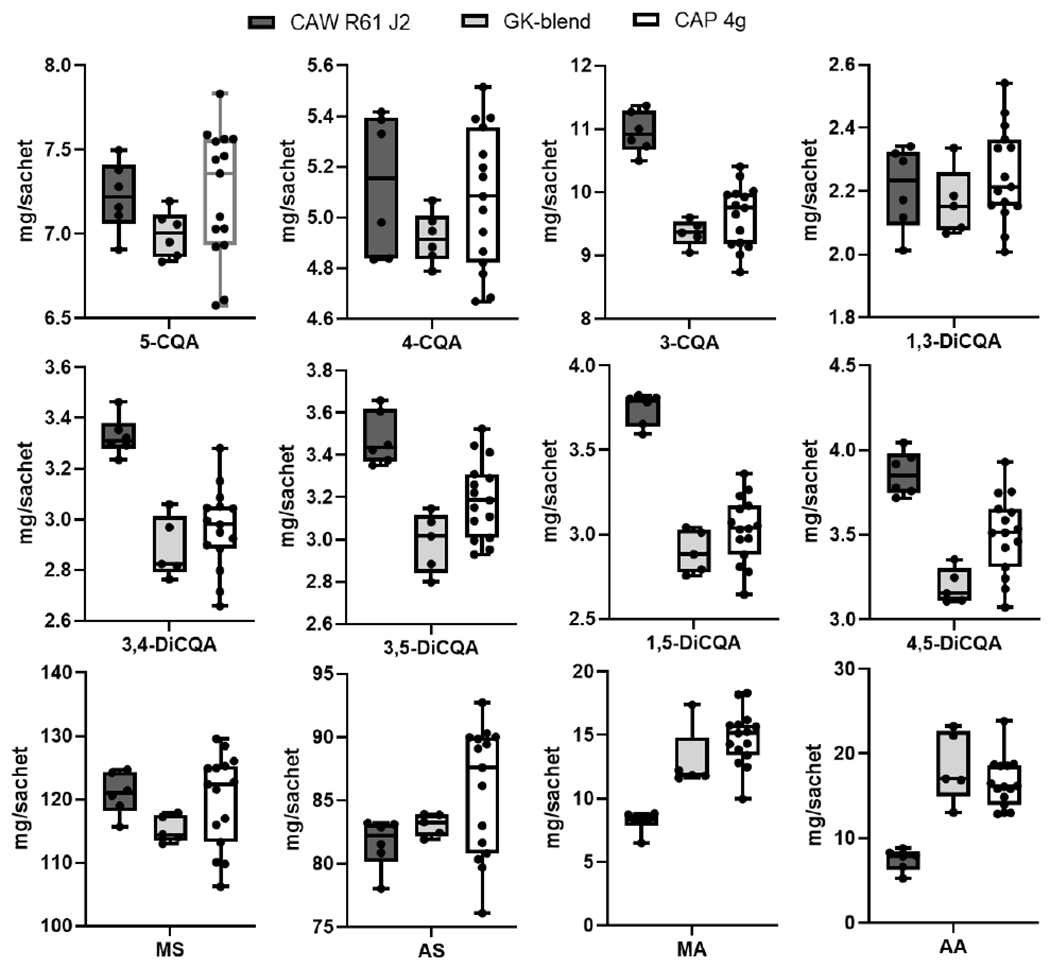
CAW-R61-J2 is a CA aqueous extract. GK-blend is prepared by spray-drying CAW-R61-J2 on a carrier. Analysis confirmed that 8.8 g GK-blend contains 4.0 grams of CAW-R61-J2. Each CAP-4g sachet weighs 14.75 grams and contains 8.8 grams of GK blend. The amount of each compound in CAW-R61-J2 and GK-blend is normalized to a single sachet by times 4.0 and 8.8 respectively.
Overall, the LC-MRM-MS method developed and validated in this work can be used as a quality control method to quantify the amount of 12 bioactive compounds from crude CA material and derived formulations to support the standardization of CA extract used in preclinical studies and clinical trials.
5. Conclusion and perspective
To conclude, a new rapid, sensitive, selective and accurate LC-MRM-MS method was developed and validated for the quantitative analysis of 12 targeted bioactive compounds in only 8 minutes and successfully applied to aqueous extracts of CA and other related products. For some isomeric CQAs, we carefully selected the LC-MRM-MS quantifier ions by comparing the top 3 most abundant fragments between every two adjacent peaks. While not all of the most abundant ions were selected as quantifiers, which could reduce the sensitivity of the method, optimization of the LC conditions exhibited high selectivity for all CQAs, which improved the sensitivity of the method.
Our group has described a robust, scientific approach for developing a rational phytotherapeutic product based on CAW for human investigation 14. Formulated CAP-4g has been used in a phase I, double-blind, randomized clinical trial to explore the oral bioavailability and pharmacokinetics of TTs and CQAs in cognitively impaired older adults treated with cholinesterase inhibitors 20. For ongoing clinical trials 14,20, the high sensitivity of the LC-MRM-MS method developed in this work allows determination of the concentrations of bioactive compounds in CAW and their potential metabolites in biological sample matrices such as plasma, urine, and tissue. Another application of this method is to monitor the quality of formulated animal foods used in preclinical studies. A prerequisite for the aforementioned applications is that the method needs to be validated in biological sample matrices, which are distinct matrices from extracts and preparations described in this study. Furthermore, as sample analysis time is shortened to 8 minutes compared to our previous method 12, this method will help save money and labor, and in addition also reduce the consumption of organic solvent, and thereby help reducing environmental pollution.
Supplementary Material
Acknowledgement
The authors acknowledge the BENFRA Botanical Dietary and Supplement research Center (NIH/NCCIH U19AT010829), the NIH/NCCIH T32002688 training grant, the NIH/NCCIH R61AT009628, and the Oregon State University Mass Spectrometry Center. The purchase of the Waters Xevo TQXS mass spectrometer was made possible by NIH grant S10OD026922. We also thank The University of British Columbia Metabolomics Core of The Life Sciences Institute in Vancouver, BC, Canada, for measuring the CCS. Mass spectrometry infrastructure for measuring the CCS values was supported by the Canada Foundation for Innovation, the BC Knowledge Development Fund, Genome Canada and Genome BC (264PRO).
Footnotes
Declaration of Competing Interest
The authors declare that they have no known competing interests.
References
- (1).Yousaf Shahzia , M. A. H, Rafia Rehman, Muhammad Waqar Azeem, Anca Racoti Indian Pennywort. Medicinal Plants of South Asia 2020.DOI: 10.1016/B978-0-08-102659-5.00032-X [DOI] [Google Scholar]
- (2).Tripathy S; Verma DK; Thakur M; Chakravorty N; Singh S;Srivastav PP, Recent trends in extraction, identification and quantification methods of Centella asiatica phytochemicals with potential applications in food industry and therapeutic relevance: A review. Food Biosci 2022, 49.DOI: 10.1016/i.fbio.2022.101864 [DOI] [Google Scholar]
- (3).Yingngam B; Chiangsom A;Brantner A, Modeling and optimization of microwave-assisted extraction of pentacyclic triterpenes from Centella asiatica leaves using response surface methodology. Ind Crop Prod 2020, 147.DOI: 10.1016/undcrop.2020.112231 [DOI] [Google Scholar]
- (4).Soumyanath A; Zhong YP; Gold SA; Yu X; Koop DR; Bourdette D;Gold BG, Centella asiatica accelerates nerve regeneration upon oral administration and contains multiple active fractions increasing neurite elongation in-vitro. J Pharm Pharmacol 2005, 57 (9), 1221–9.DOI: 10.1211/ipp.57.9.0018 [DOI] [PubMed] [Google Scholar]
- (5).Gray NE; Alcazar Magana A; Lak P; Wright KM; Quinn J; Stevens JF; Maier CS;Soumyanath A, Centella asiatica - Phytochemistry and mechanisms of neuroprotection and cognitive enhancement. Phytochemistry reviews : proceedings of the Phytochemical Society of Europe 2018, 17 (1), 161–194.DOI: 10.1007/s11101-017-9528-y [DOI] [PMC free article] [PubMed] [Google Scholar]
- (6).Matthews DG; Caruso M; Murchison CF; Zhu JY; Wright KM; Harris CJ; Gray NE; Quinn JF;Soumyanath A, Centella Asiatica Improves Memory and Promotes Antioxidative Signaling in 5XFAD Mice. Antioxidants (Basel) 2019, 8 (12).DOI: 10.3390/antiox8120630 [DOI] [PMC free article] [PubMed] [Google Scholar]
- (7).Gray NE; Morre J; Kelley J; Maier CS; Stevens JF; Quinn JF;Soumyanath A, Caffeoylquinic acids in Centella asiatica protect against amyloid-beta toxicity. J Alzheimers Dis 2014, 40 (2), 359–73.DOI: 10.3233/JAD-131913 [DOI] [PMC free article] [PubMed] [Google Scholar]
- (8).Mikami Y;Yamazawa T, Chlorogenic acid, a polyphenol in coffee, protects neurons against glutamate neurotoxicity. Life Sci 2015, 139, 69–74.DOI: 10.1016/nfs.2015.08.005 [DOI] [PubMed] [Google Scholar]
- (9).Kim JY; Lee HK; Hwang BY; Kim S; Yoo JK;Seong YH, Neuroprotection of Ilex latifolia and caffeoylquinic acid derivatives against excitotoxic and hypoxic damage of cultured rat cortical neurons. Arch Pharm Res 2012, 35 (6), 1115–22.DOI: 10.1007/s12272-012-0620-y [DOI] [PubMed] [Google Scholar]
- (10).Wianowska D;Gil M, Recent advances in extraction and analysis procedures of natural chlorogenic acids. Phytochemistry Reviews 2019, 18 (1), 273–302.DOI: 10.1007/s11101-018-9592-y [DOI] [Google Scholar]
- (11).Sabaragamuwa R; Perera CO;Fedrizzi B, Ultrasound assisted extraction and quantification of targeted bioactive compounds of Centella asiatica (Gotu Kola) by UHPLC-MS/MS MRM tandem mass spectroscopy. Food chemistry 2022, 371, 131187.DOI: 10.1016/i.foodchem.2021.131187 [DOI] [PubMed] [Google Scholar]
- (12).Alcazar Magana A; Wright K; Vaswani A; Caruso M; Reed RL; Bailey CF; Nguyen T; Gray NE; Soumyanath A; Quinn J; Stevens JF;Maier CS, Integration of mass spectral fingerprinting analysis with precursor ion (MS1) quantification for the characterisation of botanical extracts: application to extracts of Centella asiatica (L.) Urban. Phytochemical analysis : PCA 2020, 31 (6), 722–738.DOI: 10.1002/pca.2936 [DOI] [PMC free article] [PubMed] [Google Scholar]
- (13).FDA, Q2(R1) Validation of Analytical Procedures: Text and Methodology Guidance for Industry. FDA, Ed. 2021; Vol. Q2(R1). https://www.fda.gov/regulatory-information/search-fda-guidance-documents/q2r1-validation-analytical-procedures-text-and-methodology-guidance-industry [Google Scholar]
- (14).Wright KM; McFerrin J; Alcazar Magana A; Roberts J; Caruso M; Kretzschmar D; Stevens JF; Maier CS; Quinn JF;Soumyanath A, Developing a Rational, Optimized Product of Centella asiatica for Examination in Clinical Trials: Real World Challenges. Frontiers in nutrition 2021, 8, 799137.DOI: 10.3389/fnut.2021.799137 [DOI] [PMC free article] [PubMed] [Google Scholar]
- (15).Novakova L; Perrenoud AG; Francois I; West C; Lesellier E;Guillarme D, Modern analytical supercritical fluid chromatography using columns packed with sub-2 mum particles: a tutorial. Analytica chimica acta 2014, 824, 18–35.DOI: 10.1016/i.aca.2014.03.034 [DOI] [PubMed] [Google Scholar]
- (16).Alcazar Magana A; Kamimura N; Soumyanath A; Stevens JF;Maier CS, Caffeoylquinic acids: chemistry, biosynthesis, occurrence, analytical challenges, and bioactivity. Plant J 2021, 107 (5), 1299–1319.DOI: 10.1111/tpj.15390 [DOI] [PMC free article] [PubMed] [Google Scholar]
- (17).Willems JL; Khamis MM; Mohammed Saeid W; Purves RW; Katselis G; Low NH;El-Aneed A, Analysis of a series of chlorogenic acid isomers using differential ion mobility and tandem mass spectrometry. Analytica chimica acta 2016, 933, 164–74.DOI: 10.1016/i.aca.2016.05.041 [DOI] [PubMed] [Google Scholar]
- (18).Alqahtani A; Tongkao-on W; Li KM; Razmovski-Naumovski V; Chan K;Li GQ, Seasonal Variation of Triterpenes and Phenolic Compounds in Australian Centella asiatica (L.) Urb. Phytochem Analysis 2015, 26 (6), 436–443.DOI: 10.1002/pca.2578 [DOI] [PubMed] [Google Scholar]
- (19).Matthews DG; Caruso M; Alcazar Magana A; Wright KM; Maier CS; Stevens JF; Gray NE; Quinn JF;Soumyanath A, Caffeoylquinic Acids in Centella asiatica Reverse Cognitive Deficits in Male 5XFAD Alzheimer’s Disease Model Mice. Nutrients 2020, 12 (11).DOI: 10.3390/nu12113488 [DOI] [PMC free article] [PubMed] [Google Scholar]
- (20).Wright KM; Bollen M; David J; Speers AB; Brandes MS; Gray NE; Alcazar Magana A; McClure C; Stevens JF; Maier CS; Quinn JF;Soumyanath A, Pharmacokinetics and Pharmacodynamics of Key Components of a Standardized Centella asiatica Product in Cognitively Impaired Older Adults: A Phase 1, Double-Blind, Randomized Clinical Trial. Antioxidants (Basel) 2022, 11 (2).DOI: 10.3390/antiox11020215 [DOI] [PMC free article] [PubMed] [Google Scholar]
- (21).Rush WR; Murray GR;Graham DJM, The Comparative Steady-State Bioavailability of the Active Ingredients of Madecassol. Eur J Drug Metab Ph 1993, 18 (4), 323–326.DOI: 10.1007/Bf03190180 [DOI] [PubMed] [Google Scholar]
- (22).Borhan MZ, A. R, Rusop M, Abdullah S,, Green Extraction: Enhanced Extraction Yield of Asiatic Acid from Centella asiatica (L.) Nanopowders. Journal of Applied Chemistry 2013, 2013.DOI: 10.1155/2013/460168 [DOI] [Google Scholar]
Associated Data
This section collects any data citations, data availability statements, or supplementary materials included in this article.


