Abstract
The coexistence of Sjögren’s syndrome (SS) and Hashimoto thyroiditis (HT) has been confirmed, but the common mechanism of its co-occurrence remains unknown. This study aims to further explore the underlying mechanism and biomarkers for the co-occurrence of SS and HT. The Gene Expression Omnibus databases were used to obtain gene expression profiles for SS (GSE127952 and GSE23117) and HT (GSE29315 and GSE138198). Following identifying SS and HT’s shared differentially expressed genes, functional annotation, protein–protein interaction network creation, and module assembly were performed to discover hub genes. H&E staining and immunohistochemistry were performed to validate the expression of the hub genes in salivary glands. Finally, the receiver operating characteristic (ROC) curve was utilized to assess the discrimination of the hub genes as biomarkers in predicting SS, this study applied CIBERSORTx to analyze the immune infiltration in SS and HT in addition. A total of 48 common differentially expressed genes (48 upregulated genes and 0 downregulated genes) were chosen for further investigation. We analyzed the expression and function of PTPRC, CD69, IKZF1, and lymphocyte cytosolic protein 2 via H&E, immunohistochemistry, and ROC analysis. The 4 hub genes were mainly enriched in the T-cell receptor signaling pathway. We then evaluated and verified the diagnosis value of 4 hub genes in clinical minor labial gland biopsy of SS with HT, SS without HT, and non-SS. ROC analysis revealed that the 4 hub genes had a strong diagnostic value. Our study showed the common pathogenesis of SS and HT. These hub genes and diagnostic models may put forward some new insights for diagnosing and treating SS complicated with HT.
Keywords: complications, diagnostic model, Hashimoto thyroiditis, hub genes, Sjögren’s syndrome
1. Introduction
Sjögren’s syndrome (SS) is a typical systemic autoimmune illness by salivary glands and lacrimal glands focal lymphocytic infiltration, resulting in dryness of the mouth and eyes.[1] The etiology and pathogenesis of SS are complicated, in which autoimmune responses based on genetic susceptibility, epigenetics, and environmental risk factors play a crucial role.
HT is characterized by the presence of thyroid-specific autoantibodies and is one of the most common autoimmune diseases. Due to the autoimmune destruction of this gland, a gradual thyroid insufficiency in affected patients. HT is characterized by an immune response of Th1 cells, where the attack of T cells on the thyroid gland leads to an inflammatory response and overexposure of thyroid antigens, resulting in the secondary production of thyroid peroxidase antibody(TG-Ab) and thyroglobulin antibody (TPO-Ab).[2] Current studies have confirmed that primary Sjogren syndrome (pSS) can be associated with organ-specific autoimmune diseases and complicated by systemic involvement, such as primary biliary cholangitis, autoimmune thyroiditis, pulmonary fibrosis, and so on.[3] A retrospective study of 467 patients with pSS found that the prevalence of Hashimoto thyroiditis (HT) in patients with pSS was about 6.28%, while the prevalence of HT in the general population was only 1 to 2%, which is much lower than that in patients with SS.[4] Based on this, we speculate that pSS patients may have some predisposing factors that make them more susceptible to HT.
Although the exact causes of SS and HT have not been fully clarified, SS and autoimmune thyroid diseases represented by HT have many genetic and immunopathological similarities and have some common characteristics.[5] For example, Both SS and HT are associated with the same environmental factors including viral infections, cigarette smoking, alcohol intake, and stress.[6,7] Both labial glands and thyroid tissues under pathological conditions have lymphocyte infiltration, especially CD4+T lymphocytes.[8]
Based on the histological function correlation between SS and HT and the similarities in environmental factors and pathogenesis, we surmised that there may be common genetic susceptibility factors and pathogenic pathways. Therefore, we analyzed the gene expression databases of 2 salivary glands and 2 thyroid glands via bioinformatics analysis, and further confirmed the coexpression of key genes in SS and HT. Then, we investigated the underlying mechanism of these genes and confirmed their expression in salivary gland biopsy samples. Finally, the receiver operating characteristic (ROC) curve was used to evaluate the veracity and reliability of the hub markers in diagnosing SS. The hub genes and diagnostic model identified between SS and HT are expected to provide a new understanding of the underlying mechanisms of the co-occurrence of SS and HT, and help to formulate early diagnostic strategies, prognostic markers and therapeutic targets.
2. Materials and methods
2.1. Gene expression omnibus datasets and the identification of differentially expressed genes
The thyroid glands and salivary glands gene expression profiles of GSE29315 (n = 6 HT, n = 8 control), GSE138198 (n = 12 HT, n = 3 control), GSE127952 (n = 8 SS, n = 6 control), and GSE23117 (n = 11 SS, n = 4 control) were collected from Gene Expression Omnibus (GEO) (https://www.ncbi.nlm.nih.gov/). We used GEO2R online software (http://www.ncbi.nlm.nih.gov/geo/geo2r) to analyze GSE29315, GSE138198, GSE127952, and GSE23117 databases and identified the differentially expressed genes (DEGs). A P value <.05 and log | FC | ≥1 were set as the cutoff criteria for DEGs. Genes with a log | FC | ≥1 were regarded as upregulated genes, and those with a log | FC | ≤–1 were regarded as downregulated genes.
2.2. DEGs enrichment analyses
To further illustrate the function of DEGs, gene ontology (GO), and Kyoto Encyclopedia of Genes and Genomes (KEGG) pathways analyses were performed using the DAVID database (https://david.ncifcrf.gov/) and ClueGO[9] in Cytoscape 3.7.1.
2.3. Integration and analysis of protein–protein interaction networks
To explore the interaction of DEGs, we submitted the DEGs to the STRING database(http://string.embl.de/), and only validated interactions with a combined score >0.4 were selected as significant. Cytoscape software was used to visualize and analyze the PPI network. The top 20 MCC genes were calculated and identified by CytoHubba as preselected coexpressed hub genes of SS and HT.
2.4. Patients and clinical minor salivary gland biopsy samples
To validate the expression of hub genes, 24 salivary gland biopsy samples, including 9 SS with HT patients, 9 SS without HT patients, and 6 non-SS patients (Table 1), were obtained from patients admitted to The Second Affiliated Hospital, Zhejiang Chinese Medical University, Hangzhou, Zhejiang Province, China. SS patients were diagnosed by the 2016 American College of Rheumatology/European League Against Rheumatism classification criteria for pSS.[10] The diagnosis of HT mainly depends on the positive of serum TPO-Ab, TG-Ab, and the diffuse heterogeneous changes or hypoechoic changes of thyroid ultrasound.[11] The use of patient information and MSGB was sanctioned by the Ethics Committee of The Second Affiliated Hospital, Zhejiang Chinese Medical University (Ethics Approval No. 2020-KL-011–01).
Table 1.
Patients clinical and serological information.
| Type | SS with HT | SS | Non-SS | P |
|---|---|---|---|---|
| Age (years) | 54 ± 8.75 | 49 ± 16.90 | 55 ± 9.37 | 0.67 |
| Gender (% female) | 8 (88.89) | 9 (100) | 6 (100) | 0.43 |
| FS+ (%) | 9 (100) | 7 (77.78) | 0 (0) | < 0.001 |
| ANA+ (%) | 7 (77.78) | 8 (88.89) | 3 (50) | 0.24 |
| Anti-SSA+ (%) | 7 (77.78) | 7 (77.78) | 0 (0) | 0.005 |
| Anti-SSB+ (%) | 2 (22.22) | 2 (22.22) | 0 (0) | 0.465 |
| TG-Ab | 286.54 ± 410.38 | 1.53 ± 1.05 | 1.32 ± 0.90 | 0.047 |
| TPO-Ab | 224.99 ± 378.09 | 0.42 ± 0.42 | 0.17 ± 0.19 | 0.079 |
ANA+ = antinuclear antibody positive, Anti-SSA+ = Anti-Sjögren’s Syndrome A antibody positive, Anti-SSB+ = Anti-Sjögren’s Syndrome B antibody positive, FS+ = focus score ≥1, TG-Ab = thyroglobulin antibody., TPO-Ab = thyroid peroxidase antibody.
2.5. Immunohistochemical staining and validation of common hub genes
The main antibodies used for IHC were as follows: A PTPRC Rabbit IgG monoclonal antibody (ab40763), CD69 Rabbit IgG monoclonal antibody (ab233396) both from Abcam (Cambridge, 1:100; UK), and IKZF1 Rabbit IgG Polyclonal antibody (12016-A-AP), and LCP2 Rabbit IgG polyclonal antibody (12728-A-AP) both from Proteintech (Wuhan Sanying, 1:50; P.R.C.). Salivary gland samples were fixed in 10% formalin, embedded in paraffin blocks, and processed as continuous sections (4 µm thick). They were rehydrated through an alcohol gradient and stained with H&E. They were processed for antigen retrieval with EDTA Antigen Retrieval solution (pH 8.0) before blocking endogenous peroxidase activity with 3% H2O2 for 15 minutes. After incubation with PTPRC, CD69, IKZF1, and LCP2 antibodies overnight at 4°C, the sections were exposed to goat antirabbit antibodies at 37°C for 60 minutes. To assess antigen expression, each section was photographed at ×200× magnification and 5 images were taken over the entire section. Based on the staining characteristics of the immunohistochemical biomarkers, overall, nuclear and membrane expression were analyzed on Aperio ImageScope (Leica Biosystems, Germany). Positive pixel count v9 algorithm of Aperio ImageScope software was used for analysis (positive rate of immunohistochemical results = number of positives + number of strong positives)/total area). To further determine the prediction values of the positive expression rate of 4 genes for SS, ROC curves were constructed among the 3 groups. The plot area under the curve (AUC) was calculated through numerical integration of the ROC curves. The genes with the highest AUC values were the most diagnostic for SS.
2.6. Immune cell infiltration analysis using CIBERSORTx
CIBERSORTx (https://cibersortx.stanford.edu/) was used to analyze the differences in immune infiltration between SS and HT groups to evaluate the role of immune microenvironment in SS and HT formation. The results were then visualized using box-line plots.
2.7. Statistical analysis
Numerical results were presented as the means ± standard deviations or medians with interquartile ranges (IQR). Possible differences in demographic, clinical variables, and positive expression rate among the groups were evaluated by one-way analysis of variance (ANOVA) from more than 2 groups. Differences between the 2 groups were analyzed using an unpaired t-test with Welch correction. All analyses were performed using GraphPad Prism version 8.0.2 (GraphPad Software, San Diego, CA, USA) and statistical software package SPSS (version 22.0, SPSS Inc., Chicago, IL, USA). P < .05 was considered statistically significant.
3. Results
3.1. Identification of DEGs
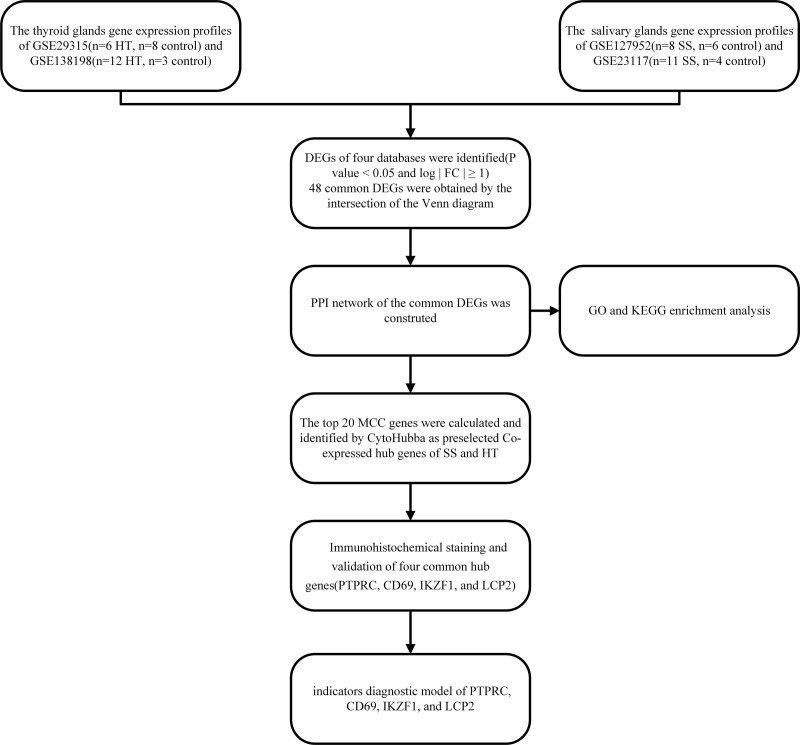
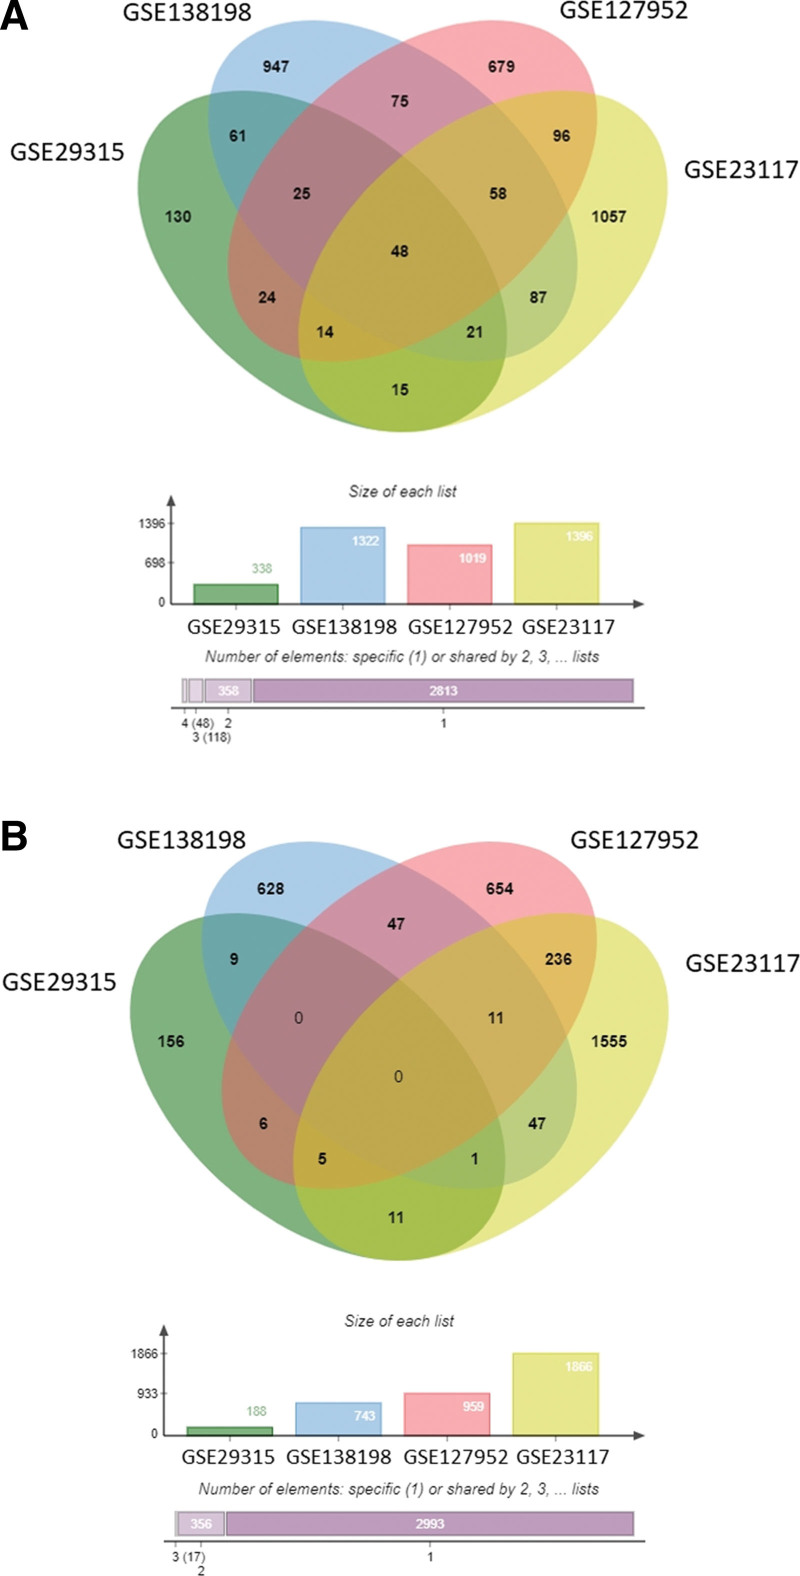
The research flow chart of this study is shown in Figure 1. Four GEO datasets, which included SS patients, HT patients, and healthy controls, were analyzed with Venn tool. From the GSE29315, GSE138198, GSE127952, and GSE23117 datasets, we identified 48 upregulated genes that did not share a common downregulated gene (Fig. 2).
Figure 1.
Research design flowchart.
Figure 2.
Venn diagrams show the DEGs in the salivary glands of patients with SS. Venn diagrams showing the upregulated DEGs (A) and downregulated DEGs (B). DEGs = differentially expressed genes.
3.2. ClueGO enrichment analysis
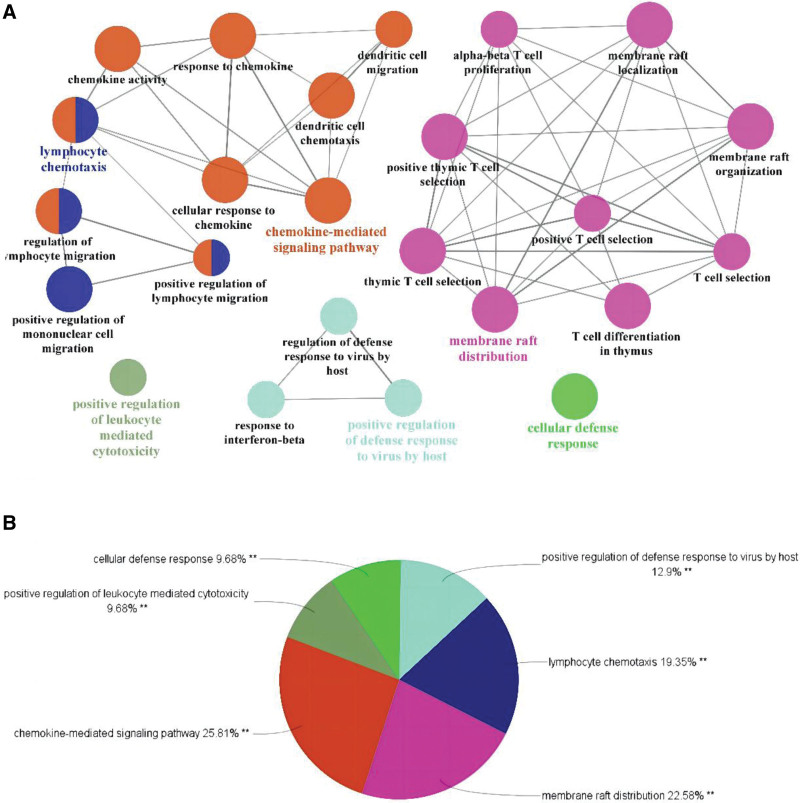
Enrichment analysis was performed on 48 cross-targets using the ClueGO v2.5.7 plugin. After setting the P value as < 0.05, Kappa Score Threshold as 0.4, and Go level as 3Minimum#Genes and 5%#Genes, we identified 24 GO terms (Fig. 3A). The upregulated DEGs were basically enriched in positive regulation of defense response to virus by host, membrane raft distribution, positive regulation of lymphocyte-mediated cytotoxicity, cellular defense response, and chemokine-mediated signaling pathway (Fig. 3B).
Figure 3.
ClueGO enrichment analysis. Significantly enriched GO terms of DEGs based on GlueGO (biological processes) and CluePedia functions (A). The pie chart of ClueGO enrichment analysis (B). DEGs = differentially expressed genes, GO = gene ontology.
3.3. The Kyoto Encyclopedia of Genes and Genomes pathway enrichment analysis of DEGs
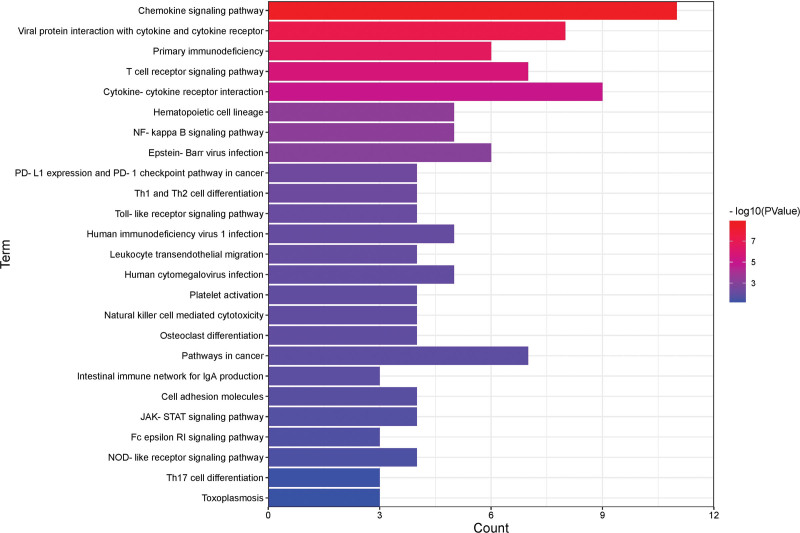
The KEGG pathway enrichment analysis identified 27 significant pathways that included 48 upregulated genes. The 5 most significantly enriched pathways were chemokine signaling pathway, viral protein interaction with cytokine and cytokine receptor, primary immunodeficiency, T-cell receptor signaling pathway, and cytokine-cytokine receptor interaction (Fig. 4).
Figure 4.
KEGG pathway terms of DEGs. A histogram of KEGG enrichment analysis of upregulated genes, which shows a gradual change in color from red to blue, indicating the change in the P value from small to large. DEGs = differentially expressed genes, KEGG = Kyoto Encyclopedia of Genes and Genomes.
3.4. Construction of PPI networks of the upregulated genes and top 20 hub genes
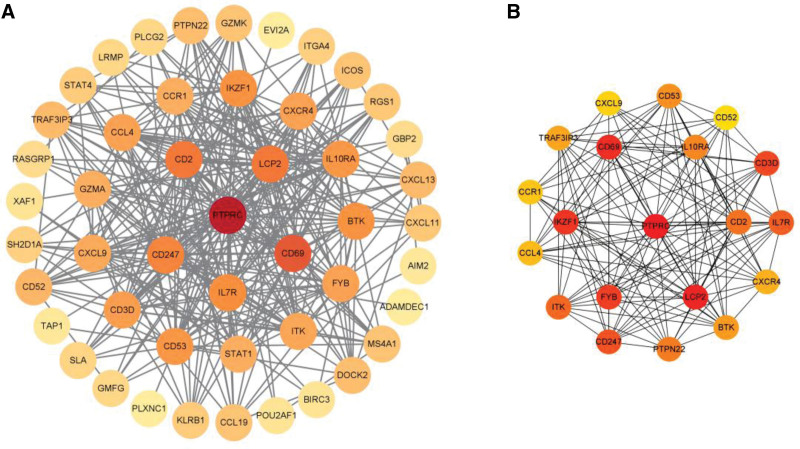
PPI networks of the DEGs were established using STRING database and Cytoscape. After removing 3 loose nodes, the PPI network contained a total of 48 nodes and 315 edges. We found the top 20 hub genes, including PTPRC, LCP2, CD69, IKZF1, FYB, CD3D, CD247, IL7R, ITK, CD2, PTPN22, IL10RA, CD53, BTK, TRAF3IP3, CXCR4, CCL4, CCR1, CXCL9, and CD52 utilizing Cytohubba based on MCC. We identified that the degree values were largest for receptor-type tyrosine-protein phosphatase C (PTPRC), lymphocyte cytosolic protein 2 (LCP2), cluster of differentiation 69 (CD69), Ikaros family zinc finger 1 (IKZF1), FYN binding protein (FYB) (Fig. 5).
Figure 5.
PPI networks for 48 upregulated DEGs (A) and the top 20 hub genes (B) were constructed using Cytoscape visualization, which shows a gradual change in color from yellow to red, indicating the change score from small to large. DEGs = differentially expressed genes, PPI = protein–protein interaction.
3.5. Immunohistochemical validation of PTPRC, LCP2, CD69, and IKZF1 as the hub genes
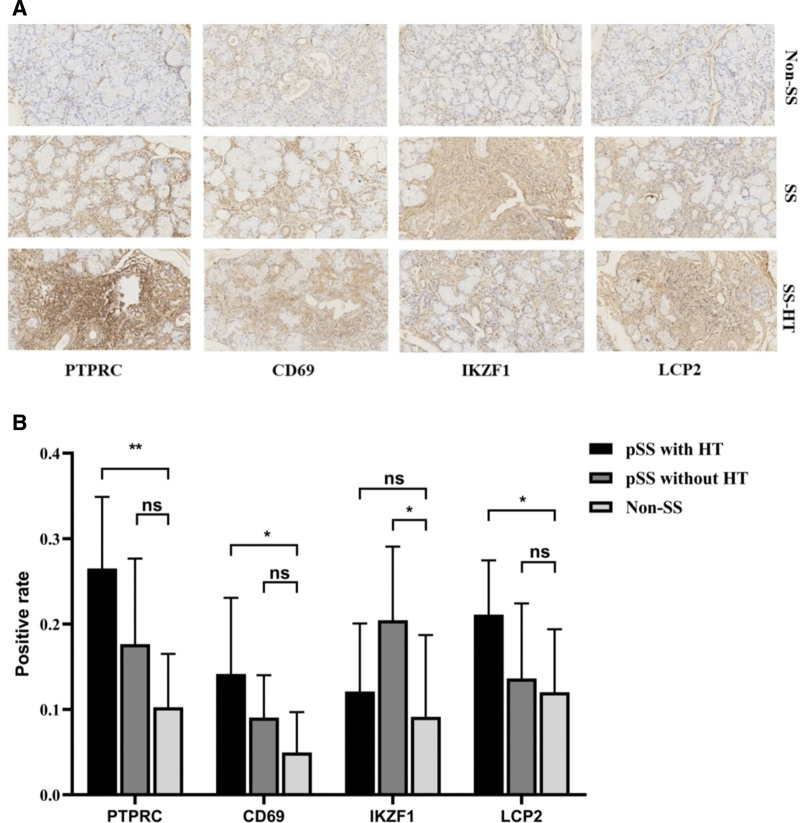
We selected MSGB samples from 9 SS with HT patients, 9 SS without HT patients, and 6 non-SS patients to verify the expression level of the PTPRC, LCP2, CD69, and IKZF1 by H&E and immunohistochemistry. Compared with non-SS patients, the expression of PTPRC, CD69, and LCP2 protein in the salivary gland of SS with HT group was significantly different from that of non-SS group, but there was no significant difference between SS without HT group and non-SS group; The expression of IKZF1 protein in SS without HT group was significantly higher than that in non-SS group, but there was no significant difference between SS with HT group and non-SS group (Fig. 6).
Figure 6.
H&E and immunohistochemical analysis of PTPRC, CD69, IKZF1, and LCP2 proteins in minor salivary gland biopsy (MSGB) staining from 9 SS with HT patients, 9 SS without HT patients, and 6 non-SS patients(magnification: ×200 for H&E staining and × 200 for IHC) (A). Blue marks the nucleus, and brown marks the target protein. The bar graph indicated medians within the quartile ranges of positive rate (B). ns, not significant, *, P < .05; **, P < .01.
3.6. Diagnostic discrimination of the selected hub genes
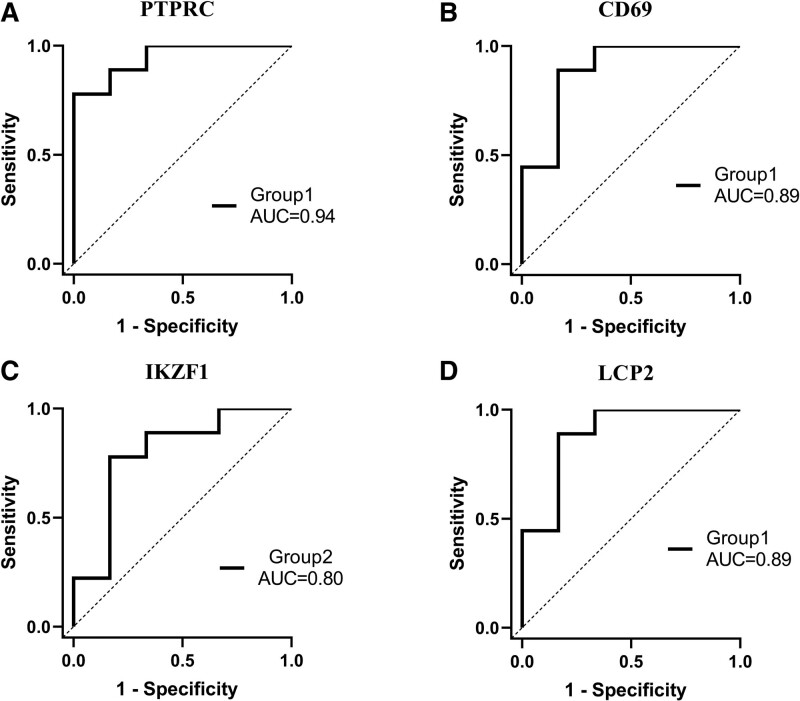
The sensitivity and specificity of these 4 hub genes as potential diagnostic biomarkers in SS patients were investigated by ROC analysis. The AUC of PTPRC in group 1 (SS with HT patients) was 0.9444 (P = .0047) (Fig. 7A). The AUC of CD69 in group 1 was 0.8889 (P = .013) (Fig. 7B). The AUC of IKZF1 in group 2 (SS without HT patients) was 0.7963 (P = .0593) (Fig. 7C). The AUC of LCP2 in group 1 was 0.8889 (P = .0133) (Fig. 7D). PTPRC, CD69, and LCP2 were shown to be able to well differentiate SS patients from non-SS.
Figure 7.
ROC curves analysis of positive rate of immunohistochemical results for 3 groups (Group 1: SS with HT patients, Group 2: SS without HT patients). (A) PTPRC, (B) CD69, (C) IKZF1, (D) LCP2. An AUC > 0.8 indicated that the predicted model had good efficacy. The AUC was also shown. AUC = area under the curve, ROC = receiver operating characteristic.
3.7. Immune cell infiltration analysis by CIBERSORTx
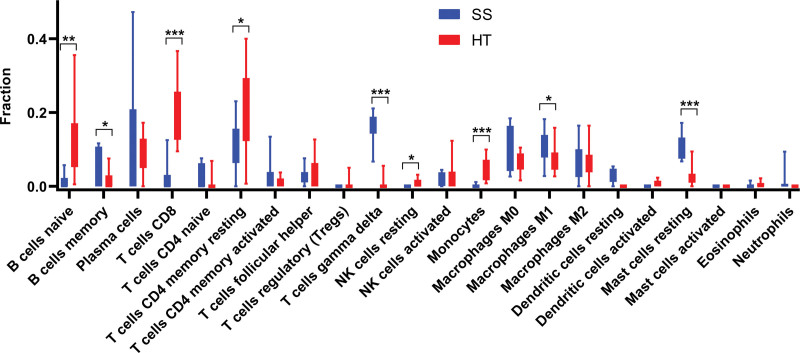
CIBERSORTx was used to identify the types of immune cells involved in the formation of SS and HT. We obtained the proprotions of 22 kinds of immune cell types between SS and HT. SS Compared with HT, the proportions of B cells memory, T cells gamma delta, macrophages M1, and mast cells resting were relatively high, while B cells naive, T cells CD8, T cells CD4 memory, T cells CD4 memory resting, monocytes, and mast cells activated were low (Fig. 8).
Figure 8.
Results of immune infiltration by CIBERSORTx. Box-plot presented the difference of immune infiltration of 22 kinds of immune cells. *P < .05; **P < .01; ***P < .001.
4. Discussion
More and more research reports have shown that patients with SS had a higher risk of HT than those without SS. A monocentric retrospective study revealed overt thyroid poly autoimmunity in 15.7% of patients with SS.[8] A large number of information have emphasized that HT and SS can be considered pathogenetically associated. It has been reported that thyroid and epithelial cells expressed the same human leukocyte antigen (HLA) molecules class II: HLA-B8 and HLA-DR3, and the tissue infiltration of the 2 disorders is mainly composed of CD4+T lymphocytes, and may formation of germinal center-like structures.[12]
Up to now, the contact mechanism between SS and HT has not been fully understood. Therefore, it is of great clinical significance to explore the molecular mechanism, early recognition, and intervention between SS and HT. This study combined bioinformatics and salivary gland validation to discover the possible copathogenesis mechanism of SS and HT. The expression of PTPRC, CD69, and LCP2 in SS patients with HT was significantly higher than that in the control group, and there was no significant difference between the expression of the above genes in SS patients without HT and that in the control group, which suggested that the above genes might be the key way of their copathogenesis, and further verified the correlation between SS and HT at the genetic level. We used cibersortX to investigate the differences in immune cell infiltration in the salivary gland of SS versus the thyroid of HT and showed that they differed significantly between B cells, CD4 T cells, and CD8 T cells, suggesting a degree of immune overlap between SS and HT patients. In this study, the pathogenic association between SS and HT was explored. Four hub genes were identified, and joint mechanisms were revealed for the co-occurrence of SS and HT.
Protein tyrosine phosphatase receptor C (PTPRC), also known as CD45, is a transmembrane glycoprotein that is a crucial regulator of antigen receptor-mediated activation of T and B cells.[13] It accounted for about 10% of the surface antigens of T and B lymphocytes.[14] PTPRC controlled immune function mainly by regulating cytokine responses and T-cell receptor (TCR) signaling, and the TCR signaling has been shown to be important in autoimmune disease pathogenesis.[15] PTPRC inhibited the Janus kinase (JAK) and negatively regulates the receptor signaling pathway of cytokines, which in turn activates signal transducer and activator of transcription (STAT) family transcription factors.[16] This suggests that PTPRC may be involved in the upstream regulation of the JAK-STAT pathway. JAK-STAT signal pathway is a signal transduction pathway that mediates the activation of various cytokines. It can lead to cell activation, proliferation, and the release of inflammatory factors, and can contribute to the differentiation of Th1 and Th17 cells. At present, the imbalance of this pathway has been found in many autoimmune diseases.[17] Recently, it has been found that JAK inhibitors can alleviate the activation of salivary gland epithelial cells, thereby relieving inflammation and lymphocyte infiltration, and improving dryness symptoms.[18] The regulation of cytokine responses is also a function of PTPRC. CD45RChigh and CD45RClow T cells produced interleukin-2 (IL-2), IL-4, IL-10, and IL-13.[19] Phenekos et al reported that the proinflammatory cytokines IL-2, IL-4, and IL-10 were distinctly raised in HT.[20] This suggests that proinflammatory cytokines may be a significant pathway for CD45 to influence the pathogenesis of HT.
CD69 belongs to the C-type lectin receptor family and is one of the early markers of T lymphocyte activation. It participated in a variety of cellular reactions in vivo and further enhances T-cell proliferation as a co-stimulatory signal. Moreover, CD69 promoted the expression of various cytokines and the synthesis, secretion, and expression of inflammatory mediators.[21] One of the important mechanisms by which CD69 exerted its immunomodulatory effect was to control the activity of Th17 and Treg.[22] CD69 expression inhibited Treg activity by upregulating transforming growth factor-β (TGF-β) in systemic sclerosis.[23] Miao et al reported that the number of Th17 cells and Treg cells in the salivary glands of pSS were positively correlated with the score of inflammation.[24] Therefore, we speculate that CD69 may lead to SS by affecting Th17/ Treg balance. In HT, CD69 cells with high expression in infiltrating T cells can activate the expression of first apoptosis signal ligand (FasL), and then destroyed thyroid cells.[25] As a marker of cell activation, CD69 may be able to judge the disease activity of SS and HT by detecting the expression of CD69 on the surface of T cells.
Ikaros family zinc finger 1 (IKZF1) is one of the most significant transcription factors that control the specificity and differentiation of lymphocytes. It regulated lymphocyte differentiation, proliferation, and self-tolerance through regulation of B-cell, T-cell, and dendritic cell signaling, which were important to maintain the immune system stability and avoid the occurrence of autoimmune diseases.[26–28] Furthermore, previous studies have shown that IKZF1 is involved in the regulation of STAT4 in human T cells.[29] Additionally, interferon regulatory factors 5 can affect the induction of inflammatory cytokines and interferon by regulating the expression of IKZF1.[30,31] Moreover, the correlation of pSS with interferon regulatory factors 5 and STAT4 has been demonstrated in GWAS.[32] Our experimental evidence further confirmed that IKZF1 is related to pSS, and it is a highly specific and sensitive biomarker. IKZF1, IRFs, and STAT4 may play a role in the pathogenesis of diseases by regulating immune-related cell activities involved in some signal pathways of pSS, such as interferon pathway. In contrast, IKZF1 has not been studied in HT, and there is no significant difference between SS with HT group and the control group in the expression of salivary gland immunohistochemistry.
Lymphocyte cytosolic protein 2 is an adapter protein-encoding gene necessary for the normal development of T cells and activation of serine phosphorylation and participates in the protein tyrosine kinase pathway activated by the TCR.[33,34] Although there are no LCP2-related studies in HT and SS, studies in other medical fields detail the function of LCP2 in immune cells. The function of LCP2 protein in T cell differentiation and activation has been reported. LCP2 protein regulated Th1 and Th2 cell function through serine phosphorylation, which was essential for T cell differentiation.[34] LCP2 played an important role in NK cell-mediated recognition of missing self-targets[35] and actively regulated antigen-induced mast cell activation by recruiting B-cell receptor (BCR).[36] These studies indicated that LCP2 was deeply involved in the immune response by regulating immune cells. The higher expression of LCP2 in the salivary gland of SS with HT group suggests that abnormal expression of LCP2 may be a factor in the development of the disease, which needs to be further investigated.
5. Conclusion
Based on the existing transcriptome data, this study provided new insights into the common pathogenesis of SS and HT. PTPRC, LCP2, and CD69 were established as pivotal genes involved in the development of SS combined with HT and integrated into the diagnostic model of SS. This may also be the genetic and molecular basis for the clinical comorbidity of SS with HT. To our knowledge, this is the first study to explore and verify the common pathogenesis of SS with HT using quantitative data of IHC. The exploration of SS combined with HT at the molecular mechanism level will help us to further understand the mechanism of abnormal inflammatory reactions and immune dysfunction in the pathogenesis of these 2 diseases. This study put forward some new ideas into the shared pathogenesis and mechanisms of the occurrence of SS and HT. Moreover, the main limitation of this study was the small sample size and the lack of genetic validation in thyroid tissue samples because of the difficulty of obtaining thyroid tissue from patients and healthy individuals.
Acknowledgments
We are indebted to all the subjects who took part in this study, and the staff of the Department of Rheumatology, The Second Affiliated Hospital, Zhejiang Chinese Medical University.
Author contributions
Conceptualization: Liying Chen, Xinchang Wang.
Data curation: Kaiyuan Zhang, Xue Yu, Xinchang Wang.
Formal analysis: Xue Yu, Tao Hong.
Investigation: Xue Yu, Dingqi Lu.
Methodology: Yunxin Zhang, Dingqi Lu, Yating Ren.
Resources: Xinchang Wang.
Software: Xinyi Yao, Liying Chen.
Validation: Kaiyuan Zhang, Yunxin Zhang, Xinyi Yao.
Writing – original draft: Kaiyuan Zhang, Yunxin Zhang, Xinchang Wang.
Writing – review & editing: Tao Hong, Yating Ren.
Abbreviations:
- ANOVA
- one-way analysis of variance
- BCR
- B-cell receptor
- CD69
- Cluster of differentiation 69
- DEGs
- differentially expressed genes
- FasL
- first apoptosis signal ligand
- FYB
- FYN binding protein
- GEO
- Gene Expression Omnibus
- GO
- gene ontology
- HLA
- human leukocyte antigen
- HT
- Hashimoto thyroiditis
- IKZF1
- Ikaros family zinc finger 1
- IL-2
- interleukin-2
- IQR
- interquartile ranges
- IRF5
- interferon regulatory factors 5
- JAK
- Janus kinase
- KEGG
- Kyoto Encyclopedia of Genes and Genomes
- LCP2
- Lymphocyte cytosolic protein 2
- MSGB
- minor labial gland biopsy
- PPI
- protein–protein interaction
- PTPRC
- Receptor-type tyrosine-protein phosphatase C
- ROC
- receiver operating characteristic
- SD
- standard deviations
- SS
- Sjögren’s syndrome
- STAT
- signal transducer and activator of transcription
- TCR
- T-cell receptor
- TG-Ab
- Thyroglobulin antibody
- TGF-β
- transforming growth factor-β
- TPO-Ab
- Thyroid peroxidase antibody
KZ and XY have contributed equally to this work.
How to cite this article: Zhang K, Yu X, Zhang Y, Lu D, Yao X, Hong T, Ren Y, Chen L, Wang X. Identification of key genes in salivary gland in Sjögren’s syndrome complicated with Hashimoto thyroiditis: Common pathogenesis and potential diagnostic markers. Medicine 2023;102:39(e35188).
This research was supported by National Natural Science Foundation of China (82074341).
This study was performed in accordance with the Declaration of Helsinki. Approval was obtained from the Institutional Ethics Committee of The Second Affiliated Hospital, Zhejiang Chinese Medical University (No.2020-KL-011-01).
Written informed consent for participation was obtained from the patients.
The authors have no conflicts of interest to disclose.
All data generated or analyzed during this study are included in this published article [and its supplementary information files].
Contributor Information
Kaiyuan Zhang, Email: 201612201502010@zcmu.edu.cn.
Xue Yu, Email: y17862968393@163.com.
Yuxin Zhang, Email: 201612201502010@zcmu.edu.cn.
Dingqi Lu, Email: ludingqi745@163.com.
Xinyi Yao, Email: xy18868113715@163.com.
Tao Hong, Email: 799815826@qq.com.
Yating Ren, Email: renjunor@163.com.
Liying Chen, Email: m17816890513@163.com.
References
- [1].Negrini S, Emmi G, Greco M, et al. Sjögren’s syndrome: a systemic autoimmune disease. Clin Exp Med. 2022;22:9–25. [DOI] [PMC free article] [PubMed] [Google Scholar]
- [2].Ralli M, Angeletti D, Fiore M, et al. Hashimoto’s thyroiditis: An update on pathogenic mechanisms, diagnostic protocols, therapeutic strategies, and potential malignant transformation. Autoimmun Rev. 2020;19:102649. [DOI] [PubMed] [Google Scholar]
- [3].Sambataro D, Sambataro G, Dal Bosco Y, et al. Present and future of biologic drugs in primary Sjögren’s syndrome. Expert Opin Biol Ther. 2017;17:63–75. [DOI] [PubMed] [Google Scholar]
- [4].Zeher M, Horvath IF, Szanto A, et al. Autoimmune thyroid diseases in a large group of Hungarian patients with primary Sjögren’s syndrome. Thyroid. 2009;19:39–45. [DOI] [PubMed] [Google Scholar]
- [5].Agha-Hosseini F, Shirzad N, Moosavi MS. Evaluation of xerostomia and salivary flow rate in Hashimoto’s thyroiditis. Med Oral Patol Oral Cir Bucal. 2016;21:e1–5. [DOI] [PMC free article] [PubMed] [Google Scholar]
- [6].Antonelli A, Ferrari SM, Corrado A, et al. Autoimmune thyroid disorders. Autoimmun Rev. 2015;14:174–80. [DOI] [PubMed] [Google Scholar]
- [7].Bjork A, Mofors J, Wahren-Herlenius M. Environmental factors in the pathogenesis of primary Sjogren’s syndrome. J Intern Med. 2020;287:475–92. [DOI] [PubMed] [Google Scholar]
- [8].Anaya JM, Restrepo-Jimenez P, Rodriguez Y, et al. Sjogren’s syndrome and autoimmune thyroid disease: two sides of the same coin. Clin Rev Allergy Immunol. 2019;56:362–74. [DOI] [PubMed] [Google Scholar]
- [9].Bindea G, Mlecnik B, Hackl H, et al. ClueGO: a Cytoscape plug-in to decipher functionally grouped gene ontology and pathway annotation networks. Bioinformatics. 2009;25:1091–3. [DOI] [PMC free article] [PubMed] [Google Scholar]
- [10].Shiboski CH, Shiboski SC, Seror R, et al. International Sjögren's Syndrome Criteria Working Group. 2016 American College of Rheumatology/European League Against Rheumatism Classification Criteria for Primary Sjögren’s syndrome: a consensus and data-driven methodology involving three international patient cohorts. Arthritis Rheumatol (Hoboken, NJ). 2017;69:35–45. [DOI] [PMC free article] [PubMed] [Google Scholar]
- [11].Caturegli P, De Remigis A, Rose NR. Hashimoto thyroiditis: clinical and diagnostic criteria. Autoimmun Rev. 2014;13:391–7. [DOI] [PubMed] [Google Scholar]
- [12].Amador-Patarroyo MJ, Arbelaez JG, Mantilla RD, et al. Sjögren’s syndrome at the crossroad of polyautoimmunity. J Autoimmun. 2012;39:199–205. [DOI] [PubMed] [Google Scholar]
- [13].Al Barashdi MA, Ali A, McMullin MF, et al. Protein tyrosine phosphatase receptor type C (PTPRC or CD45). J Clin Pathol. 2021;74:548–52. [DOI] [PMC free article] [PubMed] [Google Scholar]
- [14].Rheinlander A, Schraven B, Bommhardt U. CD45 in human physiology and clinical medicine. Immunol Lett. 2018;196:22–32. [DOI] [PubMed] [Google Scholar]
- [15].Tchilian EZ, Beverley PCL. Altered CD45 expression and disease. Trends Immunol. 2006;27:146–53. [DOI] [PubMed] [Google Scholar]
- [16].Irie-Sasaki J, Sasaki T, Matsumoto W, et al. CD45 is a JAK phosphatase and negatively regulates cytokine receptor signalling. Nature. 2001;409:349–54. [DOI] [PubMed] [Google Scholar]
- [17].Hong X, Wang X, Rang X, et al. The shared mechanism and candidate drugs of multiple sclerosis and Sjögren’s syndrome analyzed by bioinformatics based on GWAS and transcriptome data. Front Immunol. 2022;13:857014. [DOI] [PMC free article] [PubMed] [Google Scholar]
- [18].Charras A, Arvaniti P, Le Dantec C, et al. JAK inhibitors and oxidative stress control. Front Immunol. 2019;10:2814. [DOI] [PMC free article] [PubMed] [Google Scholar]
- [19].Xystrakis E, Cavailles P, Dejean AS, et al. Functional and genetic analysis of two CD8 T cell subsets defined by the level of CD45RC expression in the rat. J Immunol. 2004;173:3140–7. [DOI] [PubMed] [Google Scholar]
- [20].Phenekos C, Vryonidou A, Gritzapis AD, et al. Th1 and Th2 serum cytokine profiles characterize patients with Hashimoto’s thyroiditis (Th1) and Graves’ disease (Th2). Neuroimmunomodulation. 2004;11:209–13. [DOI] [PubMed] [Google Scholar]
- [21].Gorabi AM, Hajighasemi S, Kiaie N, et al. The pivotal role of CD69 in autoimmunity. J Autoimmun. 2020;111:102453. [DOI] [PubMed] [Google Scholar]
- [22].Liappas G, Gonzalez-Mateo GT, Sanchez-Diaz R, et al. Immune-regulatory molecule CD69 controls peritoneal fibrosis. J Am Soc Nephrol. 2016;27:3561–76. [DOI] [PMC free article] [PubMed] [Google Scholar]
- [23].Radstake TR, van Bon L, Broen J, et al. Increased frequency and compromised function of T regulatory cells in systemic sclerosis (SSc) is related to a diminished CD69 and TGFbeta expression. PLoS One. 2009;4:e5981. [DOI] [PMC free article] [PubMed] [Google Scholar]
- [24].Miao M, Hao Z, Guo Y, et al. Short-term and low-dose IL-2 therapy restores the Th17/Treg balance in the peripheral blood of patients with primary Sjögren’s syndrome. Ann Rheum Dis. 2018;77:1838–40. [DOI] [PubMed] [Google Scholar]
- [25].Stassi G, Todaro M, Bucchieri F, et al. Fas/Fas ligand-driven T cell apoptosis as a consequence of ineffective thyroid immunoprivilege in Hashimoto’s thyroiditis. J Immunol. 1999;162:263–7. [PubMed] [Google Scholar]
- [26].Agnihotri P, Robertson NM, Umetsu SE, et al. Lack of Ikaros cripples expression of Foxo1 and its targets in naive T cells. Immunology. 2017;152:494–506. [DOI] [PMC free article] [PubMed] [Google Scholar]
- [27].Cytlak U, Resteu A, Bogaert D, et al. Ikaros family zinc finger 1 regulates dendritic cell development and function in humans. Nat Commun. 2018;9:1239. [DOI] [PMC free article] [PubMed] [Google Scholar]
- [28].Schwickert TA, Tagoh H, Gültekin S, et al. Stage-specific control of early B cell development by the transcription factor Ikaros. Nat Immunol. 2014;15:283–93. [DOI] [PMC free article] [PubMed] [Google Scholar]
- [29].Yap WH, Yeoh E, Tay A, et al. STAT4 is a target of the hematopoietic zinc-finger transcription factor Ikaros in T cells. FEBS Lett. 2005;579:4470–8. [DOI] [PubMed] [Google Scholar]
- [30].Fang CM, Roy S, Nielsen E, et al. Unique contribution of IRF-5-Ikaros axis to the B-cell IgG2a response. Genes Immun. 2012;13:421–30. [DOI] [PMC free article] [PubMed] [Google Scholar]
- [31].Merkenschlager M. Ikaros in immune receptor signaling, lymphocyte differentiation, and function. FEBS Lett. 2010;584:4910–4. [DOI] [PubMed] [Google Scholar]
- [32].Lessard CJ, Li H, Adrianto I, et al. UK Primary Sjögren's Syndrome Registry. Variants at multiple loci implicated in both innate and adaptive immune responses are associated with Sjögren’s syndrome. Nat Genet. 2013;45:1284–92. [DOI] [PMC free article] [PubMed] [Google Scholar]
- [33].Barr VA, Sherman E, Yi J, et al. Development of nanoscale structure in LAT-based signaling complexes. J Cell Sci. 2016;129:4548–62. [DOI] [PMC free article] [PubMed] [Google Scholar]
- [34].Navas VH, Cuche C, Alcover A, et al. Serine phosphorylation of SLP76 Is dispensable for T cell development but modulates helper T cell function. PLoS One. 2017;12:e0170396. [DOI] [PMC free article] [PubMed] [Google Scholar]
- [35].Lampe K, Endale M, Cashman S, et al. Slp-76 is a critical determinant of NK-cell mediated recognition of missing-self targets. Eur J Immunol. 2015;45:2072–83. [DOI] [PMC free article] [PubMed] [Google Scholar]
- [36].Bounab Y, Hesse AM, Iannascoli B, et al. Proteomic analysis of the SH2 domain-containing leukocyte protein of 76 kDa (SLP76) interactome in resting and activated primary mast cells [corrected]. Mol Cellular Proteomics. 2013;12:2874–89. [DOI] [PMC free article] [PubMed] [Google Scholar]


