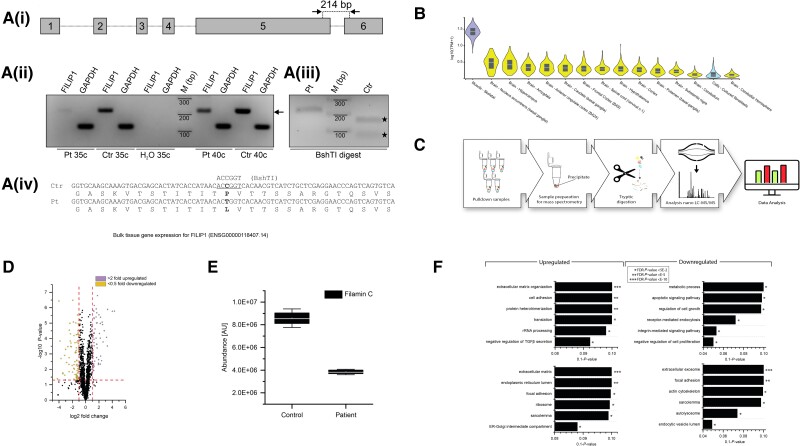
Figure 5.
Investigation of FILIP1 expression and subsequent proteomic profiling of fibroblasts derived from FILIP1 Patient 3 p.[Pro1133Leu]. [A(i)] cDNA prepared from RNA isolated from skin fibroblasts from our c.3398C>T; p.[P1133L] patient (Pt) or control (Ctr) fibroblasts, was amplified using oligonucleotides that amplify the indicated 214 bp fragment of FILIP1 mRNA or GAPDH mRNA. [A(ii)] Both primer pairs amplify the expected FILIP1 (arrow) and GAPDH fragment from Pt and Ctr fibroblasts using 35 or 40 cycles (c). [A(iii)] Analysis of the sequence of Ctr and Pt FILIP1 cDNA reveals the loss of a BshTI restriction site in Pt cDNA. [A(iv)] Schematic presentation of BshTI digestion of Pt and Ctr cDNA. Ctr cDNA is completely digested (filled stars), while Pt cDNA is still intact, confirming homozygous expression of the c.3398C>T variant in skin fibroblasts of our patient. Uncropped versions of the gels are shown in Supplementary Fig. 4. (B) Confirmed FILIP1 expression by in silico based GTex-analysis in fibroblasts (blue). (C) Schematic representation of the applied workflow. (D) Volcano plot of proteomic findings; yellow dots represent proteins showing a significant decrease whereas purple dots represent proteins with a significant increase in abundance. The x-axis reflects the magnitude of fold-changes (base 2) and the y-axis represents the negative log of the P-value (base 10). (E) Box plot-based representation of decreased FLNc abundance in FILIP1-patient derived fibroblasts compared to controls. (F) GO-term-based representation of the six most (statistically significant) affected biological processes and subcellular compartments/structures depicted for the increased and decreased proteins, respectively.

