

Abstract
Purpose:
Recognition that cultural stereotypes can unintentionally perpetuate inequities throughout academic medicine has led to calls for “implicit bias training” without strong evidence to support these recommendations and some evidence of potential harm. The authors sought to determine the effectiveness of a single 3-hour workshop in helping department of medicine faculty overcome implicit stereotype-based bias and in improving the climate in the working environment.
Method:
A multisite cluster randomized controlled study (October 2017 to April 2021) with clustering at the level of divisions within departments and participant-level analysis of survey responses involved 8,657 faculty in 204 divisions in 19 departments of medicine: 4,424 in the intervention group (1,526 attended a workshop) and 4,233 in the control group. Online surveys at baseline (3,764/8,657 = 43.48% response rate) and 3-months after the workshop (2,962/7,715 = 38.39% response rate) assessed bias awareness, bias-reducing intentional behavioral change, and perceptions of division climate.
Results:
At 3 months, faculty in the intervention vs control divisions showed greater increases in awareness of personal bias vulnerability (b = 0.190 [95% CI, 0.031 to 0.349], P = .02); bias reduction self-efficacy (b = 0.097 [95% CI, 0.010 to 0.184], P = .03); and taking action to reduce bias (b = 0.113 [95% CI, 0.007 to 0.219], P = .04). The workshop had no effect on climate or burnout, but slightly increased perceptions of respectful division meetings (b = 0.072 [95% CI, 0.0003 to 0.143], P = .049).
Conclusions:
Results of this study should give confidence to those designing prodiversity interventions for faculty in academic medical centers that a single workshop which promotes awareness of stereotype-based implicit bias, explains and labels common bias concepts, and provides evidence-based strategies for participants to practice appears to have no harms and may have significant benefits in empowering faculty to break the bias habit.
Societal inequities are rooted in cultural stereotypes often based on historical tropes or outdated social roles. Repeated exposure to stereotypic messages sustains conscious prejudice and also establishes passively acquired cognitive habits, referred to as “implicit bias,” that can unwittingly and unintentionally reinforce inequities.1 As examples, implicit stereotype-based assumptions about social value and occupational roles promote salary inequities,2–8 penalties for men who request family leave,9,10 and lower funding priorities for research conducted by female11–13 or Black investigators14 and the topics they are more likely to study.15–20 Growing awareness of these insidious cognitive processes has led to calls for “implicit bias training” throughout academic medicine,3,21 but evidence for effectiveness of single workshops is weak.22,23 Evidence indicates that such training may lead to unintended harms24–30 and even increase susceptibility to stereotyping.26
Approaching unintentional stereotype-based bias as unwanted cognitive habits and mobilizing behavioral change strategies,31–34 we developed35 and experimentally verified the long-term effectiveness of a bias habit-reducing intervention.36,37 We found that a single workshop in the realm of gender bias increased personal bias awareness, self-reported measures of behavioral change, and perceptions of an inclusive department climate with long-term impact on faculty hiring and retention.36,37 To further test whether a bias habit-breaking workshop is effective beyond a single institution and beyond a gender bias focus, we conducted the Bias Reduction in Internal Medicine (BRIM) study. We chose a multisite cluster randomized controlled study design because the workshop intervention is intended for delivery at a cluster level.38 We chose departments of medicine because their departmental divisions readily serve as clusters. We hypothesized that compared with faculty in control divisions, those in divisions offered a 3-hour bias habit-reducing workshop would show significant increases in measures of bias awareness and self-reported motivation, self-efficacy, and taking action to engage in bias-reducing activities. We further hypothesized that faculty in divisions receiving the workshop would perceive a more inclusive division climate.35,36
Method
Design overview
The Bias Reduction in Internal Medicine (BRIM) study used a cluster randomized controlled design involving faculty in 19 U.S. departments of medicine. We randomized divisions (clusters) within each department to receive the 3-hour bias habit-reducing workshop early (intervention group) or later (waitlist control group). The workshop is described in detail in Supplemental Digital Appendix 1 at [http://links.lww.com/ACADMED/B423]. Outcome measures were survey responses at baseline and 3 months after workshops in the intervention group; the survey items are detailed in Supplemental Digital Appendixes 2–5 at [http://links.lww.com/ACADMED/B423]. Divisions not uniformly found in departments of medicine (e.g., epidemiology) were surveyed and offered workshops with the control group but were not part of the experimental study. Participating divisions are described in Supplemental Digital Appendix 6 at [http://links.lww.com/ACADMED/B423]. Study details, timelines, and workshop development are detailed in Carnes et al.39 The study occurred between October 2017 and April 2021. Fourteen sites received the intervention in-person. COVID-19 pandemic protocols implemented in March 2020 required adaptation to a virtual format for the remaining 5 sites.
The University of Wisconsin institutional review board (IRB) approved the overall study protocol. The IRB of each participating site approved research activities that exclusively took place at that site (e.g., recruitment of faculty to workshops).
Recruitment
The flow diagram in Figure 1 provides an overview of participants in the BRIM study.
Figure 1.
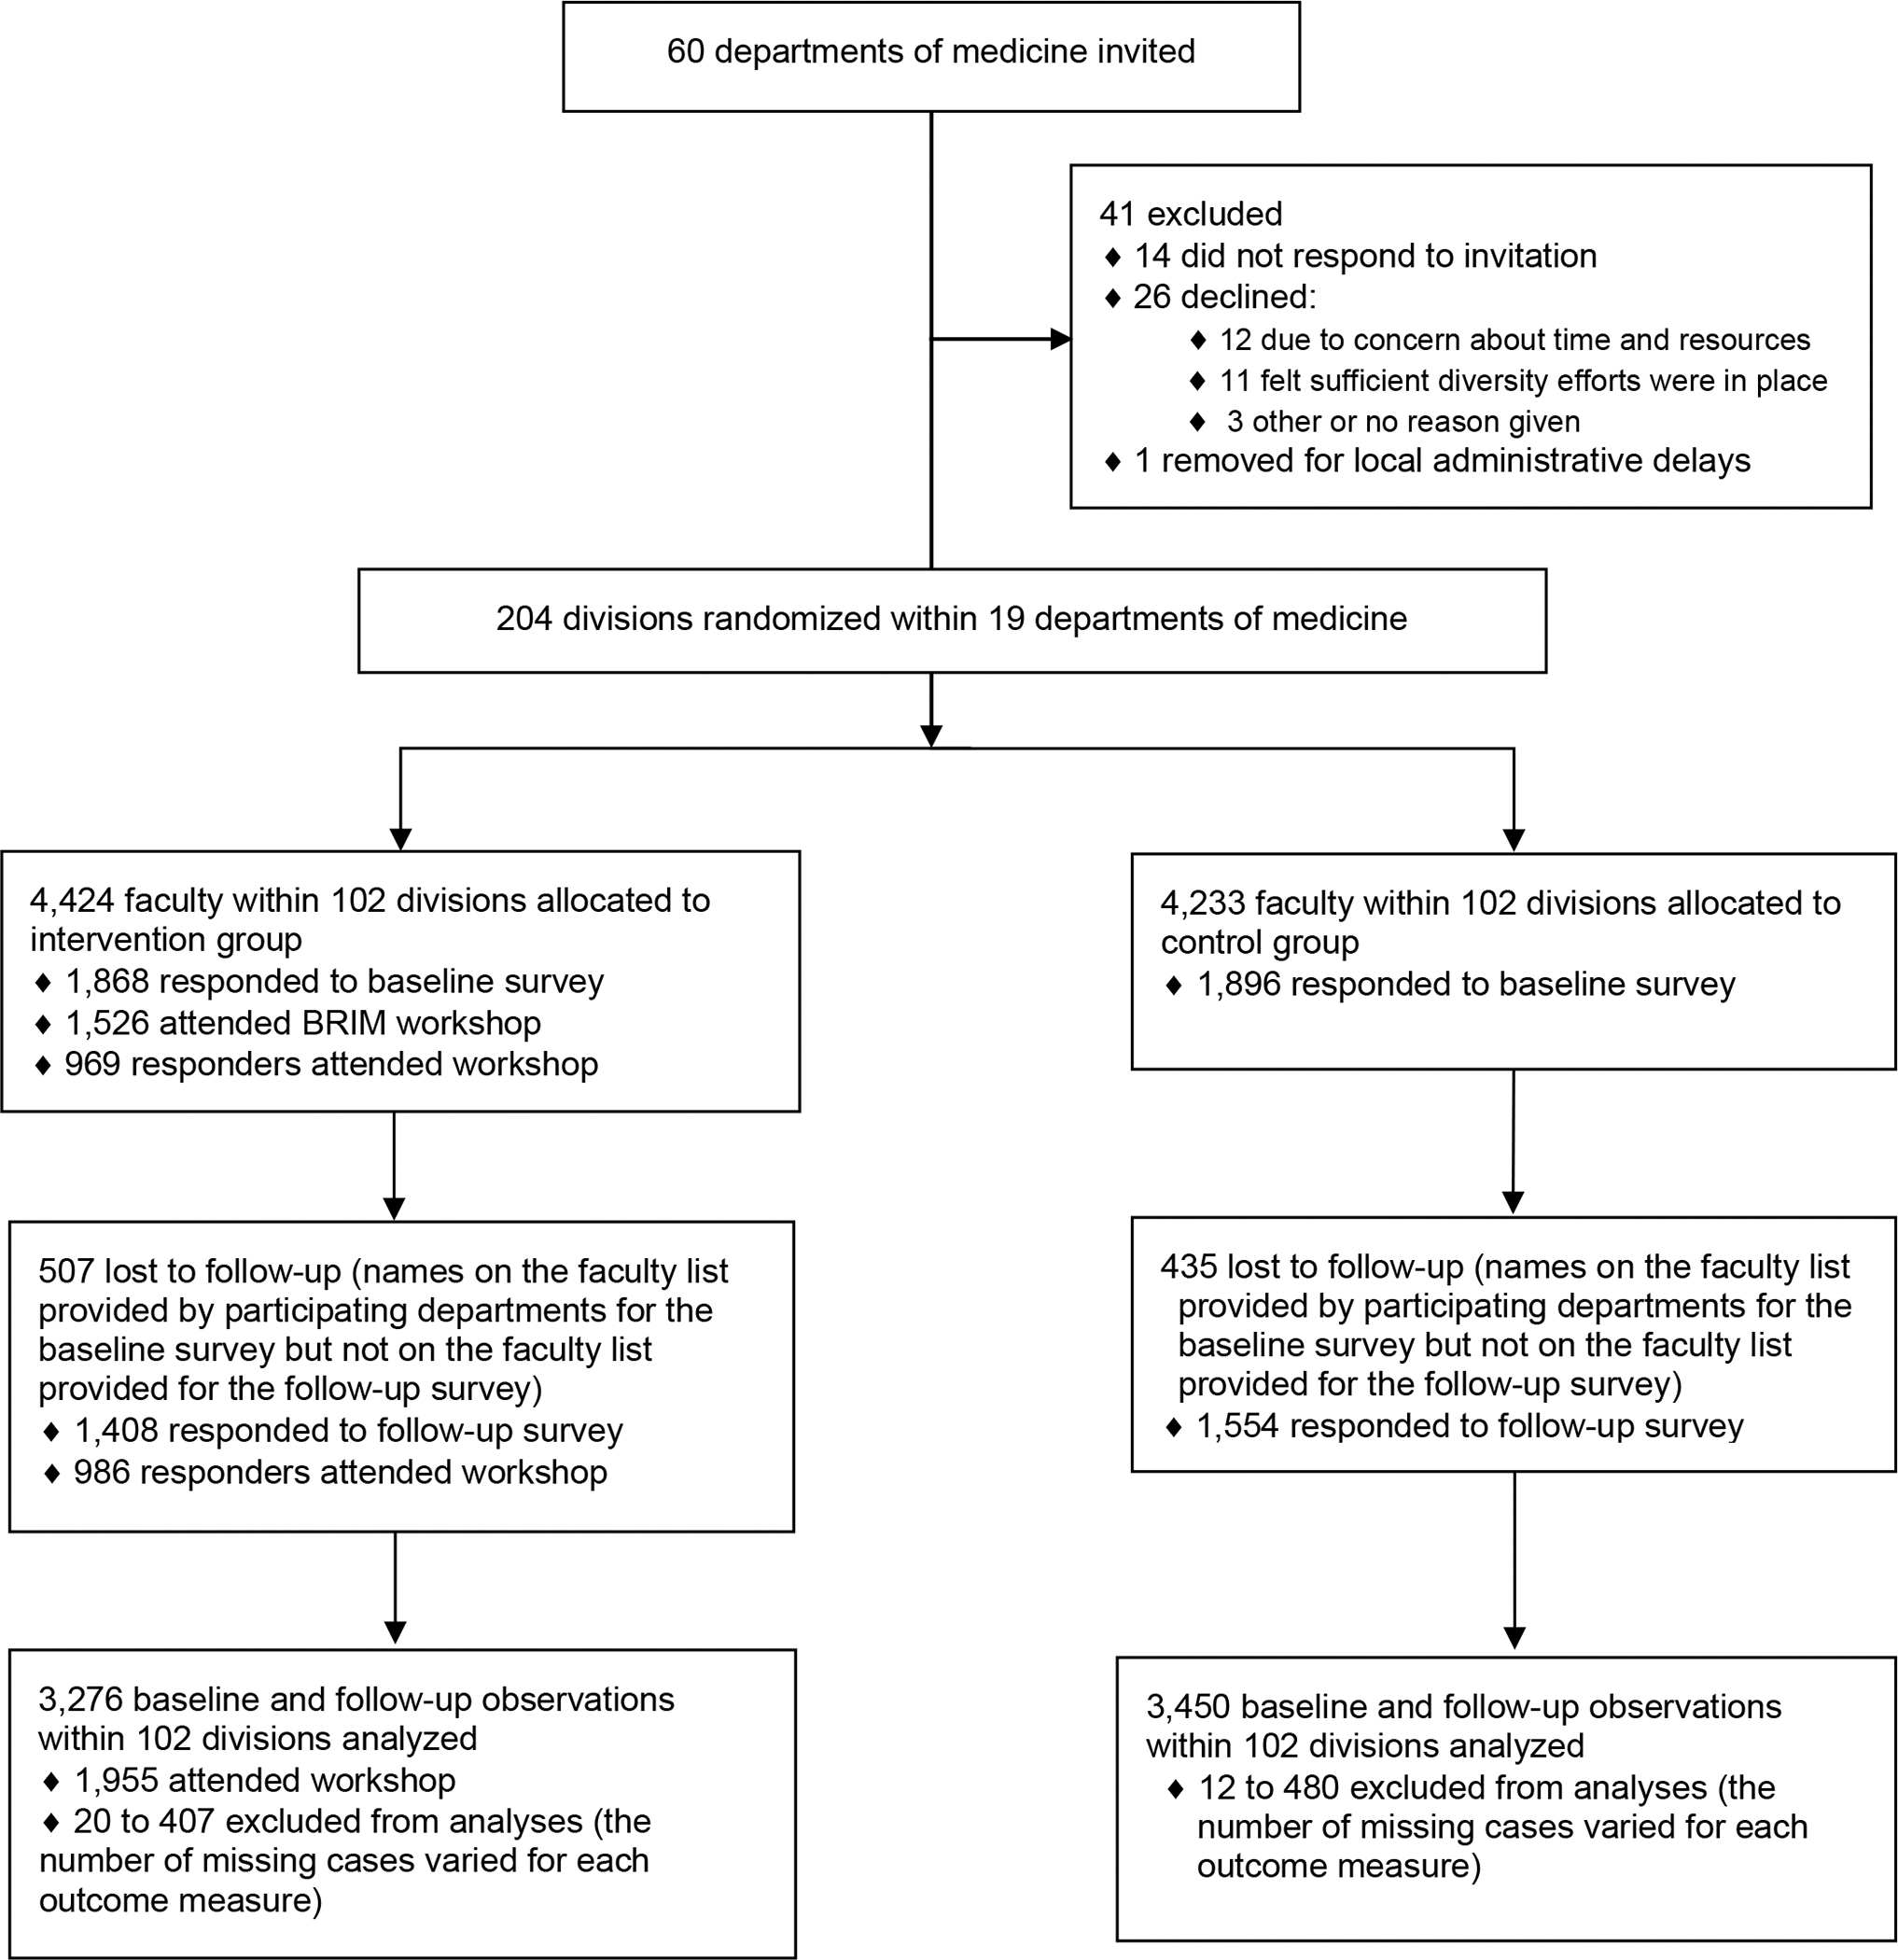
Flow diagram showing an overview of participants in the Bias Reduction in Internal Medicine (BRIM) study, October 2017 to April 2021
Recruitment of departments.
We emailed recruitment materials and invitations to the chairs of the highest ranked departments of medicine for National Institutes of Health (NIH) funding,40 because faculty at these institutions are overrepresented among leaders in academic medicine. To incentivize participation, we included a faculty development component: a 3- to 4-month curriculum to train local presenters to deliver the BRIM workshop. In total, we invited 60 departments (55 in medical schools and 5 in hospitals) with divisions in at least 9 major subspecialties of internal medicine.41 Twenty accepted, after which 1 was excluded due to administrative delays. Nineteen departments of medicine (32% of those invited) in 16 states across 5 geographic regions of the United States participated in the study: 8 in private institutions and 11 in public institutions (see list of participating institutions in Supplemental Digital Appendix 7 at [http://links.lww.com/ACADMED/B423]).
Recruitment of participants to BRIM workshops.
Each site helped recruit participants. The number of faculty per division ranged from 5 to 296 (mean 42.47, SD = 36.98; median = 31.50). Attendance rates were calculated from consent forms collected at the beginning of the workshop (written for in-person workshops and online for virtual workshops) and from survey responses affirming attendance. The attendance rate among divisions varied from 3.03% to 90.00% (average 47.63%, SD = 0.20). Of the 4,424 faculty present at baseline across all 19 sites, 1,526 attended a BRIM workshop (34.49%).
Recruitment of participants for surveys.
Division members received online invitations and up to 4 reminders to take each of 2 BRIM surveys: a baseline survey and a follow-up survey 3 months after all intervention divisions at that site completed their workshops. Completion of the confidential survey was voluntary, and participants were informed that taking the survey indicated consent.
Randomization
We randomly allocated divisions within each department into the intervention or waitlist control group with a “best balance design”42–45 which uses both cluster level measures (e.g., size) and individual level measures (baseline survey responses) to distribute cluster characteristics equally. Divisions provided administrative data (as percentages) on faculty demographics (including gender and race/ethnicity). To select an allocation of 2 groups of divisions with the best balance, for each department the project statistician generated all possible allocations, assigned a rank to each division for each variable of interest (i.e., total number of faculty and percentage of female, White, medical degree, nontenured track, and junior faculty at the division level; and female, racial/ethnic minority, any minority, and medical degree at the individual level) and used this rank matrix to calculate the differences for all possible allocations. This process was carried out with a full list of covariates and with a reduced set of prioritized covariates based on our previous work.36 The research team met to check the face validity of the top 20 allocations common to both lists (e.g., large procedural divisions could not be together), randomly selected an allocation using a virtual random wheel spinner, and then assigned the intervention group by coin toss. All participants knew their division would be offered the workshop either early (intervention) or later (control). This assignment was unknown to participants and investigators for the baseline survey and known for the follow-up survey; no other blinding occurred. Collection of demographic information is described in Supplemental Digital Appendix 8 at [http://links.lww.com/ACADMED/B423].
Sample size
Assuming a common standard deviation of 1.0, average cluster size of 20, and intracluster correlation coefficient (ICC) of 0.05, we calculated the minimum sample size required to detect a workshop effect of 0.15 at 80% power to be 140 divisions with 2,800 individuals.36 We assumed a priori an average department of medicine has 9 to 14 divisions, 10 to 70 faculty members per division, and 300 to 800 total faculty members. Allowing for a 25% survey response rate, we planned to recruit 15 departments. In the end, with 19 departments and 204 divisions (102 in the intervention group and 102 in the control group), the study included 3,764 faculty (of 8,657 total) who completed the baseline survey (43.48% response rate) which could detect a workshop effect of 0.09 with 80% power.
Intervention
The intervention, delivered to entire divisions (clusters) was a 3-hour workshop with an introduction and 3 modules: (1) Implicit Bias as a Habit, (2) Becoming Bias Literate, and (3) Evidence-Based Strategies to Break the Bias Habit (see Supplemental Digital Appendix 1 at [http://links.lww.com/ACADMED/B423]). This structure was similar to our previous workshop intervention focusing on gender bias,35–37 with content adapted to include bias against other social groups—especially racial identities—and examples relevant to academic medicine whenever possible.39 The presenters used language that was nonconfrontational and inclusive; supported content with illustrative research studies; facilitated interactive exercises and discussion; provided memory aids to encourage the practice of bias-reducing strategies after the workshop; and sent a synthesis of participants’ written ”commitment to action” to all division members within a week of the workshop.46,47 Before finalizing the content and format, we iteratively piloted and revised the workshop in response to feedback with 3 local clinical departments.
Outcomes
To measure workshop effectiveness, we compared responses to baseline and 3-month follow-up surveys of faculty in divisions allocated to the intervention group with those in the control group. Primary outcome measures were Likert-type response choices (scales of 1 to 5 or 1 to 7) in the domains of bias awareness, intentional bias-reducing behaviors, and perceptions of division climate (items provided in Supplemental Digital Appendixes 2 and 3 at [http://links.lww.com/ACADMED/B423]). The awareness and behavioral change questions derive from research on implicit bias35,36,48 and intentional behavioral change31–34 and themes derived from 2 focus groups.36 Climate questions derive from those in the Study of Faculty Worklife (a longitudinal study of faculty at the University of Wisconsin-Madison);49 and are based on research on workplace climate and interviews with faculty and staff, associated with faculty productivity,50 and sensitive to change over time.36,51 We also included a question on burnout.52 We piloted and revised a mature draft of the survey 3 times with the research team before deployment.
We averaged responses for areas with multiple items. Although divisions could invite key staff members to the workshop, we limited analyses to faculty. We delivered 2 workshops to a large division at the request of 5 sites and combined the data. After completion of the experimental study with the 3-month survey, the local individuals who completed presenter training delivered workshops to divisions in the control group and any remaining divisions. We sent a third survey that was not part of the experimental study for a summary report to the department chair.
Bias awareness.
We used 16 items to query several aspects of bias awareness. We grouped these items into personal bias vulnerability (e.g., I could unintentionally behave in biased ways towards individuals from racial/ethnic minority groups), bias rejection (e.g., Women are overly sensitive about unintended offenses), denial of bias in personal decision-making (e.g., stereotypes rarely affect my clinical decision-making in patient care), witnessing bias in others (e.g., I notice when others exhibit bias towards any minority), societal benefit (e.g., I consider discrimination against individuals from racial/ethnic minority groups to be a serious social problem), and disciplinary bias (e.g., unintentional bias is a serious problem in my division).
Intentional bias-reducing behavioral change.
We used 8 items to assess general motivation to engage in bias-reducing activities (e.g., I want to recognize when bias is occurring during an interpersonal interaction), 1 question each to assess internal (When I promote equity in my division, I do so because of my personal values) and external (I only go along with my division’s diversity goals because everybody else is) dimensions of motivation to behave in unbiased ways, 8 items for bias reduction self-efficacy (e.g., I am confident I can challenge a personnel decision if I think it has been influenced by stereotypes), 8 items each for the perceived benefits and risks of taking action (e.g., It would [benefit/be risky for me] to become better acquainted with a person whose background is different from my own), and 8 items for taking action to reduce bias (e.g., I intervene if I witness a student, resident, fellow, or colleague being treated in a biased way).48,53
Climate.
We analyzed perceived division climate with 22 items grouped as: satisfaction with climate, climate for underrepresented persons, feeling work is valued, feeling respected, and the existence of images or language that reinforce stereotypes within the division. We also separately examined 7 individual questions either because they had been significant in our initial study (e.g., How well do your fit in your division?), queried areas emphasized in the workshop (e.g., How often are interactions in your division meetings respectful?), or were deemed important to department chairs (How often do you feel overwhelmed by your job?).
Statistical methods
We summarized individual and division characteristics with descriptive statistics by experimental status at each time point (Table 1 and Table 2). Analytic models included all randomized divisions (intention-to-treat) (details in Supplemental Digital Appendix 9 at [http://links.lww.com/ACADMED/B423]). We used linear mixed-effects models to examine the effect of the intervention as the mean difference between intervention and control groups over time (from baseline to 3-months after completion of workshop). To address clustering, all models included a random intercept at the individual, division, and department levels while random slopes were not included. We then adjusted for covariates used in the randomization process to ensure balance of both cluster-level and individual-level covariates. The interaction between division allocation and time in each model was estimated as a workshop effect. To handle missing information about faculty characteristics, we used a multiple imputation (MI) technique by chained equations in the Stata MI program54–56 and created 20 complete datasets for the analysis.57 All analyses were performed using STATA 17.58 All tests were 2-sided and used a P-value of .05 for statistical significance.
Table 1.
Descriptive Statistics of Division Characteristics at Baseline for Faculty in the Bias Reduction in Internal Medicine (BRIM) Study, October 2017 to April 2021
| Division characteristica | Intervention group, mean (SD) | Control group, mean (SD) | Total for both groups, mean (SD) |
|---|---|---|---|
| No. of faculty | 43.09 (39.15) | 41.85 (34.85) | 42.47 (36.98) |
| % Female | 41.12 (13.94) | 42.72 (14.70) | 41.92 (14.31) |
| % White | 65.17 (14.85) | 65.68 (14.48) | 65.43 (14.63) |
| % MD | 73.22 (23.99) | 74.69 (23.81) | 73.96 (23.86) |
| % Nontenure track | 49.70 (32.22) | 53.19 (32.73) | 51.45 (32.44) |
| % Junior faculty | 50.02 (17.48) | 50.34 (19.23) | 50.18 (18.33) |
Abbreviations: MD, medical doctor; SD, standard deviation.
Data were available for 102 divisions each in the intervention and control groups except for data on nontenure track and junior faculty, for which there were data for 97 divisions in each group. Some sites did not distinguish tenure from nontenure track or do not have tenure, and some sites did not provide junior faculty information.
Table 2.
Descriptive Statistics of Background Variables for Individual Characteristics of Faculty in the Bias Reduction in Internal Medicine (BRIM) Study, October 2017 to April 2021
| Individual characteristica | Intervention group | Control group | Both groups |
|---|---|---|---|
| Baseline | |||
| No. survey respondents/no. surveys sent (response rate %) | 1,868/4,424 (42.22) | 1,896/4,233 (44.79) | 3,764/8,657 (43.48) |
| Female, no. respondents/total no. (%) | 769/1,648 (46.66) | 801/1,677 (47.76) | 1,570/3,325 (47.22) |
| Racial/ethnic minority, no. respondents/total no. (%) | 380/1,868 (20.34) | 393/1,896 (20.73) | 773/3,764 (20.54) |
| Any minority, no. respondents/total no. (%)b | 917/1,868 (49.09) | 904/1,896 (47.68) | 1,821/3,764 (48.38) |
| MD, no. respondents/total no. (%) | 1,323/1,650 (80.18) | 1,346/1,673 (80.45) | 2,669/3,323 (80.32) |
|
| |||
| Follow up | |||
| No. survey respondents/no. surveys sent (response rate %) | 1,408/3917 (35.95) | 1,554/3,798 (40.92) | 2,962/7715 (38.39) |
| Female, no. respondents/total no. (%) | 572/1,216 (47.04) | 632/1,350 (46.81) | 1,204/2,566 (46.92) |
| Racial/ethnic minority, no. respondents/total no. (%) | 300/1,408 (21.31) | 307/1,554 (19.76) | 607/2,962 (20.49) |
| Any minority, no. respondents/total no. (%)b | 686/1,408 (48.72) | 706/1,554 (45.43) | 1,392/2,962 (47.00) |
| MD, no. respondents/total no. (%) | 981/1,223 (80.21) | 1,076/1,356 (79.35) | 2,057/2,579 (79.76) |
Abbreviations: MD, medical doctor; SD, standard deviation.
Not all participants provided a response for all characteristics.
Refers to a respondent who self-identifies in one or more of the following groups: racial minority, ethnic minority, person with a disability, non-U.S. citizen, LGBT, woman in a male-dominated workgroup, man in a female-dominated workgroup, religious minority, U.S. veteran, or any other self-identified minority status.
We examined the pattern of responses between the 14 sites in which the intervention group received in-person workshops with the 5 sites receiving virtual workshops. In addition to descriptive analysis, we tested the difference in workshop effects through three-way interaction models and found no significant differences in outcome measures (see Supplemental Digital Appendix 9 at [http://links.lww.com/ACADMED/B423]). Therefore, while the intervention delivery method changed due to the COVID-19 pandemic, we combined data from all sites for analyses.
Results
Table 1 shows division-level characteristics and Table 2 shows individuals characteristic of the participants (collection of demographic information is described in Supplemental Digital Appendix 8). For baseline survey respondents (n = 3,764/8,657, 43.48% response rate), 47.22% identified as female, 20.54% as racial/ethnic minority; and 48.38% as having “any minority” status (Table 2). “Any minority” status was defined as a respondent who self-identifies in 1 or more of the following groups: racial minority, ethnic minority, person with a disability, non-U.S. citizen, LGBT, woman in a male-dominated workgroup, man in a female-dominated workgroup, religious minority, U.S. veteran, or any other self-identified “minority” status). For 3-month follow-up survey respondents (n = 2,962/7,715, 38.39% response rate), 46.92% identified as female; 20.49% as a racial/ethnic minority; and 47.00% as “any minority” (Table 2). There were 507 faculty in the intervention group and 435 in the control group lost to follow-up between the 2 surveys; they were on the faculty list provided by the participating site before the baseline survey and absent from the faculty list provided for the follow-up survey (Figure 1).
Three months postworkshop, faculty in the intervention divisions showed significantly greater increases in personal bias vulnerability (b = 0.190, 95% CI 0.031 to 0.349; P = .02), bias reduction self-efficacy (b = 0.097, 95% CI 0.010 to 0.184; P = .03), and taking action to reduce bias (b = 0.113, 95% CI 0.007 to 0.219; P = .04) (Table 3, Figure 2). Their standardized effect sizes were 0.11, 0.11, and 0.10, respectively. There were no workshop effects in other areas of bias awareness, motivation, risks/benefits, or any areas of climate. Cronbach alpha of outcome measures (except single items) ranged 0.83 to 0.96, consistent with good-to-excellent internal consistency. Among the 7 individual climate questions tested, only perceptions of respectful division meetings slightly increased (b = 0.072, 95% CI 0.0003 to 0.143; P = .049).
Table 3.
Bias Reduction in Internal Medicine (BRIM) Workshop Effect for Faculty in the BRIM Study, October 2017 to April 2021
| Dependent variablesa,f | Intervention presurvey meanc | Intervention postsurvey meanc | Control presurvey meanc | Control postsurvey meanc | Unadjusted coefficient b (SE) [95% CI]d | P-value | Coefficient b (SE) [95% CI]e | P-value | No. |
|---|---|---|---|---|---|---|---|---|---|
| Bias awareness | |||||||||
| Personal bias vulnerability | 4.200 | 4.479 | 4.137 | 4.243 | 0.172 (0.130) [−0.083 to 0.427] | .18 | 0.190 (0.081) [0.031 to 0.349] | .02 | 6,631 |
| Witnessing bias in others | 5.333 | 5.577 | 5.398 | 5.437 | 0.204 (0.100) [0.008 to 0.400] | .04 | 0.130 (0.069) [−0.004 to 0.264] | .06 | 6,694 |
| Societal benefit | 6.430 | 6.538 | 6.447 | 6.515 | 0.041 (0.063) [−0.083 to 0.163] | .52 | 0.013 (0.043) [−0.071 to 0.096] | .76 | 6,613 |
| Bias rejection | 2.868 | 2.665 | 2.893 | 2.710 | −0.021 (0.104) [−0.226 to 0.184] | .84 | −0.027 (0.073) [−0.171 to 0.116] | .71 | 6,553 |
| Denial of bias in decision-making | 4.929 | 4.999 | 5.002 | 4.959 | 0.113 (0.110) [−0.104 to 0.330] | .31 | 0.066 (0.080) [−0.092 to 0.224] | .41 | 6,342 |
| Disciplinary bias | 3.419 | 3.523 | 3.438 | 3.468 | 0.074 (0.132) [−0.185 to 0.334] | .57 | −0.014 (0.077) [−0.165 to 0.136] | .85 | 6,422 |
|
| |||||||||
| Motivation | |||||||||
| General motivation | 5.919 | 6.085 | 5.880 | 6.024 | 0.023 (0.056) [−0.088 to 0.133] | .69 | −0.010 (0.039) [−0.086 to 0.067] | .81 | 6,355 |
| Internal motivation | 6.078 | 6.182 | 5.983 | 6.090 | −0.002 (0.085) [−0.169 to 0.164] | .98 | −0.019 (0.062) [−0.141 to 0.103] | .76 | 5,839 |
| External motivation | 1.834 | 1.761 | 1.871 | 1.846 | −0.048 (0.075) [−0.194 to 0.989] | .52 | −0.008 (0.058) [−0.122 to 0.105] | .88 | 6,309 |
|
| |||||||||
| Bias reduction self-efficacy | 5.384 | 5.619 | 5.366 | 5.458 | 0.144 (0.059) [0.027 to 0.260] | .02 | 0.097 (0.045) [0.010 to 0.184] | .03 | 6,350 |
|
| |||||||||
| Negative outcome expectation | 5.515 | 5.679 | 5.471 | 5.592 | 0.043 (0.069) [−0.093 to 0.179] | .54 | −0.034 (0.056) [−0.143 to 0.076] | .55 | 6,348 |
|
| |||||||||
| Positive outcome expectation | 2.788 | 2.702 | 2.796 | 2.750 | −0.041 (0.076) [−0.190 to 0.109] | .59 | 0.020 (0.049) [−0.076 to 0.116] | .68 | 6,349 |
|
| |||||||||
| Taking action to reduce bias | 4.199 | 4.507 | 4.157 | 4.293 | 0.173 (0.075) [0.026 to 0.321] | .02 | 0.113 (0.054) [0.007 to 0.219] | .04 | 6,344 |
|
| |||||||||
| Climate | |||||||||
| Respectful division meetingsb | 4.479 | 4.519 | 4.466 | 4.461 | 0.045 (0.061) [−0.754 to 0.166] | .46 | 0.072 (0.036) [0.0003 to 0.143] | .049 | 5,946 |
Abbreviations: CI, confidence interval; SE, standard error.
Cronbach alpha of all outcome measures (except single items) ranged 0.83 to 0.96, which suggests good to excellent internal consistency.
No other aspect of division climate or the single question on burnout were significant.
The cluster (division) mean. Subitems in each variable were measured on a 1- to 7-point scale except for the climate item (i.e., respectful division meetings) which was measured on a 1 to 5-point scale.
The beta coefficient (b) is the degree of change in the outcome variable for every one unit of change in the predictor variable, estimated from regression models (see Supplemental Digital Appendix 9 at [http://links.lww.com/ACADMED/B423]). The “predictor variable” in our models is participation of a division in the intervention group (vs control). The “outcome variable” is the mean score difference between pre- and post-surveys for each division. For example, the b of 0.190 for Personal Bias Vulnerability means that the intervention divisions had 0.190 points more sense of Personal Bias Vulnerability, on average, compared to control divisions, on a 7-point scale. We report coefficient b unadjusted and adjusted for the number of faculty, % female, % White, % MD, % nontenure track, % junior faculty at the division level and gender, any minority status, and training background (MD) at the individual level.
Response options ranged from 1 to 7: strongly disagree, disagree, slightly disagree, neither disagree nor agree, slightly agree, agree, strongly agree, except for the climate item (i.e., respectful division meetings), for which the response options ranged from 1 to 5: never, rarely, sometimes, often, very often.
Figure 2.
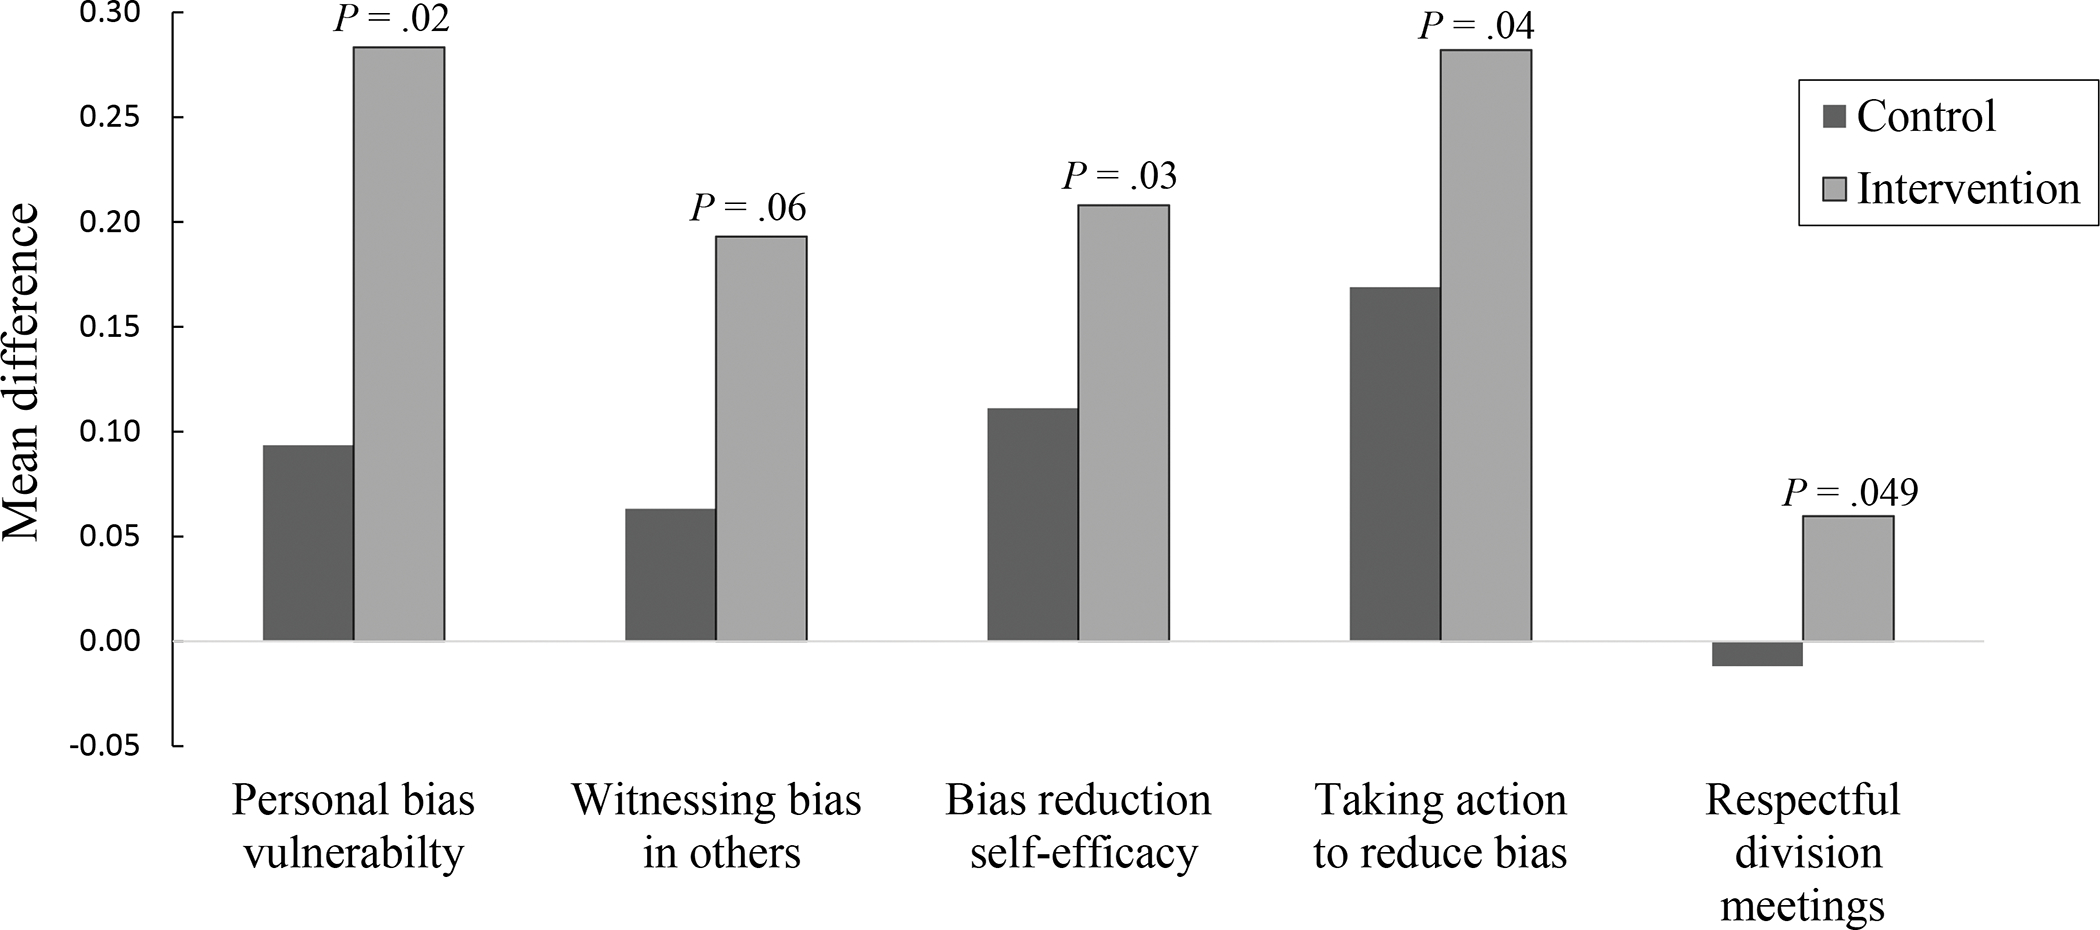
Differences between baseline and 3-month follow-up survey responses in control and intervention groups for faculty in the Bias Reduction in Internal Medicine (BRIM) study, October 2017 to April 2021. For the mean difference, the response options ranged from 1 to 7: strongly disagree, disagree, slightly disagree, neither disagree nor agree, slightly agree, agree, strongly agree, except for the respectful division meetings, for which the response options ranged from 1 to 5: never, rarely, sometimes, often, very often.
To account for the possibility of selection bias in survey responders, we used the inverse probability of workshop attendance predicted by survey participation, division, and/or individual characteristics as weights in re-estimation of our significant findings.59–61 This weighting tends to penalize workshop attendees who were more likely to participate in surveys than nonattendees. These analyzes eliminated the significance of taking action to reduce bias but did not reduce its effect size or change the significance of the other outcomes. Thus, the potential for self-selection bias did not eliminate a positive workshop effect.
We conducted a post-hoc exploratory dose-response analysis on the intervention divisions modeling the impact of percentage of faculty attendance on significant outcomes (see Supplemental Digital Appendix 10 at [http://links.lww.com/ACADMED/B423]). Taken together, these results suggest that although an effect on bias vulnerability, bias reduction self-efficacy, and taking action could be detected below 30%, the effect was more consistent when at least 30% of a division’s faculty attended the workshop and even stronger when at least 50% of a division’s faculty attended. We also conducted exploratory analyses on differences in workshop effects between intervention and control groups by faculty gender, minority status, and credential (medical doctor [MD]), as well as between private and public institutions. We found no significant differences.
Discussion
In a multisite cluster randomized controlled study, a 3-hour workshop offered to divisions within departments of medicine led to sustained increases in awareness of personal vulnerability to bias, bias-reduction self-efficacy, and self-reported bias-reducing action. The effect sizes for the BRIM outcomes (0.10–0.11) were small, but they were within the range of those in our earlier single-site study (0.10–0.23) where very small effect sizes from a similarly designed workshop intervention had impact 2 to 3 years later on the diversity of new faculty hires and faculty retention.36,37 Recent studies, including computer simulations,62 explicate how small experimental effects in social contexts can have larger group level effects.62,63 Anvari et al63 describe how tiny effect sizes can be amplified through: (1) repetition (in our case, a faculty member from a minoritized group might interact with many colleagues practicing bias-reducing strategies); (2) the environment in which the intervention occurs (in our case, departments were frequently investing in other pro-diversity initiatives which could amplify the small effect of BRIM); (3) downstream consequences with greater impact than the initial effect (in our case, more respectful division meetings might enhance faculty retention); and (4) the scaling up of tiny effect sizes when large numbers of people are engaging in the new behavior (in our case, if many members of a division role model bias-reducing strategies it might positively impact the training of future physicians).
Unlike the previous study,36 the BRIM workshop did not increase motivation to engage in bias-reducing activities nor affect climate other than possibly increasing perceptions of respectful division meetings. Contextual factors may have obscured any workshop effect in these areas. Specifically, in the intervening years, faculty in departments of medicine have undoubtedly become more motivated to work on bias reduction, particularly since much of the study occurred during the aftermath of the death of George Floyd when discussions of structural racism were prevalent. Furthermore, much of the study occurred during a pandemic where the heightened demands on physicians may have overridden any workshop effect on division climate.
It is important that the BRIM workshop had no negative impact on any outcome measure. The results of multiple studies have raised concern that increasing awareness of “implicit bias” without coupling it with a message that it can be overcome can exacerbate interpersonal race bias25 and trigger stereotype threat.25,29,64 In contrast, training that increased self-efficacy to engage in bias reduction, as in BRIM, has shown long-term benefits on intention to engage in prodiversity activities.36,37,65 The BRIM workshop emphasized a growth mindset individually and collectively; that is, a belief that, with hard work and persistence, one can learn new bias habit-reducing skills and that collective action can create a more inclusive workplace.25,27 Research supports the value of this approach.66 For example, members of minoritized groups experiencing workplace prejudice viewed their workplace more positively27 with less intention to leave28 when they believed the responsible colleague was capable of behavioral change27 or that colleagues would intervene.28
The BRIM study has limitations. Despite wide geographic representation, we do not know the workshop’s effect in departments that chose not to participate or have less NIH funding. While response rates were relatively high for physician surveys and similar in intervention and control groups,67 respondents may not be representative of the entire division. This concern about generalizability is mitigated by our weighted analyses suggesting a general lack of self-selection bias in survey responders. In addition, we intentionally designed BRIM to deliver the workshop to an entire division, so that even if those who responded to the survey or attended the workshop are not representative of the entire division, the workshop might still influence the behavior of nonresponders. This supposition is supported by research on critical mass,68 the importance of psychological safety in organizational change,69 and the collective dynamics of behavioral change in social networks.70 The perceptions of more respectful division meetings in this study and of a more inclusive department climate with an institutional impact 2 to 3 years after the intervention in our previous study36 favor social diffusion of the workshop effect. Despite well-established links between increases in self-efficacy and actual behavioral change,31,33 our use of self-reported behavioral change is another study limitation.
The study also has strengths. To our knowledge, it is the first multisite randomized controlled study of a prodiversity intervention in an academic medicine setting. It demonstrates that attendance rates of 30% to 40% are feasible even in busy clinical departments and can achieve a positive result. Finally, the comparability of patterns of responses for in-person and virtual workshops is important for extending the reach of future bias habit-reduction training.
The results of this study suggest that workshops that promote awareness of stereotype-based bias, explain and label common bias concepts, and provide evidence-based strategies for participants to practice have no apparent harms and may have significant benefits in empowering faculty in academic medicine to break the bias habit.
Supplementary Material
Acknowledgments:
We appreciate the hard work of the many individuals at the 19 participating BRIM sites who helped make this study possible.
Funding/Support:
NIH grant R35 GM122557, the University of Wisconsin, and contributions from the participating sites provided funding for this study. These entities had no role in the design of the study; collection, management, analysis, and interpretation of the data; or any aspect of this manuscript. Each of the 19 sites assisted in the conduct of the study by helping recruit faculty to attend workshops and complete surveys and by scheduling the time and location of the workshops.
Footnotes
Other disclosures: “Breaking the Bias Habit” is a registered trademark of the Board of Regents of the University of Wisconsin System.
Ethical approval: This study was approved on November 16, 2017, by the University of Wisconsin-Madison Institutional Review Board, Protocol #2017-1207, under the expedited review process, and approved annually thereafter. Each of the 18 non-UW-Madison sites also had IRB approval to recruit participants at that site; these protocols were all approved as either expedited research (11 sites) or exempt research (7 sites).
Supplemental digital content for this article is available at [http://links.lww.com/ACADMED/B423].
Contributor Information
Molly Carnes, professor emeritus, Departments of Medicine, Psychiatry, and Industrial Engineering, University of Wisconsin-Madison, Madison, Wisconsin.
Jennifer Sheridan, executive and research director and distinguished scientist, University of Wisconsin-Madison Inclusion in Science and Engineering Leadership Institute (WISELI), University of Wisconsin-Madison, Madison, Wisconsin.
Eve Fine, emeritus director of curriculum development and implementation, WISELI, University of Wisconsin-Madison, Madison, Wisconsin.
You-Geon Lee, researcher, Wisconsin Center for Education Research, University of Wisconsin-Madison, Madison, Wisconsin.
Amarette Filut, associate researcher, Institute for Clinical and Translational Research, University of Wisconsin-Madison, Madison, Wisconsin.
References
- 1.Toribio J Responsibility for implicitly biased behavior: A habit-based approach. J Soc Philos. 2021;00:1–16. doi: 10.1111/josp.12442. [DOI] [Google Scholar]
- 2.Alksnis C, Desmarais S, Curtis J. Workforce segregation and the gender wage gap: Is ‘women’s’ work valued as highly as ‘men’s’? J Appl Soc Psychol. 2008;38(6):1416–1441. doi: 10.1111/j.1559-1816.2008.00354.x. [DOI] [Google Scholar]
- 3.Butkus R, Serchen J, Moyer DV, et al. Achieving gender equity in physician compensation and career advancement: A position paper of the American College of Physicians. Ann Intern Med. 2018;168(10):721–723. doi: 10.7326/M17-3438. [DOI] [PubMed] [Google Scholar]
- 4.Castilla EJ. Gender, race, and the new (merit-based) employment relationship. Ind Relat. 2012;51(Suppl 1):528–562. doi: 10.1111/j.1468-232X.2012.00689.x. [DOI] [Google Scholar]
- 5.Dandar VM, Lautenberger DM. Exploring faculty salary equity at U.S. medical schools by gender and race/ethnicity. Association of American Medical Colleges; 2021. https://store.aamc.org/downloadable/download/sample/sample_id/453/. Accessed May 10, 2023. [Google Scholar]
- 6.Eaton AA, Saunders JF, Jacobson RK, West K. How gender and race stereotypes impact the advancement of scholars in STEM: Professors’ biased evaluations of physics and biology post-doctoral candidates. Sex Roles. 2020;82(3):127–141. doi: 10.1007/s11199-019-01052-w. [DOI] [Google Scholar]
- 7.King EB, Madera JM, Hebl MR, Knight JL, Mendoza SA. What’s in a name? A multiracial investigation of the role of occupational stereotypes in selection decisions. J Appl Soc Psychol. 2006;36(5):1145–1159. doi: 10.1111/j.0021-9029.2006.00035.x. [DOI] [Google Scholar]
- 8.Carnes M The American College of Physicians is working hard to achieve gender equity, and everyone will benefit. Ann Intern Med. 2018;168(10):741–743. doi: 10.7326/M18-0837. [DOI] [PubMed] [Google Scholar]
- 9.Rudman LA, Mescher K. Penalizing men who request a family leave: Is flexibility stigma a femininity stigma? J Soc Issues. 2013;69(2):322–340. doi: 10.1111/josi.12017. [DOI] [Google Scholar]
- 10.Weisshaar K From opt out to blocked out: The challenges for labor market re-entry after family-related employment lapses. Am Soc Rev. 2018;83(1):34–60. doi: 10.1177/0003122417752355. [DOI] [Google Scholar]
- 11.Witteman HO, Hendricks M, Straus S, Tannenbaum C. Are gender gaps due to evaluations of the applicant or the science? A natural experiment at a national funding agency. Lancet. 2019;393(10171):531–540. doi: 10.1016/S0140-6736(18)32611-4. [DOI] [PubMed] [Google Scholar]
- 12.Kaatz A, Lee YG, Potvien A, et al. Analysis of National Institutes of Health R01 application critiques, impact, and criteria scores: Does the sex of the principal investigator make a difference? Acad Med. 2016;91(8):1080–1088. doi: 10.1097/ACM.0000000000001272. [DOI] [PMC free article] [PubMed] [Google Scholar]
- 13.Magua W, Zhu X, Bhattacharya A, et al. Are female applicants disadvantaged in National Institutes of Health peer review? Combining algorithmic text mining and qualitative methods to detect evaluative differences in R01 reviewers’ critiques. J Womens Health. 2017;26(5):560–570. doi: 10.1089/jwh.2016.6021. [DOI] [PMC free article] [PubMed] [Google Scholar]
- 14.Erosheva EA, Grant S, Chen MC, Lindner MD, Nakamura RK, Lee CJ. NIH peer review: Criterion scores completely account for racial disparities in overall impact scores. Sci Adv. 2020;6(23):eaaz4868. doi: 10.1126/sciadv.aaz4868. [DOI] [PMC free article] [PubMed] [Google Scholar]
- 15.Hoppe TA, Litovitz A, Willis KA, et al. Topic choice contributes to the lower rate of NIH awards to African-American/black scientists. Sci Adv. 2019;5(10):eaaw7238. doi: 10.1126/sciadv.aaw7238. [DOI] [PMC free article] [PubMed] [Google Scholar]
- 16.Kalidasan D, Goshtasebi A, Chrisler J, Brown HL, Prior JC. Prospective analyses of sex/gender-related publication decisions in general medical journals: Editorial rejection of population-based women’s reproductive physiology. BMJ Open. 2022;12(2):e057854. doi: 10.1136/bmjopen-2021-057854. [DOI] [PMC free article] [PubMed] [Google Scholar]
- 17.Spencer RJ, Rice LW, Ye C, Woo K, Uppal S. Disparities in the allocation of research funding to gynecologic cancers by funding to lethality scores. Gynecol Oncol. 2019;152(1):106–111. doi: 10.1016/j.ygyno.2018.10.021. [DOI] [PMC free article] [PubMed] [Google Scholar]
- 18.Sugimoto CR, Ahn YY, Smith E, Macaluso B, Lariviere V. Factors affecting sex-related reporting in medical research: A cross-disciplinary bibliometric analysis. Lancet. 2019;393(10171):550–559. doi: 10.1016/S0140-6736(18)32995-7. [DOI] [PubMed] [Google Scholar]
- 19.Settles IH, Jones MK, Buchanan NT, Brassel ST. Epistemic exclusion of women faculty and faculty of color: Understanding scholar(ly) devaluation as a predictor of turnover intentions. J Higher Educ. 2022;93(1):31–55. doi: 10.1080/00221546.2021.1914494. [DOI] [Google Scholar]
- 20.Murrar S, Johnson PA, Lee YG, Carnes M. Research conducted in women was deemed more impactful but less publishable than the same research conducted in men. J Womens Health. 2021;30(9):1259–1267. doi: 10.1089/jwh.2020.8666. [DOI] [PMC free article] [PubMed] [Google Scholar]
- 21.Lewis D, Paulen E, eds. Proceedings of the diversity and inclusion innovation forum: Unconscious bias in academic medicine. Washington, DC: Association of American Medical Colleges and the Kirwan Institute for the Study of Race and Ethnicity; 2017;71. [Google Scholar]
- 22.Moss-Racusin CA, van der Toorn J, Dovidio JF, Brescoll VL, Graham MJ, Handelsman J. Scientific diversity interventions. Science. 2014;343(6171):615–616. doi: 10.1126/science.1245936. [DOI] [PubMed] [Google Scholar]
- 23.Somerville W, Williams Kapten S, Miao I, Dunn J, Chang D. Identifying and remediating personal prejudice: What does the evidence say? In: Benuto L, Duckworth M, Masuda A, O’Donohue W, eds. Prejudice, Stigma, Privilege, and Oppression. New York, NY: Springer; 2020. doi: 10.1007/978-3-030-35517-3_11. [DOI] [Google Scholar]
- 24.Monin B, Miller DT. Moral credentials and the expression of prejudice. J Pers Soc Psychol. 2001;81(1):33–43. doi: 10.1037/0022-3514.81.1.33. [DOI] [PubMed] [Google Scholar]
- 25.Carr PB, Dweck CS, Pauker K. “Prejudiced” behavior without prejudice? Beliefs about the malleability of prejudice affect interracial interactions. J Pers Soc Psychol. 2012;103(3):452–471. doi: 10.1037/a0028849. [DOI] [PMC free article] [PubMed] [Google Scholar]
- 26.Duguid MM, Thomas-Hunt MC. Condoning stereotyping? How awareness of stereotyping prevalence impacts expression of stereotypes. J Appl Psychol. 2015;100(2):343–359. doi: 10.1037/a0037908. [DOI] [PubMed] [Google Scholar]
- 27.Rattan A, Dweck CS. What happens after prejudice is confronted in the workplace? How mindsets affect minorities’ and women’s outlook on future social relations. J Appl Psychol. 2018;103(6):676–687. doi: 10.1037/apl0000287. [DOI] [PubMed] [Google Scholar]
- 28.Shea CM, Malone MFT, Griffith JA, Staneva V, Graham KJ, Banyard V. Please feel free to intervene: A longitudinal analysis of the consequences of bystander behavioral expectations. J Divers High Educ. 2021. doi: 10.1037/dhe0000348. [DOI] [Google Scholar]
- 29.Pietri ES, Hennes EP, Dovidio JF, et al. Addressing unintended consequences of gender diversity interventions on women’s sense of belonging in STEM. Sex Roles. 2019;80(9–10):527–547. doi: 10.1007/s11199-018-0952-2. [DOI] [Google Scholar]
- 30.Dobbin F, Kalev A. Why diversity programs fail. Harv Bus Rev. 2016;94(7):14. [Google Scholar]
- 31.Prochaska JO, DiClemente CC. Transtheoretical model: Toward a more integrative model of change. Psychotherapy. 1982;19(3):276–288. doi: 10.1037/h0088437. [DOI] [Google Scholar]
- 32.Prochaska JO, Velicer WF, Rossi JS, et al. Stages of change and decisional balance for 12 problem behaviors. Health Psychol. 1994;13(1):39–46. doi: 10.1037//0278-6133.13.1.39. [DOI] [PubMed] [Google Scholar]
- 33.Bandura A Self-efficacy: Toward a unifying theory of behavioral change. Psychol Rev. 1977;84:191–215. doi: 10.1037/0033-295X.84.2.191. [DOI] [PubMed] [Google Scholar]
- 34.Bandura A Social cognitive theory of self-regulation. Organ Behav Hum Decis Process. 1991;50(2):248–287. doi: 10.1016/0749-5978(91)90022-L. [DOI] [Google Scholar]
- 35.Carnes M, Devine PG, Isaac C, et al. Promoting institutional change through bias literacy. J Divers High Educ. 2012;5(2):63–77. doi: 10.1037/a0028128. [DOI] [PMC free article] [PubMed] [Google Scholar]
- 36.Carnes M, Devine PG, Manwell LB, et al. The effect of an intervention to break the gender bias habit for faculty at one institution: A cluster randomized, controlled trial. Acad Med. 2015;90(2):221–230. doi: 10.1097/ACM.0000000000000552. [DOI] [PMC free article] [PubMed] [Google Scholar]
- 37.Devine PG, Forscher PS, Cox WTL, Kaatz A, Sheridan J, Carnes M. A gender bias habit-breaking intervention led to increased hiring of female faculty in STEMM departments. J Exp Soc Psychol. 2017;73:211–215. doi: 10.1016/j.jesp.2017.07.002. [DOI] [PMC free article] [PubMed] [Google Scholar]
- 38.Hayes RJ, Moulton LH. Cluster Randomised Trials. 2nd ed. London, UK: Chapman and Hall/CRC Press; 2017. [Google Scholar]
- 39.Carnes M, Sheridan J, Fine E, Lee Y-G, Filut A, Topp S. Engaging faculty in a workshop intervention on overcoming the influence of implicit bias. J Clin Transl Sci. 2021;5(1):e135. doi: 10.1017/cts.2021.796. [DOI] [PMC free article] [PubMed] [Google Scholar]
- 40.Roskoski R Ranking tables of NIH funding to U.S. medical schools in 2017 (1 October 2016–30 September 2017). Blue Ridge Institute for Medical Research. Published 2017. https://brimr.org/brimr-rankings-of-nih-funding-in-2017/. Accessed May 12, 2023. [Google Scholar]
- 41.American College of Physicians. Subspecialties of internal medicine. ACPonline.org. https://www.acponline.org/about-acp/about-internal-medicine/subspecialties-of-internal-medicine. Accessed May 10, 2023.
- 42.de Hoop E, Teerenstra S, van Gaal BGI, Moerbeek M, Borm GF. The “best balance” allocation led to optimal balance in cluster-controlled trials. J Clin Epidemiol. 2012;65(2):132–137. doi: 10.1016/j.jclinepi.2011.05.006. [DOI] [PubMed] [Google Scholar]
- 43.Suresh K An overview of randomization techniques: An unbiased assessment of outcome in clinical research. J Hum Reprod Sci. 2011;4(1):8–11. doi: 10.4103/0974-1208.82352. [DOI] [PMC free article] [PubMed] [Google Scholar] [Retracted]
- 44.Perry M, Faes M, Reelick MF, Rikkert M, Borm GF. Studywise minimization: A treatment allocation method that improves balance among treatment groups and makes allocation unpredictable. J Clin Epidemiol. 2010;63(10):1118–1122. doi: 10.1016/j.jclinepi.2009.11.014. [DOI] [PubMed] [Google Scholar]
- 45.Stigsby B, Taves DR. Rank-minimization for balanced assignment of subjects in clinical trials. Contemp Clin Trials. 2010;31(2):147–150. doi: 10.1016/j.cct.2009.12.001. [DOI] [PubMed] [Google Scholar]
- 46.Gollwitzer PM, Sheeran P. Implementation intentions and goal achievement: A meta-analysis of effects and processes. Adv Exp Soc Psychol. 2006;38:69–119. doi: 10.1016/S0065-2601(06)38002-1. [DOI] [Google Scholar]
- 47.Isaac C, Manwell LB, Devine PG, Ford C, Sheridan JT, Carnes M. Difficult dialogues: Faculty responses to a gender bias literacy training program. Qual Rep. 2016;21(7):1243–1265. [DOI] [PMC free article] [PubMed] [Google Scholar]
- 48.Devine PG, Plant EA, Amodio DM, Harmon-Jones E, Vance SL. The regulation of explicit and implicit race bias: The role of motivations to respond without prejudice. J Pers Soc Psychol. 2002;82(5):835–848. doi: 10.1037/0022-3514.82.5.835. [DOI] [PubMed] [Google Scholar]
- 49.Women in Science and Engineering Leadership Institute. Results from the 2019 Study of Faculty Worklife at UW-Madison. https://wiseli.wisc.edu/wp-content/uploads/sites/662/2020/01/SFW2019_TT_FINAL.pdf. Published 2019. Accessed May 10, 2023. [Google Scholar]
- 50.Sheridan J, Savoy JN, Kaatz A, Lee YG, Filut A, Carnes M. Write more articles, get more grants: The impact of department climate on faculty research productivity. J Womens Health. 2017;26(5):587–596. doi: 10.1089/jwh.2016.6022. [DOI] [PMC free article] [PubMed] [Google Scholar]
- 51.Sheridan JT, Fine E, Pribbenow CM, Handelsman J, Carnes M. Searching for excellence and diversity: Increasing the hiring of women faculty at one academic medical center. Acad Med. 2010;85(6):999–1007. doi: 10.1097/ACM.0b013e3181dbf75a. [DOI] [PMC free article] [PubMed] [Google Scholar]
- 52.Rotenstein LS, Torre M, Ramos MA, et al. Prevalence of burnout among physicians: A systematic review. JAMA. 2018;320(11):1131–1150. doi: 10.1001/jama.2018.12777. [DOI] [PMC free article] [PubMed] [Google Scholar]
- 53.Plant EA, Devine PG. Internal and external motivation to respond without prejudice. J Pers Soc Psychol. 1998;75(3):811–832. doi: 10.1037/0022-3514.75.3.811. [DOI] [PubMed] [Google Scholar]
- 54.Royston P, White IR. Multiple imputation by chained equations (MICE): Implementation in Stata. J Stat Softw. 2011;45(4):1–20. doi: 10.18637/jss.v045.i04. [DOI] [Google Scholar]
- 55.White IR, Royston P, Wood AM. Multiple imputation using chained equations: Issues and guidance for practice. Stat Med. 2011;30(4):377–399. doi: 10.1002/sim.4067. [DOI] [PubMed] [Google Scholar]
- 56.Morris TP, White IR., Royston P. Tuning multiple imputation by predictive mean matching and local residual draws. BMC Med Res Methodol. 2014;14:1–13. doi: 10.1186/1471-2288-14-75. [DOI] [PMC free article] [PubMed] [Google Scholar]
- 57.Graham JW, Olchowski AE, Gilreath TD. How many imputations are really needed? Some practical clarifications of multiple imputation theory. Prev Sci. 2007;8(3):206–13. doi: 10.1007/s11121-007-0070-9. [DOI] [PubMed] [Google Scholar]
- 58.Stata 17. Version 17. StataCorp; 2021. http://www.stata.com/. Accessed May 10, 2023.
- 59.Cuddeback G, Wilson E, Orme JG, Combs-Orme T. Detecting and statistically correcting sample selection bias. J Soc Serv Res. 2004;30(3), 19–33. [Google Scholar]
- 60.Foster EM, Fang GY. Alternative methods for handling attrition: An illustration using data from the fast track evaluation. Eval Rev. 2004;28(5), 434–464. [DOI] [PMC free article] [PubMed] [Google Scholar]
- 61.Miller RB, Hollist CS. Attrition bias. In: Salkind N, ed. Encyclopedia of Measurement and Statistics, ume 1. Thousand Oaks, CA: Sage; 2007;57–60. [Google Scholar]
- 62.Hardy JH, Tey KS, Cyrus-Lai W, Martell RF, Olstad A, Uhlmann EL. Bias in context: Small biases in hiring evaluations have big consequences. J Manage 2022;48(3):657–692. doi: 10.1177/0149206320982654. [DOI] [Google Scholar]
- 63.Anvari F, Kievit RA, Lakens D, Pennington CR, Przybylski AK, Tiokhin L, Wiernik BM, Orben A. Not all effects are indispensable: Psychological science requires verifiable lines of reasoning for whether an effect matters. Perspect Psychol Sci. 2023;18(2):503–507. doi: 10.1177/17456916221091565. [DOI] [PubMed] [Google Scholar]
- 64.Cundiff J, Murray S. Good intentions are not enough: Assessing a gender bias literacy intervention for potential positive and negative outcomes. J Women Minor Sci Eng. 2020;26(6):511–540. doi: 10.1615/JWomenMinorScienEng.2020032359. [DOI] [Google Scholar]
- 65.Combs G, Luthans F. Diversity training: Analysis of the impact of self-efficacy. Hum Resour Dev Q. 2007;18(1):91–120. doi: 10.1002/hrdq.1193. [DOI] [Google Scholar]
- 66.Murrar S, Campbell MR, Brauer M. Exposure to peers’ pro-diversity attitudes increases inclusion and reduces the achievement gap. Nat Hum Behav. 2020;4(9):889–897. doi: 10.1038/s41562-020-0899-5. [DOI] [PubMed] [Google Scholar]
- 67.Cunningham CT, Quan H, Hemmelgarn B, et al. Exploring physician specialist response rates to web-based surveys. BMC Med Res Methodol. 2015;15:32. doi: 10.1186/s12874-015-0016-z. [DOI] [PMC free article] [PubMed] [Google Scholar]
- 68.Centola DM. Homophily, networks, and critical mass: Solving the start-up problem in large group collective action. Ration Soc. 2013;25:3–40. [Google Scholar]
- 69.Edmondson AC, Kramer RM, Cook KS. Psychological safety, trust, and learning in organizations: A group-level lens. In: Trust and Distrust in Organizations: Dilemmas and Approaches. Kramer R, Cook C, eds. New York, NY: Russell Sage Foundation; 2004;239–272. [Google Scholar]
- 70.Christakis NA, Fowler JH. The collective dynamics of smoking in a large social network. N Engl J Med. 2008;358:2249–2258. [DOI] [PMC free article] [PubMed] [Google Scholar]
Associated Data
This section collects any data citations, data availability statements, or supplementary materials included in this article.