Abstract
Background
Noninvasive identification of glioma subtypes is important for optimizing treatment strategies.
Purpose
To compare the in vivo neurochemical profiles between isocitrate dehydrogenase (IDH) 1–mutant 1p/19q codeleted gliomas and their noncodeleted counterparts measured by MR spectroscopy at 3.0 T with a point-resolved spectroscopy (PRESS) sequence optimized for D-2-hydroxyglutarate (2HG) detection.
Materials and Methods
Adults with IDH1-mutant gliomas were retrospectively included for this study from two university hospitals (inclusion period: January 2015 to July 2016 and September 2019 to June 2021, respectively) based on availability of 1p/19q codeletion status and a PRESS acquisition optimized for 2HG detection (echo time, 97 msec) at 3.0 T before any treatment. Spectral analysis was performed using LCModel and a simulated basis set. Metabolite quantification was performed using the water signal as a reference and correcting for water and metabolite longitudinal and transverse relaxation time constants. Concentration ratios were computed using total creatine (tCr) and total choline. A two-tailed unpaired t test was used to compare metabolite concentrations obtained in codeleted versus noncodeleted gliomas, accounting for multiple comparisons.
Results
Thirty-one adults (mean age, 39 years ± 8 [SD]; 19 male) were included, and 19 metabolites were quantified. Cystathionine concentration was higher in codeleted (n = 13) than noncodeleted (n = 18) gliomas when quantification was performed using the water signal or tCr as references (2.33 mM ± 0.98 vs 0.93 mM ± 0.94, and 0.34 mM ± 0.14 vs 0.14 mM ± 0.14, respectively; both P < .001). The sensitivity and specificity of PRESS to detect codeletion by means of cystathionine quantification were 92% and 61%, respectively. Other metabolites did not show evidence of a difference between groups (P > .05).
Conclusion
Higher cystathionine levels were detected in IDH1-mutant 1p/19q codeleted gliomas than in their noncodeleted counterparts with use of a PRESS sequence optimized for 2HG detection. Of 19 metabolites quantified, only cystathionine showed evidence of a difference in concentration between groups.
Clinical trial registry no. NCT01703962
© RSNA, 2023
See also the editorial by Lin in this issue.
Summary
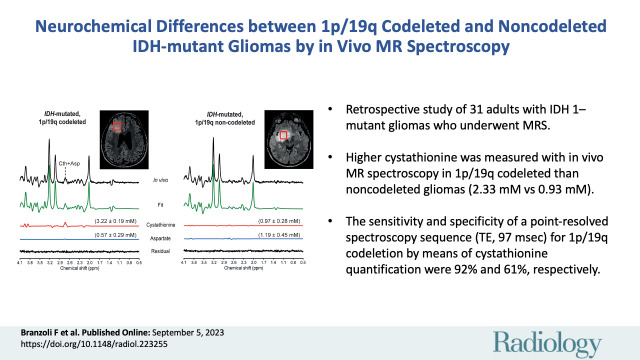
Of 19 metabolites quantified with in vivo MR spectroscopy, only cystathionine showed a significant difference in concentration between isocitrate dehydrogenase 1–mutant 1p/19q codeleted gliomas and their noncodeleted counterparts.
Key Results
■ In a retrospective study of 31 adults with isocitrate dehydrogenase 1–mutant gliomas, higher cystathionine was measured with in vivo MR spectroscopy in 1p/19q codeleted than noncodeleted gliomas (2.33 mM vs 0.93 mM; P < .001).
■ The sensitivity and specificity of a point-resolved spectroscopy sequence (echo time, 97 msec) for 1p/19q codeletion by means of cystathionine quantification were 92% and 61%, respectively.
■ No difference in other metabolites was detected between 1p/19q codeleted and noncodeleted gliomas (P > .05).
Introduction
Since 2016, the World Health Organization classification of tumors of the central nervous system has been based on integrated histologic and molecular assessment, yielding greater diagnostic accuracy and improved patient management compared with histologic analysis alone (1). The most common primary brain tumors are diffuse gliomas, which comprise a very heterogeneous group of tumors of glial origin and whose diagnostic and prognostic stratification relies today on the status of several molecular markers (2). The most clinically relevant genetic alterations in gliomas are mutations in the genes encoding for isocitrate dehydrogenase (IDH) 1 or 2 (3,4) and complete codeletion of the chromosome arms 1p and 19q (1p/19q codeletion) (5), the latter being found exclusively in IDH-mutant gliomas and conferring the best prognosis (6,7). The updated 2021 World Health Organization tumor classification (8) further emphasizes the importance of genotypic over phenotypic parameters. Three subtypes of glioma are characterized by a distinct clinical evolution and benefit from different therapeutic management: (a) IDH-mutant 1p/19q codeleted gliomas; (b) IDH-mutant 1p/19q noncodeleted gliomas; and (c) IDH-wild-type gliomas (or glioblastomas).
Molecular aberrations induce metabolic changes in cancer cells, whose consequences on tumorigenesis, tumor progression, and response to treatment are not well known (9). IDH mutations cause abnormal accumulation of D-2-hydroxyglutarate (2HG) (10), an established marker of these mutations, and several other metabolic changes, measured in vivo, ex vivo, and in cell cultures (9,11). While several studies have addressed metabolic differences in IDH-mutant versus IDH-wild-type gliomas (11), at the present time, little has been reported on altered metabolism in IDH-mutant 1p/19q codeleted gliomas compared with IDH-mutant 1p/19q intact gliomas. Understanding the biologic effects of 1p/19q codeletion may help identify novel therapeutic targets and better understand the mechanisms of progression and treatment response in these tumors.
Ex vivo (12) experiments suggest that the downregulation of genes located on chromosome 1p—namely phosphoglycerate dehydrogenase, or PHGDH, and cystathionine gamma-lyase, or CTH—results in reduced serine and glycine levels in 1p/19q codeleted compared with noncodeleted gliomas. Higher cystathionine levels were also reported in codeleted gliomas from both ex vivo glioma tissue analysis and in vivo edited proton MR spectroscopy (12). Cystathionine is synthesized from homocysteine in the transsulfuration pathway and is a precursor of glutathione, a major antioxidant (13). PHGDH and CTH are involved in the cystathionine pathway, and their downregulation due to 1p deletion was suggested to be the origin of cystathionine accumulation, in conjunction with higher expression of cystathionine-β-synthase, the first enzyme of the transsulfuration pathway (12).
Edited MR spectroscopy reliably detects cystathionine due to the lack of overlap between the cystathionine signal at 2.7 ppm and other resonances in the edited spectra (14). However, edited sequences and advanced postprocessing tools are not always available in current clinical practice. This limits the use of edited MR spectroscopy for diagnostic and prognostic purposes. In contrast, point-resolved spectroscopy (PRESS) is a standard MR spectroscopy method that can be used in routine clinical practice. In particular, PRESS with an echo time of 97 msec, which provides optimized detection of 2HG at 3.0 T (15,16), is currently the most commonly used method for the detection of the IDH mutation in vivo.
The aim of this study was to compare the in vivo neurochemical profiles between IDH-mutant 1p/19q codeleted gliomas and their noncodeleted counterparts measured with MR spectroscopy at 3.0 T with a PRESS sequence optimized for 2HG detection.
Materials and Methods
Study Sample
Forty-four consecutive adults were recruited from two sites: 25 adults were recruited at the Pitié-Salpêtrière University Hospital, Paris, France, and examined at the Center for Neuroimaging Research (the imaging platform of the Paris Brain Institute–ICM, site 1), while 19 adults were recruited at the Spedali Civili University Hospital, Brescia, Italy (site 2). Patients recruited at site 1 were enrolled for a prospective observational study (Non Invasive Identification of Gliomas With IDH1 Mutation trial, or IDASPE [ClinicalTrials.gov identifier NCT01703962]; inclusion period, January 2015 to July 2016) (17) approved by the local ethics committee. Patients recruited at site 2 were examined as part of their clinical care in the period from September 2019 to June 2021. All patients provided written informed consent before inclusion in the study.
Inclusion criteria were (a) being a candidate for surgery for a presumed low-grade glioma, (b) age older than 18 years, (c) Karnofsky performance status higher than 60, and (d) ability to provide written informed consent. Exclusion criteria were (a) lack of the IDH1 mutation as assessed with immunohistochemical and/or DNA sequence analyses; (b) unknown 1p/19q codeletion status; (c) previous treatments, including surgery; and (d) unavailability of the optimized PRESS acquisition (Fig 1).
Figure 1:
Study flowchart. IDH = isocitrate dehydrogenase, PRESS = point-resolved spectroscopy.
Seventeen patients examined at site 1 were already included in two previous publications (12,17). The first publication focused on 2HG detection in IDH-mutant gliomas with use of both edited MR spectroscopy and optimized PRESS before the discovery of cystathionine in vivo (17). The second publication focused on cystathionine detection in IDH-mutated gliomas using edited MR spectroscopy and ex vivo tissue analyses (12). Data from 17 different patients (11 examined at site 1, six at site 2) were previously included in the methodologic publication on the influence of cystathionine on the quantification of the full neurochemical profile (18).
In Vivo MRI/MR Spectroscopy Acquisition
Acquisitions were performed using 3.0-T whole-body systems (Magnetom Verio at site 1 and Skyra at site 2; Siemens Healthineers) using 32- and 20-channel receive-only head coils, respectively. Three-dimensional fluid-attenuated inversion-recovery images (site 1: field of view = 255 × 255 × 144 mm, resolution = 1.0 × 1.0 × 1.1 mm, repetition time msec/echo time msec = 5000/399, scanning time = 5.02 minutes; site 2: field of view = 242 × 227 × 176 mm, resolution = 0.5 × 0.5 × 1.0 mm, repetition time msec/echo time msec = 5000/394, scanning time = 6.27 minutes) were acquired to position the spectroscopic volume of interest (VOI) in the glioma.
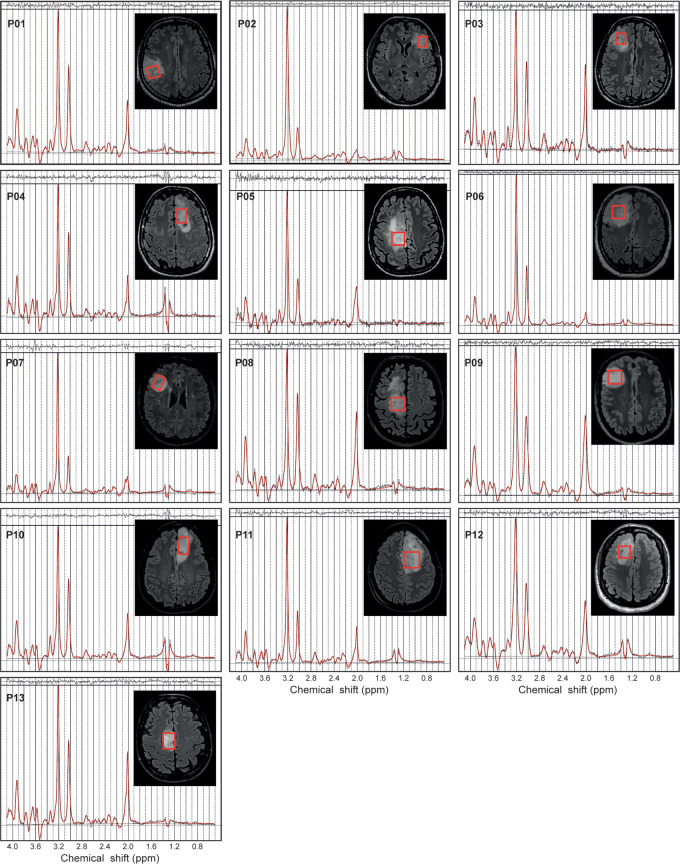
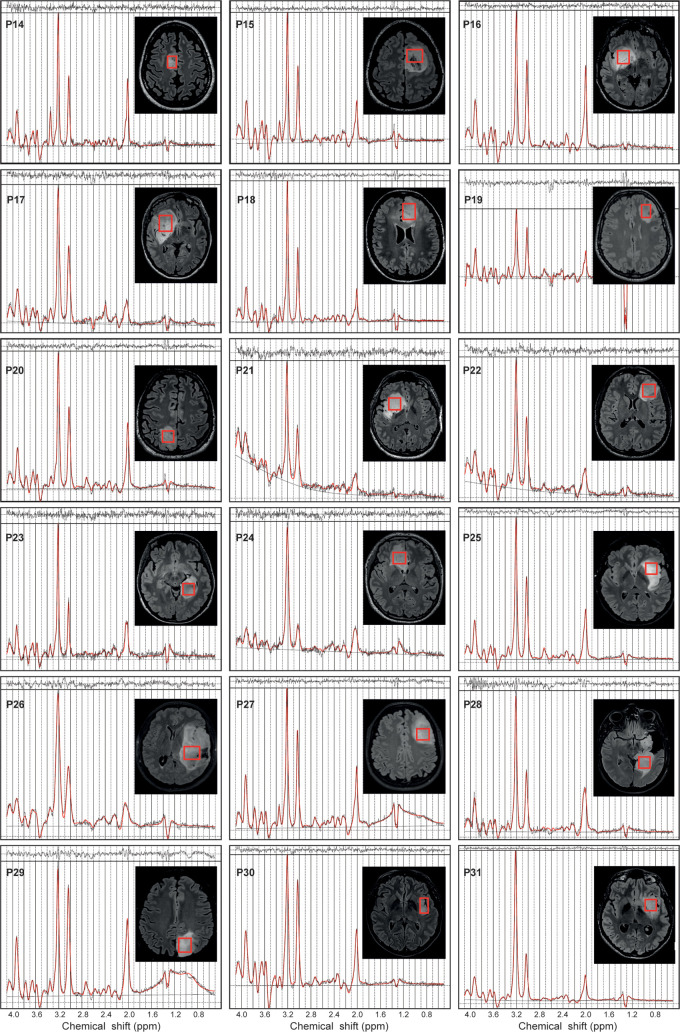
MR spectra were acquired at both sites by using the same single-voxel PRESS sequence (repetition time = 2.5 seconds, echo time = 97 msec, echo time 1 = 32 msec, echo time 2 = 65 msec, number of transients = 128, spectral width = 3 kHz, number of complex points = 2048, scanning time = 5.45 minutes) with use of previously described procedures and parameters (19). PRESS spatial localization used a 90° Hamming-filtered sinc pulse (duration = 2.32 msec; bandwidth = 3.83 kHz) and two 180° Mao pulses (duration = 5.80 msec; bandwidth = 1 kHz). The VOI placements are shown in Figures 2 and 3 for all codeleted and noncodeleted gliomas, respectively. VOI size and location were adapted for each glioma to minimize partial volume effects.
Figure 2:
In vivo MR spectra acquired with a point-resolved spectroscopy sequence optimized for D-2-hydroxyglutarate detection (echo time, 97 msec) in 13 patients with isocitrate dehydrogenase 1–mutant 1p/19q codeleted gliomas. The volumes of interest (red boxes) are shown on axial three-dimensional fluid-attenuation inversion-recovery images. Patients (P) 1–6 were included at site 1 (Centre for Neuroimaging Research Pitié-Salpêtrière Hospital, Paris, France). Patients 7–13 were included at site 2 (Spedali Civili University Hospital, Brescia, Italy). Demographic and clinical characteristics are summarized in Table 1. ppm = parts per million.
Figure 3:
In vivo MR spectra acquired with a point-resolved spectroscopy sequence optimized for D-2-hydroxyglutarate detection (echo time, 97 msec) in 18 patients with isocitrate dehydrogenase 1–mutant noncodeleted gliomas. The volumes of interest (red boxes) are shown on axial three-dimensional fluid-attenuation inversion-recovery images. Patients (P) 14–24 were included at site 1 (Centre for Neuroimaging Research Pitié-Salpêtrière Hospital, Paris, France). Patients 25–31 were included at site 2 (Spedali Civili University Hospital, Brescia, Italy). Demographic and clinical characteristics are summarized in Table 1. ppm = parts per million.
Water suppression was performed using variable power with optimized relaxation delays, or VAPOR, and outer volume suppression techniques (20). Unsuppressed water scans were acquired from the same VOI for metabolite quantification and eddy current corrections by using the same parameters as water-suppressed spectra. B0 shimming was performed using a fast automatic shimming technique with echo-planar signal trains using mapping along projections, or FAST(EST)MAP (21). For three patients, the PRESS acquisition was performed also in the contralateral region outside the visible lesion. For an additional five patients, only the MR spectra of the healthy side of the brain were considered for this study.
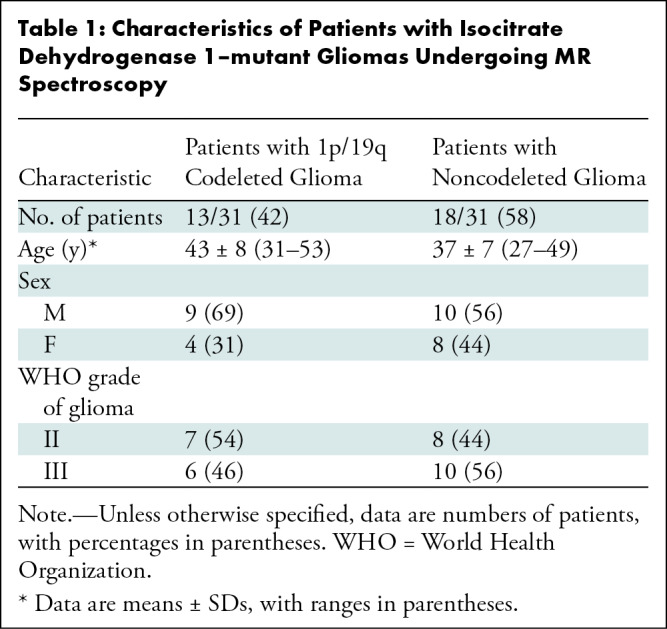
Demographic information is summarized in Table 1.
Table 1:
Characteristics of Patients with Isocitrate Dehydrogenase 1–mutant Gliomas Undergoing MR Spectroscopy
Spectral Processing and Quantification
Single transients were frequency- and phase-aligned in Matlab (version R2017b, MathWorks) with the total choline (tCho) signal at 3.22 ppm. All spectra were analyzed using LCModel (version 6.3–0G, Stephen Provencher) (22), with the basis sets simulated using the density matrix formalism (23) as previously described (17). Radiofrequency duration and patterns for 90° and 180° pulses, slice-selective gradients during 180° pulses, timing, and previously published chemical shifts and J-couplings (14,24–27) were taken into account. The basis set included 2HG, alanine, ascorbate, aspartate, betaine, citrate, cystathionine, creatine, ethanolamine, γ-aminobutyric acid, glucose, glutamate, glutamine, glutathione, glycerophosphorylcholine, glycine, myo-inositol, lactate, N-acetylaspartate, N-acetyl-aspartyl-glutamate, phosphocreatine, phosphorylcholine, phosphorylethanolamine, scyllo-inositol, serine, succinate, taurine, and threonine. Spectra were fitted between 0.5 and 4.1 ppm. The quantification was carried out by scaling the signal using the unsuppressed water reference, assuming a tumor bulk water concentration of 43.3 M, as performed previously (15). Water and metabolite relaxation effects were compensated using water transverse and longitudinal relaxation time constants (ie, T2 and T1) of 150 msec (28,29) and 800 msec (30), respectively, and previously reported metabolite T2 and T1 values (31,32). For J-coupled metabolites with unknown relaxation time constants, T2 and T1 of glutamate were used. The reported concentrations are semiquantitative. Concentrations relative to total creatine (ie, creatine plus phosphocreatine) (tCr) and tCho were also calculated for comparison.
Metabolites that were quantified with Cramér-Rao lower bounds (CRLB) lower than 50% for more than half of the gliomas in at least one of the two groups (codeleted vs noncodeleted gliomas) were included in the statistical analysis. The linewidths of tCr at 3.03 ppm were determined from the LCModel fit as the full width at half maximum of this peak.
Statistical Analysis
A two-tailed unpaired t test was used to compare metabolite concentrations obtained in 1p/19q codeleted versus noncodeleted gliomas. To control for multiple comparisons, Bonferroni correction was applied. P < .003 (ie, .05/19) was considered to indicate a statistically significant difference after Bonferroni correction. Coefficients of variations, defined as SD divided by mean, were calculated for cystathionine concentrations with use of three different scaling methods.
Results
Characteristics of Study Sample
Thirty-one adults with IDH1-mutant gliomas (grade II or III) were retrospectively included in the analysis for this study (Fig 1). Of these, 13 had 1p/19q codeleted gliomas (nine male adults; mean age, 43 years ± 8 [SD] [range, 31–53 years]) and 18 had noncodeleted gliomas (10 male adults; mean age, 37 years ± 7 [range, 27–49 years]) (Table 1).
1p/19q Codeleted versus Noncodeleted Gliomas
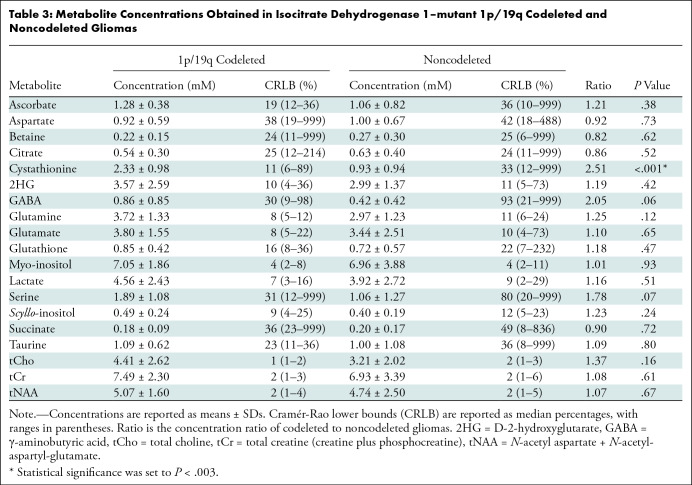
The quality of the MR spectra was similar across glioma subtypes and sites (Figs 2, 3). No data were excluded on the basis of quality criteria (linewidth and CRLB). The mean VOI size was 11.3 mL ± 3.3 (range, 7.2–15.6 mL) for 1p/19q codeleted and 10.9 mL ± 3.2 (range, 6.1–16.5 mL) for noncodeleted gliomas. The codeleted and noncodeleted glioma groups did not show evidence of a difference in the mean tCr linewidth, which was 4.5 Hz ± 1.0 (range, 3.6–7.3 Hz) and 5.2 Hz ± 1.1 (range, 3.6–8.0 Hz), respectively (P = .31) (Table 2). LCModel analyses in IDH1-mutant 1p/19q codeleted and noncodeleted gliomas are shown in Figures 2–4. Nineteen metabolites were included in the statistical analysis: 2HG, ascorbate, aspartate, betaine, citrate, cystathionine, γ-aminobutyric acid, glutamate, glutamine, glutathione, myo-inositol, lactate, N-acetylaspartate + N-acetyl-aspartyl-glutamate, scyllo-inositol, serine, succinate, taurine, tCr, and tCho. Cystathionine was the only metabolite that showed evidence of a difference in concentration between the two groups (Table 3), and it was higher in codeleted versus noncodeleted gliomas (mean concentration, 2.33 mM ± 0.98 [range, 0.3–3.7 mM] vs 0.93 mM ± 0.94 [range, 0–2.9 mM]; P < .001) (Fig 5). Median CRLB associated with cystathionine quantification were 11% and 33% in the codeleted versus noncodeleted groups, respectively. Median CRLB were reported instead of mean values because their distribution strongly deviated from the Gaussian distribution (concentrations equal or very close to zero are always associated with very high CRLB up to 999%). As tCr and tCho are the two most prominent peaks in the spectra and they did not differ significantly between groups, relative metabolite concentrations were calculated as ratios over these two metabolites. A significant difference in cystathionine concentration between the two groups was obtained when metabolite concentrations were scaled using tCr (0.34 mM ± 0.14 vs 0.14 mM ± 0.14; P < .001), while tCho scaling showed higher variability (0.52 mM ± 0.30 vs 0.30 mM ± 0.32; P = .056). The interindividual coefficients of variations for cystathionine were 42%, 43%, and 57% for the three scaling methods (water, tCr, tCho), respectively, for the codeleted group, and 101%, 105%, and 110%, respectively, for the noncodeleted group.
Table 2:
Parameters of the MR Spectroscopy Acquisition

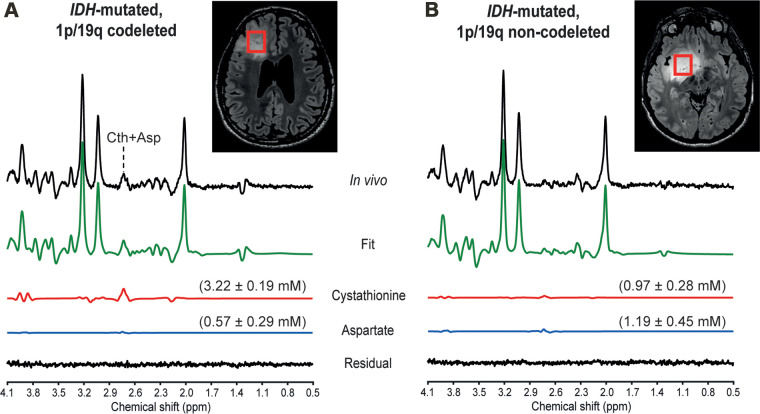
Figure 4:
In vivo MR spectra acquired at 3.0 T with a point-resolved spectroscopy sequence optimized for D-2-hydroxyglutarate detection in two patients, (A) a 31-year-old male patient with an isocitrate dehydrogenase (IDH) 1–mutant 1p/19q codeleted glioma and (B) a 39-year-old male patient with an IDH1-mutant 1p/19q noncodeleted glioma. In vivo spectra are shown together with the LCModel fit, the cystathionine (Cth) and aspartate (Asp) contributions, and the residual. Shown in parentheses is the metabolite concentration ± Cramér-Rao lower bounds in millimolars. No line broadening was applied. The volumes of interest (red boxes) are shown on axial three-dimensional fluid-attenuation inversion-recovery images. ppm = parts per million.
Table 3:
Metabolite Concentrations Obtained in Isocitrate Dehydrogenase 1–mutant 1p/19q Codeleted and Noncodeleted Gliomas
Figure 5:
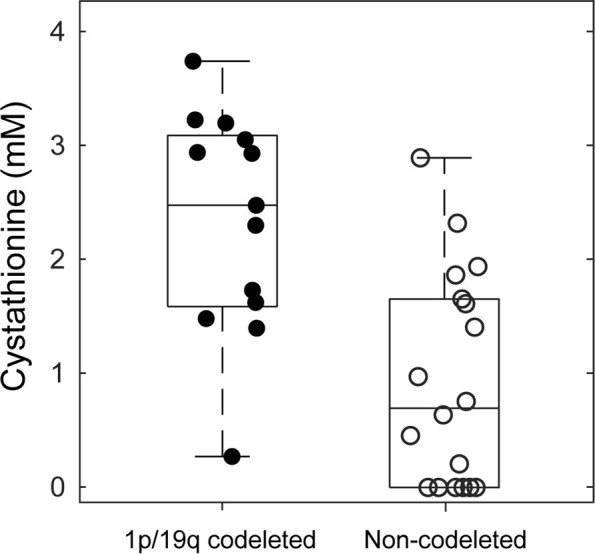
Box plots of cystathionine concentrations in 1p/19q codeleted (filled circles) versus noncodeleted gliomas (empty circles). For each box, the midline indicates the median concentration, and the bottom and top edges indicate the 25th and 75th percentiles, respectively. Circles represent values from individual patients with gliomas. Whiskers indicate the highest and lowest data points.
Cystathionine was detected with concentration higher than 1.4 mM and CRLB lower than 25% in all 1p/19q codeleted gliomas except one. In these tumors, the cystathionine signal was visually identified at 2.7 ppm, where it partially overlapped with the aspartate signal (Fig 4A). The fitting correlation coefficients between cystathionine and aspartate calculated by LCModel were −0.47 and −0.35 for codeleted and noncodeleted gliomas, respectively. The combined measure of cystathionine plus aspartate was also higher in codeleted versus noncodeleted gliomas (2.42 mM ± 0.77 vs 1.44 mM ± 0.88; P = .002). With an arbitrary threshold of 1 mM concentration or 25% CRLB, chosen based on a previous in vivo study (18), the sensitivity and specificity of this method for 1p/19q codeletion identification were 92% (12 of 13 gliomas) and 61% (11 of 18 gliomas), respectively.
Cystathionine was not detectable in normal brain tissue (mean concentration, 0.27 mM ± 0.30 [range, 0–0.9 mM]; median CRLB, 156% [range, 53%–999%]).
Discussion
Noninvasive identification of glioma subtypes is essential for optimal therapeutic strategy. We investigated the in vivo metabolic profiles of 31 adults with isocitrate dehydrogenase 1–mutant gliomas with and without 1p/19q codeletion. These profiles were obtained with a point-resolved spectroscopy sequence optimized for D-2-hydroxyglutarate detection (echo time, 97 msec) (15) at 3.0 T. We found that, among the 19 metabolites quantified, cystathionine was the only metabolite showing a significant difference in concentration between codeleted and noncodeleted gliomas. Cystathionine levels were higher in the codeleted gliomas (2.33 mM ± 0.98 vs 0.93 mM ± 0.94; P < .001). In our study, we observed a high sensitivity of 92% to identify the 1p/19q codeletion, with a lower specificity of 61%.
Our results agree with a previous report, which did not show evidence of a difference between tumors with and without 1p/19q codeletion for any metabolite (33); however, in that study, cystathionine was not included in the analysis.
In our current study, the cystathionine finding was very consistent between water and tCr scaling methods used for the calculation of metabolite concentrations. In contrast, tCho scaling showed higher variability, suggesting higher variability in tCho than tCr or water concentrations. Overall, the high coefficients of variation, especially in the noncodeleted group, reflect the high heterogeneity of cystathionine concentration in these tumors, possibly due to complete or partial deletion of chromosome 1p in some of them (12), which we were not able to assess. An additional source of variability could be linked to tumoral genetic heterogeneity, as the rare coexistence of codeleted and noncodeleted cells in gliomas has been described (34). Nevertheless, these genetically mixed gliomas are too rare to explain that seven of 18 noncodeleted gliomas (39%) had cystathionine concentration levels in the range of those of codeleted gliomas.
In our previous study, we reported elevated cystathionine levels in 1p/19q codeleted gliomas compared with their noncodeleted counterparts with use of edited MR spectroscopy (12). Edited MR spectroscopy enables the measurement of both cystathionine and 2HG with no overlap from other metabolites, potentially increasing the specificity in the detection of IDH mutations compared with other methods based on conventional MR spectroscopy (17). Yet, PRESS with an echo time of 97 msec is probably the most commonly used method of MR spectroscopy to detect IDH-mutant gliomas by means of 2HG quantification. Thus, we sought to evaluate the utility of PRESS for the identification of 1p/19q codeletion (by means of cystathionine quantification) and possibly other concomitant metabolic changes. Although the concentrations of other metabolites, such as serine and glycine, were suggested to differ significantly between codeleted and noncodeleted gliomas according to ex vivo data in our previous study (12), these differences were not detectable in vivo in our current study. This is possibly due to the relatively small study sample and the limited ability to quantify these metabolites by using PRESS with an echo time of 97 msec, combined with the low concentrations of both serine and glycine in low-grade gliomas, and even more so in 1p/19q codeleted tumors (12).
In the past few years, other imaging markers—such as the T2/fluid-attenuated inversion-recovery mismatch sign, texture, susceptibility imaging, presence of calcifications, contrast enhancement, and tumor location—have been suggested to enable noninvasive identification of the 1p/19q codeletion. Yet, none of these radiologic features have shown both high specificity and sensitivity for the assessment of either codeletion or IDH mutational status (33,35–38). Indeed, although highly specific to noncodeleted gliomas, the T2/fluid-attenuated inversion-recovery mismatch sign is not frequently observed (38). On the other hand, 1p/19q codeleted gliomas share some radiologic characteristics with glioblastomas (IDH-wild-type gliomas), for example, in terms of contrast enhancement, heterogeneous appearance, and restricted water diffusivity (39). Thus, radiologic evaluation based only on imaging may lead to misclassification of these tumors, with adverse clinical consequences.
Our results suggest that the addition of optimized MR spectroscopy to current multimodal clinical protocols may notably increase the sensitivity and specificity to determine both IDH mutational status and 1p/19q codeletion by quantifying 2HG and cystathionine, respectively. In particular, the detectability of cystathionine in a brain lesion suspected to be an oligodendroglioma (1p/19q codeleted by definition) based on conventional MRI represents an additional factor in favor of this diagnosis and helps decision-making regarding the choice of treatment and extent of surgery (40). Additionally, cystathionine levels may dynamically change during the course of the disease and could be useful markers of tumor response to treatment.
Our study had limitations. First, we included a small study sample, which may have prevented the detection of small differences in concentrations of other metabolites besides cystathionine. Second, the overlap in cystathionine concentration between codeleted and noncodeleted gliomas may represent a limitation to the use of this metabolite alone as a marker of the 1p/19q codeletion. Third, it was impossible to determine whether noncodeleted gliomas with high cystathionine levels presented a complete or a partial deletion of chromosome 1p. Fourth, the detectability of cystathionine in clinical routine is currently hampered by the need for specific expertise for data analysis and quantification. The results presented in this study support the need for developing automated acquisition and postprocessing pipelines that will provide immediate information on the presence of key oncometabolites.
In conclusion, of 19 metabolites quantified with use of in vivo MR spectroscopy, only cystathionine showed a significant difference in concentration between isocitrate dehydrogenase–mutant 1p/19q codeleted gliomas and their noncodeleted counterparts. Higher cystathionine levels were detected in codeleted gliomas with use of a point-resolved spectroscopy sequence optimized for D-2-hydroxyglutarate detection. Our results underline the utility of cystathionine analysis as a powerful complement to conventional MRI for the characterization of low-grade gliomas in clinical practice. Our data consistently pointed to cystathionine as the most useful biomarker for the identification of 1p/19q codeleted gliomas. Planned future studies will aim at understanding the biologic mechanisms underlying the abnormal accumulation of cystathionine in a subset of noncodeleted gliomas and evaluate the clinical relevance of this metabolite for the assessment of treatment response and progression. Further investigations with larger study samples are also needed to assess the optimal threshold of cystathionine concentration for the detection of the codeletion and to assess the prediction accuracy of this metabolite in combination with other imaging markers.
Acknowledgments
Acknowledgments
The authors thank Edward J. Auerbach, PhD, for implementing MR spectroscopy sequences on the Siemens platform and François-Xavier Lejeune, PhD, from the ICM Data Analysis Core for advice on statistical analysis.
F. Branzoli and S.L. supported by Investissements d’Avenir (grants ANR-10-IAIHU-06 and ANR-11-INBS-0006). F. Branzoli supported by Agence Nationale de la Recherche (grant ANR-20-CE17-0002-01). D.K.D. and M.M. supported by the National Institutes of Health (grants BTRC P41 EB015894 and P30 NS076408). M.S. supported by INCa-DGOS-Inserm_12560 (SiRIC CURAMUS). M.M. supported by the National Institutes of Health (grant U01CA269110).
Data sharing: Data generated or analyzed during the study are available from the corresponding author by request.
Disclosures of conflicts of interest: F. Branzoli No relevant relationships. R.L. No relevant relationships. D.K.D. Support to attend workshop and meeting from the Swiss National Science Foundation and National Institutes of Health. P.L.P. No relevant relationships. F. Bielle Support for attending meetings or travel from Bristol Myers Squibb. L.N. No relevant relationships. M.S. Support from Programme de Recherche Hospitalier; member of the scientific advisory board for Genenta; member of the monitoring advisory board for Amplify and Neovac. S.L. No relevant relationships. M.M. No relevant relationships.
Abbreviations:
- CRLB
- Cramér-Rao lower bounds
- 2HG
- D-2-hydroxyglutarate
- IDH
- isocitrate dehydrogenase
- PRESS
- point-resolved spectroscopy
- tCho
- total choline
- tCr
- total creatine
- VOI
- volume of interest
References
- 1. Louis DN , Perry A , Reifenberger G , et al . The 2016 World Health Organization classification of tumors of the central nervous system: a summary . Acta Neuropathol (Berl) 2016. ; 131 ( 6 ): 803 – 820 . [DOI] [PubMed] [Google Scholar]
- 2. Kristensen BW , Priesterbach-Ackley LP , Petersen JK , Wesseling P . Molecular pathology of tumors of the central nervous system . Ann Oncol 2019. ; 30 ( 8 ): 1265 – 1278 . [DOI] [PMC free article] [PubMed] [Google Scholar]
- 3. Yan H , Parsons DW , Jin G , et al . IDH1 and IDH2 mutations in gliomas . N Engl J Med 2009. ; 360 ( 8 ): 765 – 773 . [DOI] [PMC free article] [PubMed] [Google Scholar]
- 4. Watanabe T , Nobusawa S , Kleihues P , Ohgaki H . IDH1 mutations are early events in the development of astrocytomas and oligodendrogliomas . Am J Pathol 2009. ; 174 ( 4 ): 1149 – 1153 . [DOI] [PMC free article] [PubMed] [Google Scholar]
- 5. Reifenberger J , Reifenberger G , Liu L , James CD , Wechsler W , Collins VP . Molecular genetic analysis of oligodendroglial tumors shows preferential allelic deletions on 19q and 1p . Am J Pathol 1994. ; 145 ( 5 ): 1175 – 1190 . [PMC free article] [PubMed] [Google Scholar]
- 6. Cairncross JG , Ueki K , Zlatescu MC , et al . Specific genetic predictors of chemotherapeutic response and survival in patients with anaplastic oligodendrogliomas . J Natl Cancer Inst 1998. ; 90 ( 19 ): 1473 – 1479 . [DOI] [PubMed] [Google Scholar]
- 7. Eckel-Passow JE , Lachance DH , Molinaro AM , et al . Glioma groups based on 1p/19q, IDH, and TERT promoter mutations in tumors . N Engl J Med 2015. ; 372 ( 26 ): 2499 – 2508 . [DOI] [PMC free article] [PubMed] [Google Scholar]
- 8. Louis DN , Perry A , Wesseling P , et al . The 2021 WHO Classification of Tumors of the Central Nervous System: a summary . Neuro-oncol 2021. ; 23 ( 8 ): 1231 – 1251 . [DOI] [PMC free article] [PubMed] [Google Scholar]
- 9. Hvinden IC , Cadoux-Hudson T , Schofield CJ , McCullagh JSO . Metabolic adaptations in cancers expressing isocitrate dehydrogenase mutations . Cell Rep Med 2021. ; 2 ( 12 ): 100469 . [DOI] [PMC free article] [PubMed] [Google Scholar]
- 10. Dang L , White DW , Gross S , et al . Cancer-associated IDH1 mutations produce 2-hydroxyglutarate . Nature 2009. ; 462 ( 7274 ): 739 – 744 . [DOI] [PMC free article] [PubMed] [Google Scholar]
- 11. Branzoli F , Marjańska M . Magnetic resonance spectroscopy of isocitrate dehydrogenase mutated gliomas: current knowledge on the neurochemical profile . Curr Opin Neurol 2020. ; 33 ( 4 ): 413 – 421 . [DOI] [PMC free article] [PubMed] [Google Scholar]
- 12. Branzoli F , Pontoizeau C , Tchara L , et al . Cystathionine as a marker for 1p/19q codeleted gliomas by in vivo magnetic resonance spectroscopy . Neuro-oncol 2019. ; 21 ( 6 ): 765 – 774 . [DOI] [PMC free article] [PubMed] [Google Scholar]
- 13. Vitvitsky V , Thomas M , Ghorpade A , Gendelman HE , Banerjee R . A functional transsulfuration pathway in the brain links to glutathione homeostasis . J Biol Chem 2006. ; 281 ( 47 ): 35785 – 35793 . [DOI] [PubMed] [Google Scholar]
- 14. Branzoli F , Deelchand DK , Sanson M , Lehéricy S , Marjańska M . In vivo 1H MRS detection of cystathionine in human brain tumors . Magn Reson Med 2019. ; 82 ( 4 ): 1259 – 1265 . [DOI] [PMC free article] [PubMed] [Google Scholar]
- 15. Choi C , Ganji SK , DeBerardinis RJ , et al . 2-Hydroxyglutarate detection by magnetic resonance spectroscopy in IDH-mutated patients with gliomas . Nat Med 2012. ; 18 ( 4 ): 624 – 629 . [DOI] [PMC free article] [PubMed] [Google Scholar]
- 16. Choi C , Raisanen JM , Ganji SK , et al . Prospective longitudinal analysis of 2-hydroxyglutarate magnetic resonance spectroscopy identifies broad clinical utility for the management of patients with IDH-mutant glioma . J Clin Oncol 2016. ; 34 ( 33 ): 4030 – 4039 . [DOI] [PMC free article] [PubMed] [Google Scholar]
- 17. Branzoli F , Di Stefano AL , Capelle L , et al . Highly specific determination of IDH status using edited in vivo magnetic resonance spectroscopy . Neuro-oncol 2018. ; 20 ( 7 ): 907 – 916 . [DOI] [PMC free article] [PubMed] [Google Scholar]
- 18. Branzoli F , Deelchand DK , Liserre R , et al . The influence of cystathionine on neurochemical quantification in brain tumor in vivo MR spectroscopy . Magn Reson Med 2022. ; 88 ( 2 ): 537 – 545 . [DOI] [PMC free article] [PubMed] [Google Scholar]
- 19. Mescher M , Merkle H , Kirsch J , Garwood M , Gruetter R . Simultaneous in vivo spectral editing and water suppression . NMR Biomed 1998. ; 11 ( 6 ): 266 – 272 . [DOI] [PubMed] [Google Scholar]
- 20. Tkác I , Starcuk Z , Choi IY , Gruetter R . In vivo 1H NMR spectroscopy of rat brain at 1 ms echo time . Magn Reson Med 1999. ; 41 ( 4 ): 649 – 656 . [DOI] [PubMed] [Google Scholar]
- 21. Gruetter R , Tkác I . Field mapping without reference scan using asymmetric echo-planar techniques . Magn Reson Med 2000. ; 43 ( 2 ): 319 – 323 . [DOI] [PubMed] [Google Scholar]
- 22. Provencher SW . Estimation of metabolite concentrations from localized in vivo proton NMR spectra . Magn Reson Med 1993. ; 30 ( 6 ): 672 – 679 . [DOI] [PubMed] [Google Scholar]
- 23. Henry PG , Marjanska M , Walls JD , Valette J , Gruetter R , Ugurbil K . Proton-observed carbon-edited NMR spectroscopy in strongly coupled second-order spin systems . Magn Reson Med 2006. ; 55 ( 2 ): 250 – 257 . [DOI] [PubMed] [Google Scholar]
- 24. Govindaraju V , Young K , Maudsley AA . Proton NMR chemical shifts and coupling constants for brain metabolites . NMR Biomed 2000. ; 13 ( 3 ): 129 – 153 . [DOI] [PubMed] [Google Scholar]
- 25. Kaiser LG , Marjańska M , Matson GB , et al . 1H MRS detection of glycine residue of reduced glutathione in vivo . J Magn Reson 2010. ; 202 ( 2 ): 259 – 266 . [DOI] [PMC free article] [PubMed] [Google Scholar]
- 26. Wishart DS , Knox C , Guo AC , et al . HMDB: a knowledgebase for the human metabolome . Nucleic Acids Res 2009. ; 37 ( Database issue ): D603 – D610 . [DOI] [PMC free article] [PubMed] [Google Scholar]
- 27. Stefan D , Cesare FD , Andrasescu A , et al . Quantitation of magnetic resonance spectroscopy signals: the jMRUI software package . Meas Sci Technol 2009. ; 20 ( 10 ): 104035 . [Google Scholar]
- 28. Madan A , Ganji SK , An Z , et al . Proton T2 measurement and quantification of lactate in brain tumors by MRS at 3 Tesla in vivo . Magn Reson Med 2015. ; 73 ( 6 ): 2094 – 2099 . [DOI] [PMC free article] [PubMed] [Google Scholar]
- 29. Berrington A , Voets NL , Plaha P , et al . Improved localisation for 2-hydroxyglutarate detection at 3T using long-TE semi-LASER . Tomography 2016. ; 2 ( 2 ): 94 – 105 . [DOI] [PMC free article] [PubMed] [Google Scholar]
- 30. Rooney WD , Johnson G , Li X , et al . Magnetic field and tissue dependencies of human brain longitudinal 1H2O relaxation in vivo . Magn Reson Med 2007. ; 57 ( 2 ): 308 – 318 . [DOI] [PubMed] [Google Scholar]
- 31. Deelchand DK , Auerbach EJ , Kobayashi N , Marjańska M . Transverse relaxation time constants of the five major metabolites in human brain measured in vivo using LASER and PRESS at 3 T . Magn Reson Med 2018. ; 79 ( 3 ): 1260 – 1265 . [DOI] [PMC free article] [PubMed] [Google Scholar]
- 32. Träber F , Block W , Lamerichs R , Gieseke J , Schild HH . 1H metabolite relaxation times at 3.0 tesla: Measurements of T1 and T2 values in normal brain and determination of regional differences in transverse relaxation . J Magn Reson Imaging 2004. ; 19 ( 5 ): 537 – 545 . [DOI] [PubMed] [Google Scholar]
- 33. Fellah S , Caudal D , De Paula AM , et al . Multimodal MR imaging (diffusion, perfusion, and spectroscopy): is it possible to distinguish oligodendroglial tumor grade and 1p/19q codeletion in the pretherapeutic diagnosis? AJNR Am J Neuroradiol 2013. ; 34 ( 7 ): 1326 – 1333 . [DOI] [PMC free article] [PubMed] [Google Scholar]
- 34. Barresi V , Lionti S , Valori L , Gallina G , Caffo M , Rossi S . Dual-genotype diffuse low-grade glioma: is it really time to abandon oligoastrocytoma as a distinct entity? J Neuropathol Exp Neurol 2017. ; 76 ( 5 ): 342 – 346 . [DOI] [PubMed] [Google Scholar]
- 35. Lasocki A , Gaillard F , Gorelik A , Gonzales M . MRI features can predict 1p/19q status in intracranial gliomas . AJNR Am J Neuroradiol 2018. ; 39 ( 4 ): 687 – 692 . [DOI] [PMC free article] [PubMed] [Google Scholar]
- 36. Batchala PP , Muttikkal the , Donahue JH , et al . Neuroimaging-based classification algorithm for predicting 1p/19q-codeletion status in IDH-mutant lower grade gliomas . AJNR Am J Neuroradiol 2019. ; 40 ( 3 ): 426 – 432 . [DOI] [PMC free article] [PubMed] [Google Scholar]
- 37. Smits M . Imaging of oligodendroglioma . Br J Radiol 2016. ; 89 ( 1060 ): 20150857 . [DOI] [PMC free article] [PubMed] [Google Scholar]
- 38. Patel SH , Poisson LM , Brat DJ , et al . T2-FLAIR mismatch, an imaging biomarker for IDH and 1p/19q status in lower-grade gliomas: a TCGA/TCIA project . Clin Cancer Res 2017. ; 23 ( 20 ): 6078 – 6085 . [DOI] [PubMed] [Google Scholar]
- 39. Sanvito F , Castellano A , Falini A . Advancements in neuroimaging to unravel biological and molecular features of brain tumors . Cancers (Basel) 2021. ; 13 ( 3 ): 424 . [DOI] [PMC free article] [PubMed] [Google Scholar]
- 40. Wijnenga MMJ , French PJ , Dubbink HJ , et al . The impact of surgery in molecularly defined low-grade glioma: an integrated clinical, radiological, and molecular analysis . Neuro-oncol 2018. ; 20 ( 1 ): 103 – 112 . [DOI] [PMC free article] [PubMed] [Google Scholar]


