

Key Points
Question
What is the extent of coexistence of atherosclerosis, small vessel disease (SVD), cardiac pathology, other causes, and dissection in patients with transient ischemic attack (TIA) or minor ischemic stroke and associated risks of major vascular events at 5 years?
Findings
In this cohort study of 3847 patients, 998 had probable or possible causal atherosclerotic disease, among whom 489 (49%) had SVD and 275 (28%) had cardiac findings. Compared with patients with none of these diseases, the 5-year rate of major vascular events was 5 times higher in patients with causal atherosclerosis, 2.5 times higher in patients with causal SVD, and 4 times higher in patients with causal cardiac pathology.
Meaning
These findings suggest that the coexistence of diseases underlying TIA or minor ischemic stroke is substantial and that the 5-year risk of major vascular events varies considerably across these diseases.
This cohort study assesses the extent of coexistence between underlying pathology in patients with transient ischemic attack and minor ischemic stroke, their 5-year risk of major vascular events, and factors associated with risk with the benefit of the more recently adopted ASCOD classification system.
Abstract
Importance
The coexistence of underlying causes in patients with transient ischemic attack (TIA) or minor ischemic stroke as well as their associated 5-year risks are not well known.
Objective
To apply the ASCOD (atherosclerosis, small vessel disease, cardiac pathology, other cause, or dissection) grading system to assess coexistence of underlying causes of TIA and minor ischemic stroke and the 5-year risk for major vascular events.
Design, Setting, and Participants
This international registry cohort (TIAregistry.org) study enrolled 4789 patients from June 1, 2009, to December 31, 2011, with 1- to 5-year follow-up at 61 sites in 21 countries. Eligible patients had a TIA or minor stroke (with modified Rankin Scale score of 0 or 1) within the last 7 days. Among these, 3847 patients completed the 5-year follow-up by December 31, 2016. Data were analyzed from October 1, 2022, to June 15, 2023.
Exposure
Five-year follow-up.
Main Outcomes and Measures
Estimated 5-year risk of the composite outcome of stroke, acute coronary syndrome, or cardiovascular death.
Results
A total of 3847 patients (mean [SD] age, 66.4 [13.2] years; 2295 men [59.7%]) in 42 sites were enrolled and participated in the 5-year follow-up cohort (median percentage of 5-year follow-up per center was 92.3% [IQR, 83.4%-97.8%]). In 998 patients with probable or possible causal atherosclerotic disease, 489 (49.0%) had some form of small vessel disease (SVD), including 110 (11.0%) in whom a lacunar stroke was also probably or possibly causal, and 504 (50.5%) had no SVD; 275 (27.6%) had some cardiac findings, including 225 (22.6%) in whom cardiac pathology was also probably or possibly causal, and 702 (70.3%) had no cardiac findings. Compared with patients with none of the 5 ASCOD categories of disease (n = 484), the 5-year rate of major vascular events was almost 5 times higher (hazard ratio [HR], 4.86 [95% CI, 3.07-7.72]; P < .001) in patients with causal atherosclerosis, 2.5 times higher (HR, 2.57 [95% CI, 1.58-4.20]; P < .001) in patients with causal lacunar stroke or lacunar syndrome, and 4 times higher (HR, 4.01 [95% CI, 2.50-6.44]; P < .001) in patients with causal cardiac pathology.
Conclusion and Relevance
The findings of this cohort study suggest that in patients with TIA and minor ischemic stroke, the coexistence of atherosclerosis, SVD, cardiac pathology, dissection, or other causes is substantial, and the 5-year risk of a major vascular event varies considerably across the 5 categories of underlying diseases. These findings further suggest the need for secondary prevention strategies based on pathophysiology rather than a one-size-fits-all approach.
Introduction
In patients with TIA or minor ischemic stroke, the distribution of the 5 main categories of underlying potentially causal diseases—including atherosclerosis, small vessel disease (SVD), cardiac pathology, dissection, and other rarer causes—and the extent of their coexistence is not well known. Further, the 5-year risk of major vascular events in these 5 categories and the factors associated with risk have not been explored.
The most used causative classifications of ischemic stroke, such as TOAST (Trial of Org 10172 in Acute Stroke Treatment) classification,1 place patients in categories that are mutually exclusive and have a very low interrater agreement.2,3 For example, patients with stroke deemed due to atherosclerotic disease who also have atrial fibrillation cannot be classified within the groups with atherosclerotic disease or cardiac causes and will be classified as the undetermined cause group, losing the information on atherosclerotic and cardiac causes for this particular patient. Patients with directly causal atherosclerotic disease who also have evidence of previous lacunar stroke will be classified as having causal atherosclerotic disease, neglecting the evidence of concomitant SVD and losing the information that this patient also has SVD. Patients with patent foramen ovale (PFO) and a carotid dissection will be classified as having dissection, losing the information about the presence of PFO, but the same patient without dissection and without another known cause of stroke will be classified as having a cardiac cause and treated by closing the PFO. In each example, loss of information about underlying pathological diseases limits our ability to understand the frequency of the coexistence of these diseases and, even more importantly, their prognostic implications in stroke.
The ASCOD (atherosclerosis, small vessel disease, cardiac pathology, other causes, and dissection) grading system4 was designed to overcome these problems and has a more granular approach. The patients are graded in all 5 categories: 1 if the disease is present and probably causal, 2 if the disease is present and possibly causal, 3 if the disease is present and not directly related with the stroke, 0 if the pathology is not present, and 9 if the workup is incomplete and does not allow grading of that category. In a given patient, these 5 categories may coexist. The extent of this coexistence has rarely been investigated.5
The TIAregistry.org was designed to describe the short- (3-month and 1-year)6 and long-term (5-year)7 outcomes in the modern era of treatment, particularly with the intensive early treatment in patients with TIA or minor ischemic stroke after the introduction of emergency services for TIA and minor stroke in developed health care systems. The study was conducted in Europe, Asia, and Latin America to increase generalizability. We enrolled 4769 patients in whom we applied the ASCOD grading system. We aimed to determine the distribution (number and proportion) of atherosclerotic disease in extracranial and intracranial arteries, SVD, cardiac pathology, other rare causes, or dissection.4
The 5-year risks associated with these subcategories may vary considerably from one to another. Few studies8,9,10,11,12 have reported on long-term outcomes of TIA and minor ischemic strokes according to their causes, and even then only using a less granular causative classification system. We sought to determine the extent of coexistence between underlying pathology in patients with TIA and minor ischemic stroke, their 5-year risk of a major vascular event, and factors associated with risks with the benefit of the more recently adopted ASCOD classification system.
Methods
Study Design and Oversight
We analyzed data from patients in the TIAregistry.org, an international, prospective, observational cohort of patients who had had a TIA or minor stroke within 7 days of enrollment between June 1, 2009, and December 31, 2011, and had been followed up for 5 years through December 31, 2016. It was conducted in 61 specialized centers. The study protocol was approved by local institutional review boards. The present analysis was performed from October 1, 2022, to June 15, 2023. The methods of patient recruitment and evaluation for the TIAregistry.org have been described.6,7 All patients provided written or oral informed consent according to country regulation. This study followed the Strengthening the Reporting of Observational Studies in Epidemiology (STROBE) reporting guideline.
Study Participants
Patients were eligible for enrollment if they were 18 years or older and had a TIA or minor stroke within the 7 days before evaluation by stroke specialists. Race and ethnicity data collection was not performed owing to requisite legal restrictions in France. Eligible patients had focal retinal or brain ischemia with resolution of symptoms or minor strokes with a modified Rankin Scale (mRS) score of 0 (no symptoms) or 1 (no disability; highest score of 6 indicates death) when first evaluated by stroke specialists. The mRS was preferred to the National Institutes of Health Stroke Scale as a pragmatic approach to rating minor focal neurological events that had no effect on disability. Detailed descriptions of the potential residual neurological deficits at admission were captured in the case report forms.
Sites were selected from 21 countries based on existence of a dedicated TIA patient care system (with care delivered by stroke specialists), with a yearly volume of at least 100 patients during the previous 3 years. Emergency departments, stroke units, day clinics, and outpatient clinics were the care settings; the systems varied across centers except that at all centers all patients were evaluated urgently by stroke specialists (most of whom were neurologists, the others of whom were stroke physicians).
Study Objectives and Evaluation
Stroke specialists prospectively collected patient data using a standardized web-based case report form during face-to-face interviews at the time of evaluation of the qualifying event (baseline), at 1, 3, and 12 months after baseline, and every 12 months thereafter for 5 years. If the patient could not be reached for follow-up, a relative or their family physician was interviewed by telephone. Patients were evaluated at baseline for clinical symptoms during the qualifying event, medical history, living and socioeconomic indicators, physical examination, investigations as recommended by stroke specialists (including brain and cerebral artery imaging and cardiac investigations), management (medical treatment and revascularization procedure), and the occurrence of clinical events after the qualifying event, as well as mRS. Patients were evaluated at follow-up for clinical events, medical treatment, and major risk factors (smoking status, blood pressure, and lipid profile values).
ASCOD Grading System
All elements necessary to grade patients following ASCOD criteria were captured in the e-case report form. We graded every patient for all 5 disease categories considered in the ASCOD system. For example, every patient had a grade for atherosclerotic disease: A1 if they had atherosclerosis with luminal stenosis of at least 50% ipsilateral to the cerebral ischemic area, either extracranial or intracranial, or an aortic arch (moving) thrombus; A2 if they had atherosclerosis with luminal stenosis of less than 50% ipsilateral to the cerebral ischemic area, either extracranial or intracranial, or an aortic arch plaque greater than 4 mm in thickness without thrombus; A3 if they had atherosclerotic plaque ipsilateral to the cerebral ischemic area, plaque or stenosis of any degree in a cerebral artery not supplying the cerebral ischemic area, an aortic arch plaque of less than 4 mm in thickness and without thrombus, or a known coronary or peripheral artery atherosclerosis; A0 if they had no documented atherosclerosis; and A9 if they had not been properly assessed for atherosclerosis.4
We repeated the grading system of 1, 2, 3, 0, and 9 for every patient for SVD (S), cardiac pathology (C), other cause (O), and dissection (D) (see the grading system in eMethods 1 and 2 in Supplement 1).4 In a given patient, as well as in the entire cohort, we could quantify the coexistence of the 5 disease categories.
Therefore, for the entire 3871 patients in the cohort, we had patients graded as A1 or A2, grades considered together due to the fact that atherosclerosis in these patients was probably or possibly causally related to the brain ischemia; patients graded as A3 in whom atherosclerosis was considered unlikely directly related to the brain ischemia; and patients graded as A0 with no evidence of atherosclerosis. We used the same numeric codes for SVD, cardiac pathology, other cause, and dissection.
Clinical Events and Outcome Definitions
Any clinical event after the qualifying event (ie, after the patient first sought medical attention), even if the event occurred before stroke specialist evaluation, was considered as an outcome event, as judged by the individual investigators. Primary outcomes and bleeding were reviewed by 2 of the investigators (P.C.L. and P.A.) based on narratives. The primary study outcome was defined as a composite outcome including cardiovascular death, nonfatal stroke (either ischemic or hemorrhagic), and nonfatal acute coronary syndrome.6,7 Secondary outcomes included individual components of the primary outcome and all-cause death.6,7
Statistical Analysis
Quantitative variables were calculated as mean (SD) in case of normal distribution or median (IQR) otherwise. Qualitative variables were calculated as frequency and percentage. Baseline characteristics were assessed for each category of underlying disease according to the ASCOD grading system (A0, A1 and A2, A3, and A9; S0, S1 and S2, S3, and S9; C0, C1 and C2, C3, and C9; and O0 or D0, O1 or D1 and O2 or D2, O3 or D3, and O9 or D9).
Five-year rates of major cardiovascular event, stroke recurrence, and death were estimated in every ASCOD category and compared among the 3 main categories by using the Kaplan-Meier method and log-rank test for mortality or by using the Kalbfleisch and Prentice method13 and Gray test by taking nonvascular death as a competing event for major cardiovascular event and stroke recurrence. Patients lost to follow-up at 5 years were treated as censored cases based on the last follow-up available and events that occurred after the 5-year follow-up period were not included in this analysis.
We calculated subhazard ratios (SHRs) for 5-year major cardiovascular event and 5-year stroke recurrence, and hazard ratios (HRs) for 5-year death as effect sizes by using patients with none of the 5 underlying categories of disease as reference (corresponding to ASCOD A0, S0, C0, O0, and D0). Subhazard ratios were estimated using Fine and Gray regression models with nonvascular death as a competing event and HRs estimated using the Cox proportional hazards regression model.
Last, we assessed factors associated with ASCOD categories using multivariable logistic regression models. Assessment of multivariable models included all significant factors with nominal P < .10 in univariable analysis and by using a backward-stepwise selection with procedure removal criteria of 0.10. Before developing the model, we examined the log-linearity assumption for continuous variables.
To avoid case deletion in multivariable analyses due to missing data in candidate factors, multivariable analyses were performed after handling missing values by multiple imputations using a regression-switching approach (chained equations with mean of 10 participants). The imputation procedure was performed under the missing-at-random assumption using all baseline characteristics with a predictive mean matching method for continuous variables and logistic regression model for categorical variables. Estimates obtained in the different imputed data sets were combined using Rubin’s rules.
Statistical testing was conducted at 2-tailed α = .05. Data were analyzed using the SAS software, version 9.4 (SAS Institute Inc).
Results
Between June 1, 2009, and December 31, 2011, 61 sites in 21 countries enrolled 4789 patients in the TIAregistry.org, and 42 sites enrolled 3847 patients who participated in the 5-year follow-up with more than 50% 5-year visits as shown on the study flowchart (mean [SD] age, 66.4 [13.2] years; 2295 men [59.7%] and 1552 women [40.3%]) (eFigure 1 in Supplement 1). The median percentage of 5-year follow-up per center was 92.3% (IQR, 83.4%-97.8%) with 3383 patients (87.9%) having a 5-year visit. Follow-up was completed on December 31, 2016.
The study flowchart (eFigure 1 in Supplement 1) shows that among 3847 patients, 1406 (36.5%) had no atherosclerosis (ASCOD A0), 1108 (28.8%) had any form of atherosclerosis in any vascular beds but no stenosis ipsilateral to the ischemic area and unlikely causal (ASCOD A3), 998 (25.9%) had stenosis ipsilateral to the ischemic area and possibly or probably causal (ASCOD A1 or A2), and 335 (8.7%) had no assessment of atherosclerosis (ASCOD A9). A total of 2141 patients (55.7%) had no form of SVD (ASCOD S0), 912 (23.7%) had evidence of SVD unlikely causal (ASCOD S3), 773 (20.1%) had a lacunar stroke or a lacunar syndrome possibly or probably causal (ASCOD S1 or S2), and 21 (0.5%) were not assessed for SVD (ASCOD S9). There were 2733 patients (71.0%) with no underlying cardiac pathology (ASCOD C0), 226 (5.9%) with cardiac pathology unlikely causal (ASCOD C3), 800 (20.8%) had cardiac pathology possibly or probably causal (ASCOD C1 or C2), and 88 (2.3%) were not assessed for cardiac pathology (ASCOD C9). No other cause and no dissection were found in 3392 patients (88.2%) (ASCOD O0 and D0), and 206 (5.4%) had a rare cause or dissection (ASCOD O1 and D1 or O2 and D2) (eFigure 1 in Supplement 1). eTables 3, 10, and 19 in Supplement 1 show baseline characteristics of underlying causes according to ASCOD grades. Table 1 shows baseline characteristics of the 3 main categories (possibly or likely causal atherosclerosis, SVD, and cardiac pathology) compared with patients with none of the 5 underlying disease categories.
Table 1. Baseline Patient Characteristicsa.
| Characteristic | ASCOD grade | |||
|---|---|---|---|---|
| A0, S0, C0, O0, and D0 (n = 484) | A1-A2 (n = 998) | S1-S2 (n = 773) | C1-C2 (n = 800) | |
| Age, mean (SD), y | 58.4 (14.7) | 69.8 (12.0) | 67.0 (11.5) | 70.2 (12.4) |
| Sex | ||||
| Men | 250/482 (51.9) | 658/997 (66.0) | 464/772 (60.1) | 477/800 (59.6) |
| Women | 232/482 (48.1) | 339/997 (34.0) | 308/772 (39.8) | 323/800 (40.4) |
| Geographic region | ||||
| Asia | 80/484 (16.5) | 288/998 (28.9) | 272/773 (35.2) | 146/800 (18.3) |
| Region other than Asia | 404/484 (83.5) | 710/998 (71.1) | 501/773 (64.8) | 654/800 (81.8) |
| Qualifying event | ||||
| Stroke | 106/432 (24.5) | 481/988 (48.7) | 438/764 (57.3) | 388/787 (49.3) |
| TIA | 326/432 (75.5) | 507/988 (51.3) | 326/764 (42.7) | 399/787 (50.7) |
| Medical history | ||||
| Hypertension | 240/481 (49.9) | 803/997 (80.5) | 563/773 (72.8) | 638/798 (80.0) |
| Diabetes | 59/480 (12.3) | 241/996 (24.2) | 189/771 (24.5) | 142/797 (17.8) |
| Dyslipidemia | 287/448 (64.1) | 806/998 (80.8) | 590/773 (76.3) | 551/800 (68.9) |
| Smoker | ||||
| Never | 273/475 (57.5) | 464/988 (47.0) | 425/756 (56.2) | 459/791 (58.0) |
| Former | 93/475 (19.6) | 284/988 (28.7) | 148/756 (19.6) | 213/791 (26.9) |
| Current | 109/475 (22.9) | 240/988 (24.3) | 183/756 (24.2) | 119/791 (15.0) |
| Regular alcohol consumption | 75/477 (15.7) | 248/984 (25.2) | 141/761 (18.5) | 169/789 (21.4) |
| Regular physical activity | 148/467 (31.7) | 180/974 (18.5) | 119/749 (15.9) | 148/780 (19.0) |
| Stroke or TIA | 46/484 (9.5) | 204/998 (20.4) | 123/773 (15.9) | 148/800 (18.6) |
| Coronary artery disease | NA | 184/995 (18.5) | 73/772 (9.5) | 185/796 (23.2) |
| Peripheral artery disease | NA | 56/996 (5.6) | 22/770 (2.9) | 35/795 (4.4) |
| Atrial fibrillation or flutter | 4/482 (0.8) | 96/995 (9.6) | 15/772 (1.9) | 281/794 (35.4) |
| Congestive heart failure | NA | 33/995 (3.3) | 13/772 (1.7) | 65/795 (8.2) |
| Clinically significant valvular disease or prosthetic heart valve | 3/484 (0.6) | 28/998 (2.8) | 13/773 (1.7) | 67/800 (8.4) |
| Atherogenic dyslipidemiab | 28/349 (8.0) | 90/868 (10.4) | 60/637 (9.4) | 42/653 (6.4) |
| Atherogenic dyslipidemiac | 67/349 (19.2) | 204/998 (20.4) | 144/538 (22.6) | 119/653 (18.2) |
| Diabetes and atherogenic dyslipidemiac | 15/482 (3.1) | 75/998 (7.5) | 51/772 (6.6) | 40/800 (5.0) |
| Body mass index, mean (SD)d | 26.4 (4.7) | 25.9 (4.4) | 26.3 (4.8) | 26.4 (4.6) |
| Blood pressure, mean (SD), mm Hg | ||||
| Systolic | 140 (22) | 149 (23) | 152 (25) | 144 (25) |
| Diastolic | 81 (12) | 80 (13) | 84 (13) | 79 (15) |
| Glucose level, median (IQR), mg/dL | 99 (90-121) | 104 (90-135) | 105 (91-130) | 104 (90-126) |
| Cholesterol levels, mean (SD), mg/dL | ||||
| LDL | 125 (42) | 118 (45) | 124 (41) | 112 (38) |
| HDL | 53 (19) | 49 (16) | 51 (16) | 50 (15) |
| Triglyceride level, median (IQR), mg/dL | 115.0 (82.0-161.0) | 119.0 (88.0-163.0) | 119.0 (88.0-179.0) | 110.0 (83.0-156.0) |
| Socioeconomic factors | ||||
| Living alone | 145/468 (31.0) | 337/990 (34.0) | 271/751 (36.1) | 248/791 (31.4) |
| Living in rural area | 51/465 (11.0) | 96/991 (9.7) | 102/766 (13.3) | 97/792 (12.2) |
| Unemployed | 35/459 (7.6) | 56/975 (5.7) | 36/742 (4.9) | 38/777 (4.9) |
| Educational level | ||||
| No education | 14/434 (3.2) | 42/959 (4.4) | 39/699 (5.6) | 44/748 (5.9) |
| Primary education | 113/434 (26.0) | 284/959 (29.6) | 232/699 (33.2) | 245/748 (32.8) |
| Secondary education | 206/434 (47.5) | 464/959 (48.4) | 333/699 (47.6) | 337/748 (45.1) |
| Tertiary education | 101/424 (23.8) | 169/959 (17.6) | 95/699 (13.6) | 122/748 (16.3) |
| ABCD2 scoree | ||||
| 0-3 | 208/418 (49.8) | 233/911 (25.6) | 145/708 (20.5) | 183/704 (26.0) |
| 4-5 | 164/418 (39.2) | 461/911 (50.6) | 358/708 (50.6) | 381/704 (54.1) |
| 6-7 | 46/418 (11.0) | 217/911 (23.8) | 205/708 (28.9) | 140/704 (19.9) |
| Acute infarction | ||||
| No | 322/432 (74.5) | 447/988 (45.2) | 299/764 (39.1) | 371/787 (47.1) |
| Single | 81/432 (18.8) | 295/988 (29.9) | 366/764 (47.9) | 245/787 (31.1) |
| Multiple | 29/432 (6.7) | 246/988 (24.9) | 99/764 (13.0) | 171/787 (21.7) |
| Score at discharge | ||||
| NIHSSf | ||||
| 0 | 359/400 (89.8) | 736/940 (78.3) | 483/728 (66.4) | 599/739 (81.1) |
| 1-4 | 40/400 (10.0) | 192/940 (20.4) | 245/728 (33.6) | 134/739 (18.1) |
| >5 | 1/400 (0.2) | 12/940 (1.3) | 0 | 6/739 (0.8) |
| mRS score >1g | 5/407 (1.2) | 30/928 (3.2) | 9/743 (1.2) | 25/763 (3.3) |
Abbreviations: A0, no atherosclerosis; A1-A2, probably or possibly causal atherosclerosis; ABCD2, age, blood pressure, clinical features, duration of TIA, and presence of diabetes; ASCOD, atherosclerosis, small vessel disease, cardiac pathology, other cause, or dissection; C0, no cardiac pathology; C1-C2, probably or possibly causal cardiac pathology; D0, no dissection; HDL, high-density lipoprotein; LDL, low-density lipoprotein; mRS, modified Rankin Scale; NA, not applicable; NIHSS, National Institutes of Health Stroke Scale; O0, no other cause; S0, no small vessel disease; S1-S2, probably or possibly causal small vessel disease; TIA, transient ischemic attack.
SI conversion factors: To convert cholesterol to mmol/L, multiply by 0.0259; glucose to mmol/L, multiply by 0.0555; triglyceride to mmol/L, multiply by 0.0113.
Includes only patients with probably or possibly causal atherosclerosis (A1/A2), small vessel disease (S1/S2), and cardiac pathology (C1/C2) according to the ASCOD grading system, compared with none of these and no other cause and no dissection (A0, S0, C0, O0, and D0). Unless otherwise indicated, data are expressed as No./total No. (%) of patients. Data were missing for some variables.
Defined as triglyceride levels greater than 200 mg/dL and HDL level no greater than 40 mg/dL for men or no greater than 50 mg/dL for women.
Defined as triglyceride levels greater than 150 mg/dL and HDL levels no greater than 50 mg/dL.
Calculated as weight in kilograms divided by height in meters squared.
Higher scores indicate greater risk.
Higher scores indicate greater stroke severity.
Scores range from 0 (no symptoms) to 6 (death).
Coexistence of Underlying Diseases
Figure 1 shows the coexistence of the 5 categories of underlying pathology, whether absent, unlikely related, or possibly or probably associated with the cerebral ischemia. eFigure 2 in Supplement 1 shows numerically the plurality of underlying pathology and thereby the complexity of stroke subtyping.
Figure 1. Coexistence of ASCOD (Atherosclerosis, Small Vessel Disease, Cardiac Pathology, Other Cause, or Dissection) Grades Among Patients With Transient Ischemic Attack (TIA) or Minor Ischemic Stroke.
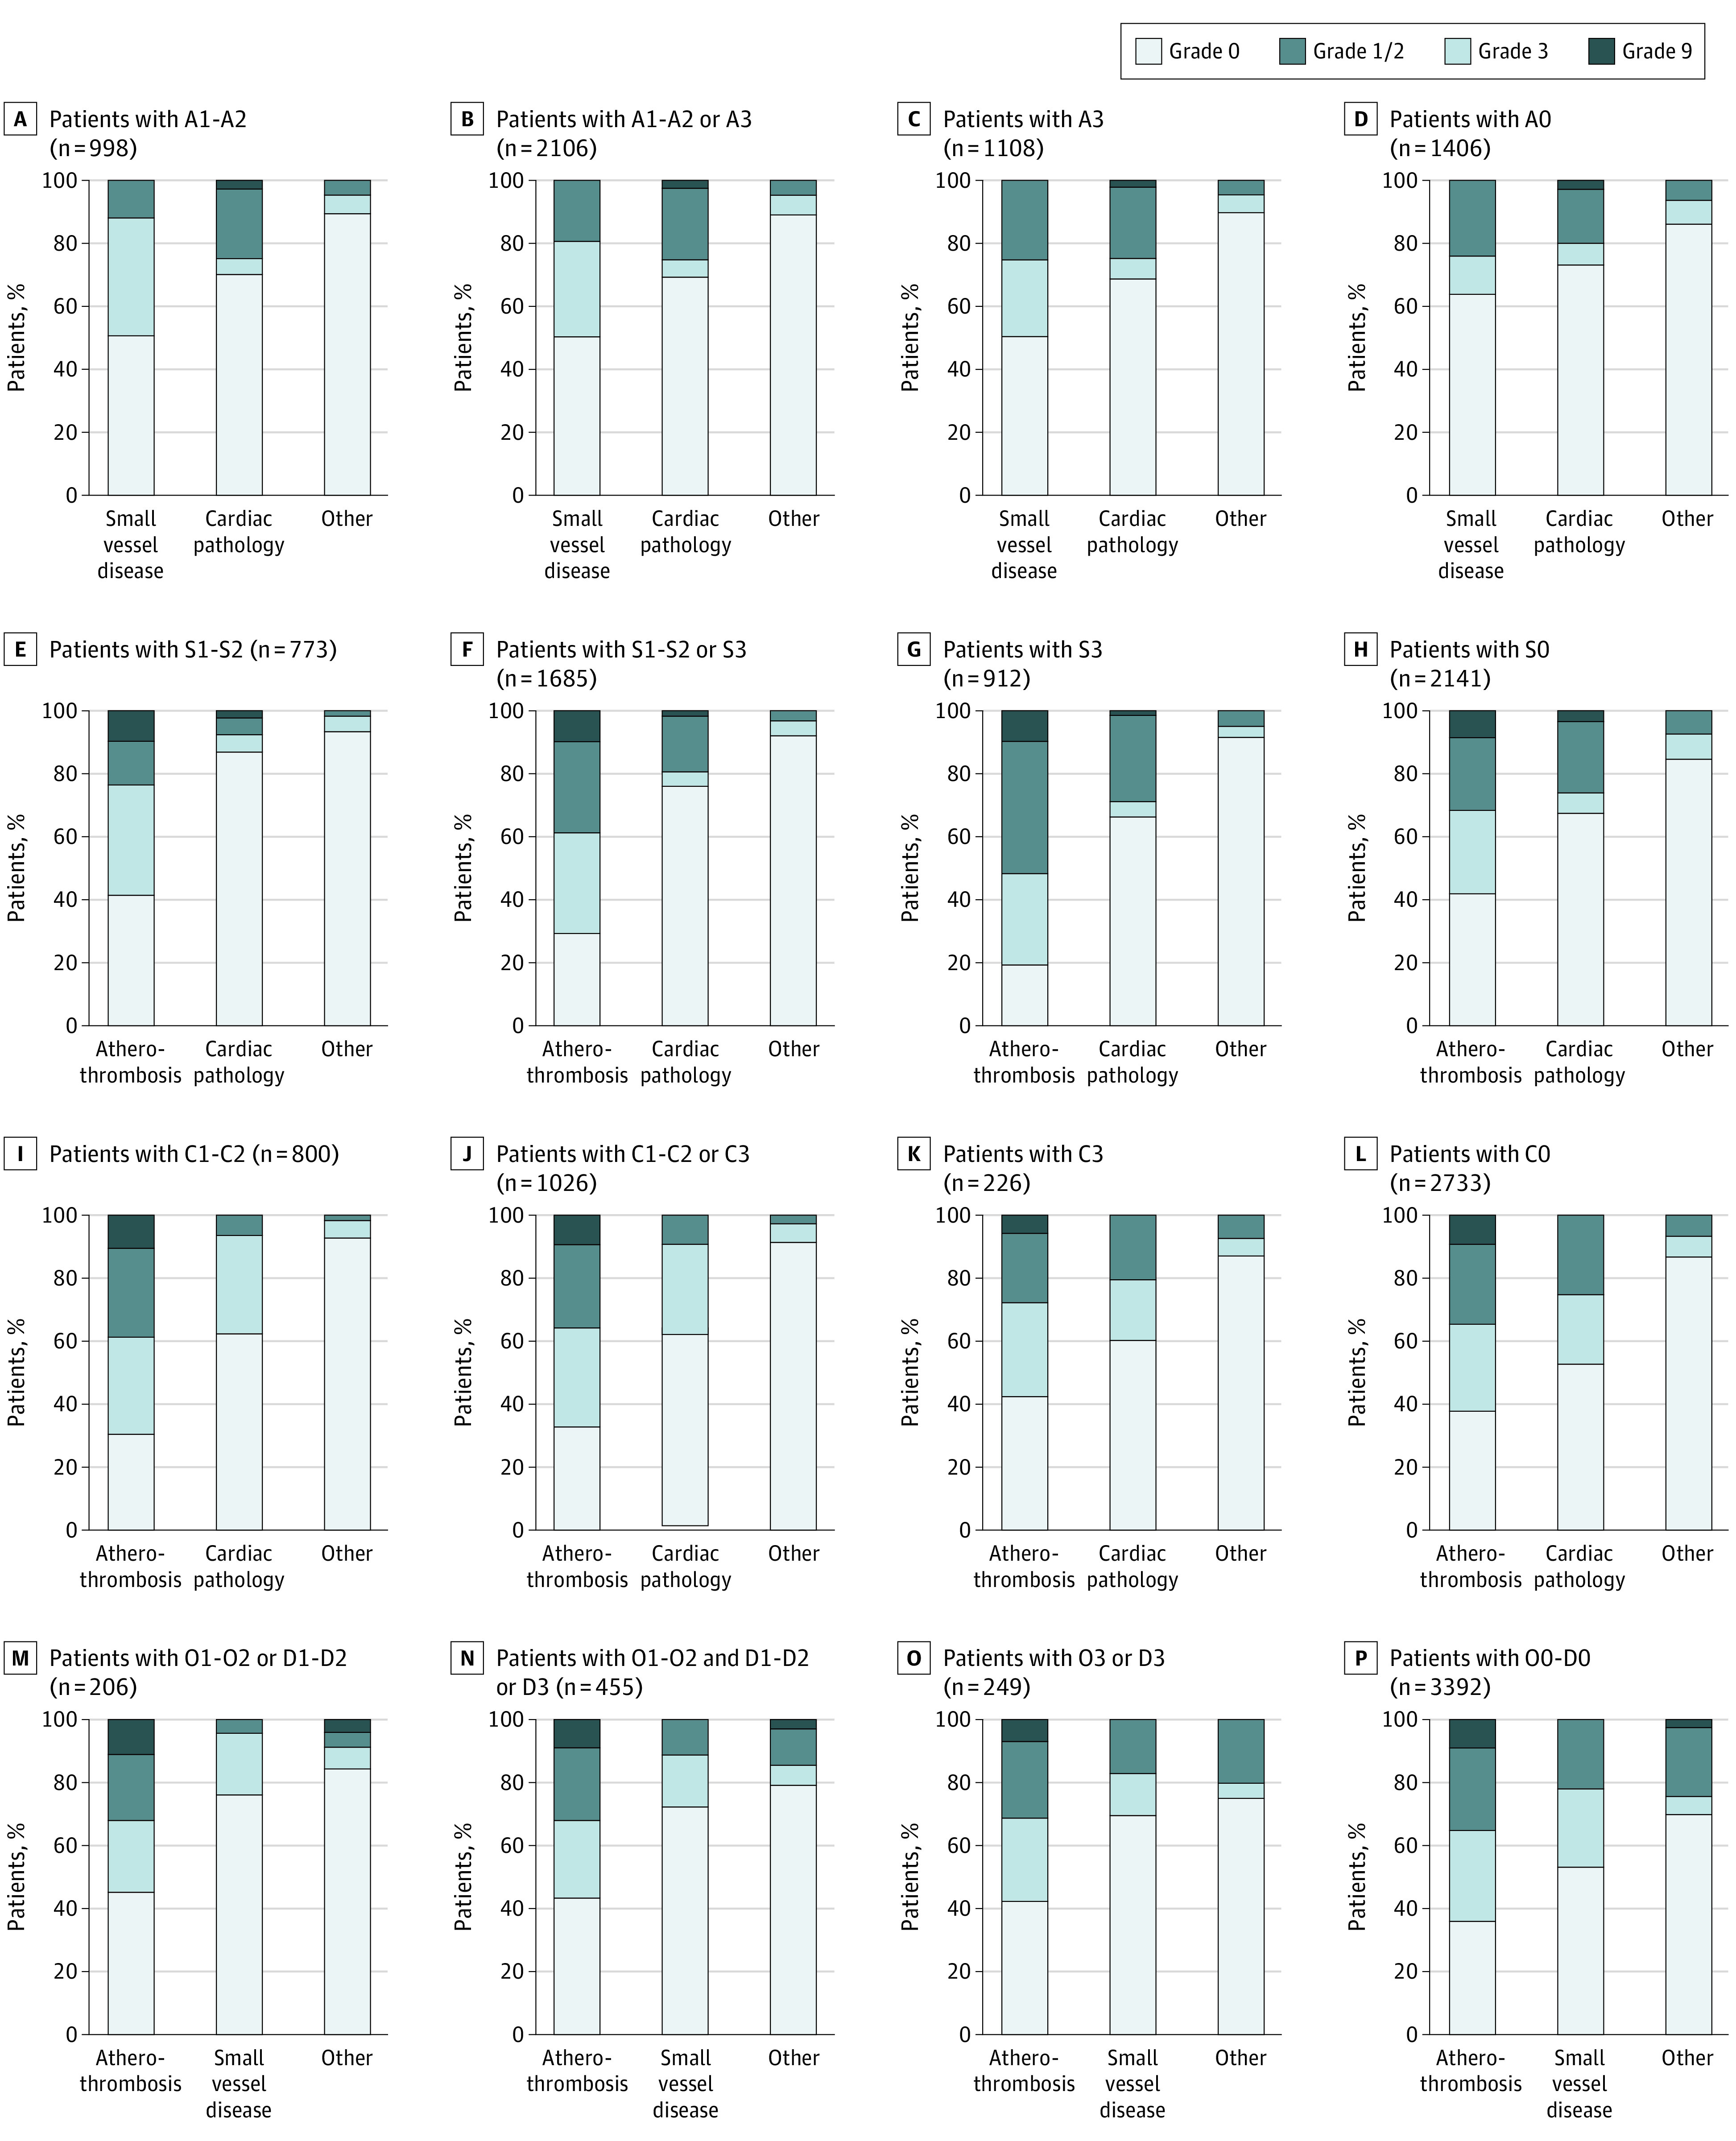
For atherosclerosis, A0 indicates none; A1-A2, atherosclerotic stenosis ipsilateral to the cerebral ischemia, intracranial and/or extracranial, probably or possibly causal; and A3, unlikely causal. For small vessel disease, S0 indicates none; S1-S2, lacunar stroke or lacunar syndrome probably or possibly causal; and S3, unlikely causal. For cardiac pathology, C0 indicates none; C1-C2, probably or possibly causal; and C3, unlikely causal. For other cause or dissection, O0 or D0 indicates none; O1-O2 or D1-D2, probably or possibly causal; and O3 or D3, unlikely causal.
Among patients with probably or possibly causal atherosclerotic disease, 489 (49.0%) had some form of SVD (S1, S2, or S3), including 110 (11.0%) in whom a lacunar stroke was also probably or possibly causal (S1 or S2), and 504 (50.5%) had no SVD (S0). In addition, 275 (27.6%) had some cardiac findings (C1, C2, or C3), including 225 (22.6%) in whom a cardiac pathology was also probably or possibly causal, and 702 (70.3%) had no cardiac findings. Patients with no atherosclerosis had SVD in 504 cases (35.8%), including 323 (23.0%) causal, and some cardiac pathology in 340 (24.2%), including 244 (17.4%) causal. Among 773 patients with a lacunar stroke possibly or probably causal, 380 (49.2%) had some form of atherosclerosis, including 110 (14.2%) in whom atherosclerosis was also probably or possibly causal, and 323 (41.8%) had no atherosclerotic disease; 42 (5.4%) had also a possibly or probably causal cardiac pathology, and 673 (87.1%) had no cardiac findings.
Five-Year Risk of ASCOD Categories
Table 2 and eFigures 3 through 9 in Supplement 1 show the 5-year event rate as well as 5-year evolution of LDL and blood pressure for each category of disease, and Figure 2 shows the 5-year risk in every category considered possibly or probably causal compared with patients with none of the 5 categories of underlying pathology (n = 484). The 5-year risk observed in patients with lacunar stroke was 11.1% (95% CI, 8.9%-13.6%), and the risk was 13.6% (95% CI, 9.2%-19.0%) in patients with rare causes, 16.6% (95% CI, 14.1%-19.4%) in patients with possibly or probably causal cardiac pathology, and 19.8% in patients with atherosclerotic disease ipsilateral to the cerebral ischemic area. Patients with none of the 5 categories of underlying disease (484 [12.6%]) had a 5-year risk as low as 4.4% (95% CI, 2.8%-6.5%) for a major cardiovascular event and a risk of 2.6% (95% CI, 1.2%-4.0%) for recurrent stroke.
Table 2. Five-Year Event Rates According to ASCOD Grading System.
| ASCOD category | ACSOD grade, No. of events (event rate, %) [95% CI]a | P value | ||||
|---|---|---|---|---|---|---|
| Comparison groupb | 0 | 1-2 | 3 | Grades 1-2 vs 0 | Grades 3 vs 0 | |
| Atherosclerotic disease | ||||||
| Major cardiovascular event | 20 (4.4) [2.8-6.5] (n = 484) | 101 (7.7) [6.3-9.2] (n = 1406) | 189 (19.8) [17.4-22.4] (n = 998) | 144 (13.8) [11.8-16.0] (n = 1108) | <.001c | <.001c |
| Recurrent stroke | 12 (2.6) (n = 484) | 75 (5.6) (n = 1406) | 141 (14.7) (n = 998) | 108 (10.3) (n = 1108) | <.001c | <.001c |
| Death | 20 (4.5) (n = 484) | 87 (6.8) (n = 1406) | 139 (15.0) (n = 998) | 106 (10.5) (n = 1108) | <.001d | .002d |
| Small vessel disease | ||||||
| Major cardiovascular event | 20 (4.4) [2.8-6.5] (n = 484) | 232 (11.4) [10.1-12.8] (n = 2141) | 80 (11.1) [8.9-13.6] (n = 773) | 154 (18.0) [15.5-20.7] (n = 912) | .72c | .72c |
| Recurrent stroke | 12 (2.6) (n = 484) | 172 (8.4) (n = 2141) | 65 (9.0) (n = 773) | 106 (12.3) (n = 912) | .74c | .002c |
| Death | 20 (4.5) (n = 484) | 164 (8.4) (n = 2141) | 62 (8.9) (n = 773) | 147 (17.6) (n = 912) | .72d | <.001d |
| Cardiac pathology | ||||||
| Major cardiovascular event | 20 (4.4) [2.8-6.5] (n = 484) | 315 (12.3) [11.0-13.6] (n = 2733) | 125 (16.6) [14.1-19.4] (n = 800) | 18 (8.3) [5.1-12.5] (n = 226) | .001c | .001c |
| Recurrent stroke | 12 (2.6) (n = 484) | 232 (9.0) (n = 2733) | 87 (11.5) (n = 800) | 18 (8.3) (n = 226) | .03c | .79c |
| Death | 20 (4.5) (n = 484) | 231 (9.2) (n = 2733) | 124 (17.2) (n = 800) | 7 (3.4) (n = 226) | <.001d | .002d |
| Other cause or dissection | ||||||
| Major cardiovascular event | 20 (4.4) [2.8-6.5] (n = 484) | 411 (12.9) [11.7-14.1] (n = 3392) | 26 (13.6) [9.2-19.0] (n = 206) | 32 (13.4) [9.5-18.1] (n = 249) | .75c | .75c |
| Recurrent stroke | 12 (2.6) (n = 484) | 300 (9.3) (n = 3392) | 22 (11.5) (n = 206) | 23 (9.6) (n = 249) | .34c | .87c |
| Death | 20 (4.5) (n = 484) | 343 (11.1) (n = 3392) | 10 (5.4) (n = 206) | 20 (8.5) (n = 249) | .02d | .25d |
Abbreviation: ASCOD, atherosclerosis, small vessel disease, cardiac pathology, other cause, or dissection.
Event rate is expressed as percentage calculated from Kaplan-Meier or Kalbfleisch and Prentice estimates for time-to-event outcomes. For all categories, grade 0 indicates not present. For atherosclerotic disease, grades 1 and 2 indicate atherosclerotic stenosis ipsilateral to the cerebral ischemic field; grades 1 through 3, atherosclerotic disease probably, possibly, or unlikely causal. For small vessel disease, cardiac disease, other cause, and dissection, grades 1 and 2 indicate probably or possibly causal; grades 1 through 3, probably, possibly and unlikely causal.
Includes grade 0 for all categories (n = 484).
Calculated using the Gray test.
Calculated using the log-rank test.
Figure 2. Five-Year Cumulative Incidence of a Major Cardiovascular Event.

We used the ASCOD (Atherosclerosis, Small Vessel Disease, Cardiac Pathology, Other Cause, or Dissection) grading system. For atherosclerosis, A0 indicates none and A1-A2, atherosclerotic stenosis ipsilateral to the cerebral ischemia, intracranial and/or extracranial, probably or possibly causal. For small vessel disease, S0 indicates none and S1-S2, lacunar stroke or lacunar syndrome probably or possibly causal. For cardiac pathology, C0 indicates none and C1-C2, probably or possibly causal. For other cause or dissection, O0 or D0 indicates none and O1-O2 or D1-D2, probably or possibly causal.
Compared with patients with none of the 5 categories of disease (ASCOD A0, S0, C0, O0, and D0 [n = 484]), Table 3 shows the effect size within all 5 categories, whether the disease is present (regardless of causality, eg, A1, A2, or A3) or is present and possibly or probably causal (eg, A1 or A2). The effect size for 5-year major vascular events was almost 5.0 times higher in patients with causal atherosclerosis (HR, 4.86 [95% CI, 3.07-7.72]), 2.5 times higher in patients with causal lacunar stroke or lacunar syndrome (HR, 2.57 [95% CI, 1.58-4.20]), and 4.0 times higher in patients with causal cardiac pathology (HR, 4.01 [95% CI, 2.50-6.44]). It was 6.0 times higher for the 5-year stroke outcome in patients with causal atherosclerosis (HR, 5.95 [95% CI, 3.29-10.73]), 3.5 times higher in patients with causal lacunar stroke (HR, 3.48 [95% CI, 1.88-6.45]), and 4.5 times higher in patients with causal cardiac pathology (HR, 4.57 [95% CI, 2.49-8.36]). The latter had the worse death prognosis, which was 4.0 times higher than in patients with none of the 5 categories of disease (HR, 3.99 [95% CI, 2.49-6.40]), while it was 3.5 times higher in patients with atherosclerosis (HR, 3.43 [95% CI, 2.15-5.48]) and 2.0 times higher in patients with a lacunar stroke deemed causal (HR, 1.96 [95% CI, 1.19-3.25]).
Table 3. Effect Size Associated With ASCOD Grades .
| ASCOD category | ASCOD gradea | ||||
|---|---|---|---|---|---|
| 0b | 1 and 2 | 1, 2, and 3 | |||
| SHR or HR (95% CI)c | P value | SHR or HR (95% CI)c | P value | ||
| Atherosclerotic disease | |||||
| Major cardiovascular event | 1 [Reference] | 4.86 (3.07-7.72) | <.001 | 4.03 (2.57-6.34) | <.001 |
| Recurrent stroke | 1 [Reference] | 5.95 (3.29-10.73) | <.001 | 4.96 (2.77-8.86) | <.001 |
| Death | 1 [Reference] | 3.43 (2.15-5.48) | <.001 | 2.87 (1.82-4.53) | <.001 |
| Small vessel disease | |||||
| Major cardiovascular event | 1 [Reference] | 2.57 (1.58-4.20) | <.001 | 3.51 (2.22-5.55) | <.001 |
| Recurrent stroke | 1 [Reference] | 3.48 (1.88-6.45) | <.001 | 4.23 (2.35-7.61) | <.001 |
| Death | 1 [Reference] | 1.96 (1.19-3.25) | .009 | 3.11 (1.96-4.91) | <.001 |
| Cardiac pathology | |||||
| Major cardiovascular event | 1 [Reference] | 4.01 (2.50-6.44) | <.001 | 3.54 (2.22-5.65) | <.001 |
| Recurrent stroke | 1 [Reference] | 4.57 (2.49-8.36) | <.001 | 4.28 (2.35-7.78) | <.001 |
| Death | 1 [Reference] | 3.99 (2.49-6.40) | <.001 | 3.22 (2.01-5.15) | <.001 |
| Other cause or dissection | |||||
| Major cardiovascular event | 1 [Reference] | 3.21 (1.79-5.75) | <.001 | 3.20 (1.93-5.32) | <.001 |
| Recurrent stroke | 1 [Reference] | 4.50 (2.22-9.11) | <.001 | 4.11 (2.17-7.77) | <.001 |
| Death | 1 [Reference] | 1.19 (0.56-2.54) | .65 | 1.59 (0.91-2.81) | .11 |
Abbreviations: ASCOD, atherosclerosis, small vessel disease, cardiac pathology, other cause, or dissection; HR, hazard ratio; SHR, subhazard ratio.
For all categories, grade 0 indicates not present. For atherosclerotic disease, grades 1 and 2 indicate atherosclerotic stenosis ipsilateral to the cerebral ischemic field; grades 1 through 3, atherosclerotic disease probably, possibly, or unlikely causal. For small vessel disease, cardiac disease, other cause, and dissection, grades 1 and 2 indicate probably or possibly causal; grades 1 through 3, probably, possibly and unlikely causal.
Includes grade 0 for all categories (n = 484).
Subhazard ratios are used for major cardiovascular event and stroke recurrence; HRs, for death.
Univariable and multivariable associations as well as effect sizes and effect size comparison for the 5 categories are provided in eTables 1, 2, 4 to 9, 11 to 18, 20 to 27, and 29 to 31 in Supplement 1. The data show that the 5 underlying pathology categories have most major risk factors in common such as blood pressure, obesity, diabetes, high cholesterol level, and physical inactivity. eTable 28 in Supplement 1 also shows the 5-year event rates and effect sizes in ASCOD cross-grades.
Discussion
While patients with no detected underlying pathology for their presenting TIA or minor stroke (no atherosclerosis, no small vessel disease, no cardiac pathology, and no dissection or other cause) had a 5-year risk of major vascular events of 4.4% and of stroke outcome of 2.6%, these risks were 5.0 and 6.0 times higher, respectively, in patients with likely or possibly causal atherosclerosis, 2.5 and 3.5 times higher, respectively, in patients with causal lacunar stroke, and 4.0 and 4.5 times higher, respectively, in patients with causal cardiac pathology. This variability of clinical outcome is surprising in the era of intensive secondary prevention management in sophisticated stroke centers, such as stroke centers involved in the TIAregistry.org. The results can most likely be generalized to similar centers worldwide, but not to less well-resourced centers where outcomes are likely to be even less favorable.
Our results also show the importance of documenting the coexistence between the 5 ASCOD categories of underlying pathology and the likelihood of causality. This allows a more granular approach to the coexistence of causal diseases. For example, if we only consider patients with causal atherosclerosis, they could also have possible or probable causal lacunar stroke in 11.0% of cases and possible or probable causal cardiac pathology in 22.6% of cases. If we now consider the presence of atherosclerosis, regardless of causality, atherosclerosis was found in 49.2% of patients with a possible or probable causal lacunar stroke. Overall atherosclerosis was present in 54.7% of patients enrolled in the TIAregistry.org, absent in 36.5%, and inadequately assessed in 8.7%. These proportions differ from series where a comprehensive evaluation for the presence of atherosclerotic disease has been performed, such as in the AMISTAD (Asymptomatic Myocardial Ischemia in Stroke and Atherosclerotic Disease) study where atherosclerosis,5 regardless of causality, was found in 362 (89.8%) of 403 patients, and atherosclerotic disease possibly or likely causal was found in 233 (57.8%), including 172 (42.6%) likely and 61 (15.1%) possibly causal, with no patients inadequately assessed for atherosclerotic disease.
These results with a more granular documentation of the coexistence of disease should allow clinicians to target the disease with preventive strategies rather than the consequence of the disease (ischemic stroke). For example, a stroke trial testing a drug or a process of care that addresses mechanisms of atherosclerotic disease evolution and complications should target patients with documented atherosclerotic disease, regardless of causality, and eliminate the other patients who are not informative or at very low risk and may dilute the effect of the intervention under evaluation. Then, the clinical result of that study would affect 90% (according to AMISTAD study) of patients with ischemic stroke. To be more specific, targeting patients with possibly or probably causal atherosclerosis will further increase the power to detect an effect of the intervention.
On the other hand, eTables 23, 25, and 29 to 31 in Supplement 1 show that the 5 categories of underlying pathology have modifiable risk factors in common such as blood pressure, obesity, physical activity, and, for some, dyslipidemia. Hence, to evaluate, for example, the effect of blood pressure–lowering therapy, combining all strokes is useful, regardless of underlying pathology, contrary to the example above targeting a specific disease. However, Tables 2 and 3 show substantial differences in short- and long-term risks that are intrinsic to the complications of underlying pathology (eg, thrombotic process on a rupture plaque in atherosclerosis, thrombosis in cardiac pathology, and strong relation to high blood pressure for SVD). Hence, risk factor control is the mainstay of secondary stroke prevention, regardless of the underlying disease that caused the stroke, while addressing specific thrombotic processes, triggers (eg, inflammation), and causal factors (eg, lipoprotein a or low-density lipoprotein cholesterol levels) should preferably be assessed in patients with stroke selected on the presence of an underlying causal disease.
Strengths and Limitations
A strength of this analysis is the multicontinental nature of the registry with 61 sites across 21 countries. Another strength is the granularity of the ASCOD grading system and that it was captured in a structured case report form. Hence, all 3847 patients could be precisely categorized according to the presence, severity, and site of atherosclerosis, SVD, cardiac pathology, dissection, or other rarer causes. The comprehensive nature of the data capture process is reflected in the few patients with incomplete assessment. Only 8.7% of patients were not assessed for atherosclerosis, 0.5% were not assessed for SVD, and 2.3% were not assessed for cardiac pathology.
This study also has some limitations. First, the centers in the registry were in highly specialized TIA clinic and stroke units, with a recruitment bias toward those patients who sought medical attention, potentially limiting the generalizability of our findings. Although primary outcome and major bleeding events were adjudicated, this registry was exposed to potential underreporting of primary outcome events. For this reason, our primary outcome included the definitive clinical outcome measures of recurrent stroke, myocardial infarction, and vascular death, which were less likely to be missed. Second, given the multicenter nature of the international registry and the recruitment of patients undergoing standard care, the search for the presence of 5 categories of underlying diseases may not have been complete in many patients, accounting for a prevalence of atherosclerosis of 54.7%, although it was 90% in series with thorough, prospective, and more rigorous evaluation of atherosclerosis.5 Due to multiple comparison issues, the present results should be interpreted with caution, since we could not exclude false-positive findings.
Conclusions
The findings of this cohort study suggest that among patients with TIA or minor ischemic stroke, the coexistence of atherosclerosis, SVD, cardiac pathology, dissection, or other causes is substantial, and the 5-year risk of major vascular events and of stroke outcome vary considerably across the 5 categories of underlying diseases, with atherosclerosis having the highest risk, SVD having an intermediate risk, and no underlying identified causal disease having the lowest risk. These findings have important implications for the design of future clinical trials and implementation of secondary stroke prevention strategies.
eTable 1. Univariate Comparison Between Baseline Characteristics and ASCOD Grades A1-A2 vs A0, S0, C0, O0, or D0
eTable 2. Univariate Comparison Between Baseline Characteristics and ASCOD Grades A1-A2 and A3 vs A0, S0, C0, O0, or D0
eTable 3. Baseline Characteristics According to ASCOD Grading System S (Small Vessel Disease)
eTable 4. Univariate Comparison Between Baseline Characteristics and ASCOD Grades S1-S2 vs S0
eTable 5. Multivariable Association Between Baseline Characteristics and ASCOD Grades S1-S2 vs S0
eTable 6. Univariate Comparison Between Baseline Characteristics and ASCOD Grades S1-S2 and S3 vs S0
eTable 7. Multivariable Association Between Baseline Characteristics and ASCOD Grades S1-S2 and S3 vs S0
eTable 8. Univariate Comparison Between Baseline Characteristics and ASCOD Grades S1-S2 vs A0, S0, C0, O0, and D0
eTable 9. Univariate Comparison Between Baseline Characteristics and ASCOD Grades S1-S2 and S3 vs A0, S0, C0, O0, and D0
eTable 10. Baseline Characteristics According to ASCOD Grading System C (Cardiac Pathology)
eTable 11. Five-Year Event Rates According to ASCOD Classification C (Cardiac Pathology)
eTable 12. Effect Sizes Associated With ASCOD Classification C1-C2 and C3 Compared With C0
eTable 13. Univariate Comparison Between Baseline Characteristics and ASCOD Grades C1-C2 vs C0
eTable 14. Multivariable Association Between Baseline Characteristics and ASCOD Grades C1-C2 vs C0
eTable 15. Univariate Comparison Between Baseline Characteristics and ASCOD Grades C1-C2 and C3 vs C0
eTable 16. Multivariable Association Between Baseline Characteristics and ASCOD Grades C1-C2 and C3 vs C0
eTable 17. Univariate Comparison Between Baseline Characteristics and ASCOD Grades C1- C2 vs A0, S0, C0, O0, and D0
eTable 18. Univariate Comparison Between Baseline Characteristics and ASCOD Grades C1-C2 and C3 vs A0, S0, C0, O0, and D0
eTable 19. Baseline Characteristics According to ASCOD Grading System OD (Other Cause and Dissection)
eTable 20. Five-Year Event Rates According to ASCOD Grades (Other Causes and Dissection)
eTable 21. Effect Sizes Associated With ASCOD Grades O1-D1 or O2-D2 and O3-O3 Compared With O0-D0
eTable 22. Univariate Comparison Between Baseline Characteristics and ASCOD Grades O1-1 or O2-D2 vs O0-D0
eTable 23. Multivariable Association Between Baseline Characteristics and ASCOD Grades O1-D1 or O2-D2 vs ASCOD Grade O0-D0
eTable 24. Univariate Comparison Between Baseline Characteristics and ASCOD Grades O1-D1 or O2-D2 or O3-D3 vs O0-D0
eTable 25. Multivariable Association Between Baseline Characteristics and ASCOD Grades O1-D1 or O2-D2 or O3-D3 vs O0-D0
eTable 26. Univariate Comparison Between Baseline Characteristics and ASCOD Grades O1-D1 or O2-D2 vs A0, S0, C0, O0, and D0
eTable 27. Univariate Comparison Between Baseline Characteristics and ASCOD Grades O1-D1 or O2-D2 or O3-D3 vs A0, S0, C0, O0, or D0
eTable 28. Five-Year Event Rates and Effect Sizes According to ASCOD Cross-Grades
eTable 29. Multivariable Association Between Baseline Characteristics and ASCOD Grades A1-A2 and A1-A2 and A3 vs A0, S0, C0, O0, or D0
eTable 30. Multivariable Association Between Baseline Characteristics and ASCOD Grades S1-S2 and S1-S2 and S3 vs A0, S0, C0, O0, or D0
eTable 31. Multivariable Association Between Baseline Characteristics and ASCOD Grades C1-C2 and C1-C2 and C3 vs A0, S0, C0, O0, or D0
eFigure 1. Study Flowchart
eFigure 2. Venn Diagram Among Main ASCOD Diseases (Atherosclerosis, Small Vessel Disease, and Cardiac Pathology)
eFigure 3. Five-Year Cumulative Incidence of Recurrent Major Cardiovascular Event According to ASCOD Grades S0, S1-S2, and S3
eFigure 4. LDL and Blood Pressure Evolution: Small Vessel Disease
eFigure 5. Five-Year Cumulative Incidence of Recurrent Major Cardiovascular Event According to ASCOD Grades C0, C1-C2, and C3
eFigure 6. LDL and Blood Pressure Evolution: Cardiac Pathology
eFigure 7. Five-Year Cumulative Incidence of Recurrent Major Cardiovascular Event According to ASCOD Grades O0-D0, O1-D1, or O2-D2 and O3-D3
eFigure 8. LDL and Blood Pressure Evolution: Other Causes and Dissection
eFigure 9. Five-Year Cumulative Incidence of Recurrent Major Cardiovascular Event According to ASCOD Grades A1-A2 and A3, S1-S2 and S3, C1-C2 and C3, O1-O2 and O3, D1-D2 and D3, and A0, S0, C0, O0, or D0
eMethods 1. ASCOD Phenotyping: Method of Classification
eMethods 2. Grades of Predefined ASCOD Phenotypes
Nonauthor Collaborators
Data Sharing Statement
References
- 1.Adams HP Jr, Bendixen BH, Kappelle LJ, et al. Classification of subtype of acute ischemic stroke. Definitions for use in a multicenter clinical trial. TOAST. Trial of Org 10172 in Acute Stroke Treatment. Stroke. 1993;24(1):35-41. doi: 10.1161/01.STR.24.1.35 [DOI] [PubMed] [Google Scholar]
- 2.Goldstein LB, Jones MR, Matchar DB, et al. Improving the reliability of stroke subgroup classification using the Trial of ORG 10172 in Acute Stroke Treatment (TOAST) criteria. Stroke. 2001;32(5):1091-1098. doi: 10.1161/01.STR.32.5.1091 [DOI] [PubMed] [Google Scholar]
- 3.Landau WM, Nassief A. Editorial comment—time to burn the TOAST. Stroke. 2005;36(4):902-904. doi: 10.1161/str.36.4.902 [DOI] [PubMed] [Google Scholar]
- 4.Amarenco P, Bogousslavsky J, Caplan LR, Donnan GA, Wolf ME, Hennerici MG. The ASCOD phenotyping of ischemic stroke (updated ASCO phenotyping). Cerebrovasc Dis. 2013;36(1):1-5. doi: 10.1159/000352050 [DOI] [PubMed] [Google Scholar]
- 5.Sirimarco G, Lavallée PC, Labreuche J, et al. Overlap of diseases underlying ischemic stroke: the ASCOD phenotyping. Stroke. 2013;44(9):2427-2433. doi: 10.1161/STROKEAHA.113.001363 [DOI] [PubMed] [Google Scholar]
- 6.Amarenco P, Lavallée PC, Labreuche J, et al. ; TIAregistry.org Investigators . One-year risk of stroke after transient ischemic attack or minor ischemic stroke. N Engl J Med. 2016;374(16):1533-1542. doi: 10.1056/NEJMoa1412981 [DOI] [PubMed] [Google Scholar]
- 7.Amarenco P, Lavallée PC, Monteiro Tavares L, et al. ; TIAregistry.org Investigators . Five-year risk of stroke after TIA or minor ischemic stroke. N Engl J Med. 2018;378(23):2182-2190. doi: 10.1056/NEJMoa1802712 [DOI] [PubMed] [Google Scholar]
- 8.Clark TG, Murphy MF, Rothwell PM. Long term risks of stroke, myocardial infarction, and vascular death in “low risk” patients with a non-recent transient ischaemic attack. J Neurol Neurosurg Psychiatry. 2003;74(5):577-580. doi: 10.1136/jnnp.74.5.577 [DOI] [PMC free article] [PubMed] [Google Scholar]
- 9.Luengo-Fernandez R, Paul NL, Gray AM, et al. ; Oxford Vascular Study . Population-based study of disability and institutionalization after transient ischemic attack and stroke: 10-year results of the Oxford Vascular Study. Stroke. 2013;44(10):2854-2861. doi: 10.1161/STROKEAHA.113.001584 [DOI] [PMC free article] [PubMed] [Google Scholar]
- 10.Luengo-Fernandez R, Gray AM, Bull L, Welch S, Cuthbertson F, Rothwell PM; Oxford Vascular Study . Quality of life after TIA and stroke: ten-year results of the Oxford Vascular Study. Neurology. 2013;81(18):1588-1595. doi: 10.1212/WNL.0b013e3182a9f45f [DOI] [PMC free article] [PubMed] [Google Scholar]
- 11.Lovett JK, Coull AJ, Rothwell PM. Early risk of recurrence by subtype of ischemic stroke in population-based incidence studies. Neurology. 2004;62(4):569-573. doi: 10.1212/01.WNL.0000110311.09970.83 [DOI] [PubMed] [Google Scholar]
- 12.Purroy F, Montaner J, Molina CA, Delgado P, Ribo M, Alvarez-Sabín J. Patterns and predictors of early risk of recurrence after transient ischemic attack with respect to etiologic subtypes. Stroke. 2007;38(12):3225-3229. doi: 10.1161/STROKEAHA.107.488833 [DOI] [PubMed] [Google Scholar]
- 13.Prentice RL, Kalbfleisch JD, Peterson AV Jr, Flournoy N, Farewell VT, Breslow NE. The analysis of failure times in the presence of competing risks. Biometrics. 1978;34(4):541-554. doi: 10.2307/2530374 [DOI] [PubMed] [Google Scholar]
Associated Data
This section collects any data citations, data availability statements, or supplementary materials included in this article.
Supplementary Materials
eTable 1. Univariate Comparison Between Baseline Characteristics and ASCOD Grades A1-A2 vs A0, S0, C0, O0, or D0
eTable 2. Univariate Comparison Between Baseline Characteristics and ASCOD Grades A1-A2 and A3 vs A0, S0, C0, O0, or D0
eTable 3. Baseline Characteristics According to ASCOD Grading System S (Small Vessel Disease)
eTable 4. Univariate Comparison Between Baseline Characteristics and ASCOD Grades S1-S2 vs S0
eTable 5. Multivariable Association Between Baseline Characteristics and ASCOD Grades S1-S2 vs S0
eTable 6. Univariate Comparison Between Baseline Characteristics and ASCOD Grades S1-S2 and S3 vs S0
eTable 7. Multivariable Association Between Baseline Characteristics and ASCOD Grades S1-S2 and S3 vs S0
eTable 8. Univariate Comparison Between Baseline Characteristics and ASCOD Grades S1-S2 vs A0, S0, C0, O0, and D0
eTable 9. Univariate Comparison Between Baseline Characteristics and ASCOD Grades S1-S2 and S3 vs A0, S0, C0, O0, and D0
eTable 10. Baseline Characteristics According to ASCOD Grading System C (Cardiac Pathology)
eTable 11. Five-Year Event Rates According to ASCOD Classification C (Cardiac Pathology)
eTable 12. Effect Sizes Associated With ASCOD Classification C1-C2 and C3 Compared With C0
eTable 13. Univariate Comparison Between Baseline Characteristics and ASCOD Grades C1-C2 vs C0
eTable 14. Multivariable Association Between Baseline Characteristics and ASCOD Grades C1-C2 vs C0
eTable 15. Univariate Comparison Between Baseline Characteristics and ASCOD Grades C1-C2 and C3 vs C0
eTable 16. Multivariable Association Between Baseline Characteristics and ASCOD Grades C1-C2 and C3 vs C0
eTable 17. Univariate Comparison Between Baseline Characteristics and ASCOD Grades C1- C2 vs A0, S0, C0, O0, and D0
eTable 18. Univariate Comparison Between Baseline Characteristics and ASCOD Grades C1-C2 and C3 vs A0, S0, C0, O0, and D0
eTable 19. Baseline Characteristics According to ASCOD Grading System OD (Other Cause and Dissection)
eTable 20. Five-Year Event Rates According to ASCOD Grades (Other Causes and Dissection)
eTable 21. Effect Sizes Associated With ASCOD Grades O1-D1 or O2-D2 and O3-O3 Compared With O0-D0
eTable 22. Univariate Comparison Between Baseline Characteristics and ASCOD Grades O1-1 or O2-D2 vs O0-D0
eTable 23. Multivariable Association Between Baseline Characteristics and ASCOD Grades O1-D1 or O2-D2 vs ASCOD Grade O0-D0
eTable 24. Univariate Comparison Between Baseline Characteristics and ASCOD Grades O1-D1 or O2-D2 or O3-D3 vs O0-D0
eTable 25. Multivariable Association Between Baseline Characteristics and ASCOD Grades O1-D1 or O2-D2 or O3-D3 vs O0-D0
eTable 26. Univariate Comparison Between Baseline Characteristics and ASCOD Grades O1-D1 or O2-D2 vs A0, S0, C0, O0, and D0
eTable 27. Univariate Comparison Between Baseline Characteristics and ASCOD Grades O1-D1 or O2-D2 or O3-D3 vs A0, S0, C0, O0, or D0
eTable 28. Five-Year Event Rates and Effect Sizes According to ASCOD Cross-Grades
eTable 29. Multivariable Association Between Baseline Characteristics and ASCOD Grades A1-A2 and A1-A2 and A3 vs A0, S0, C0, O0, or D0
eTable 30. Multivariable Association Between Baseline Characteristics and ASCOD Grades S1-S2 and S1-S2 and S3 vs A0, S0, C0, O0, or D0
eTable 31. Multivariable Association Between Baseline Characteristics and ASCOD Grades C1-C2 and C1-C2 and C3 vs A0, S0, C0, O0, or D0
eFigure 1. Study Flowchart
eFigure 2. Venn Diagram Among Main ASCOD Diseases (Atherosclerosis, Small Vessel Disease, and Cardiac Pathology)
eFigure 3. Five-Year Cumulative Incidence of Recurrent Major Cardiovascular Event According to ASCOD Grades S0, S1-S2, and S3
eFigure 4. LDL and Blood Pressure Evolution: Small Vessel Disease
eFigure 5. Five-Year Cumulative Incidence of Recurrent Major Cardiovascular Event According to ASCOD Grades C0, C1-C2, and C3
eFigure 6. LDL and Blood Pressure Evolution: Cardiac Pathology
eFigure 7. Five-Year Cumulative Incidence of Recurrent Major Cardiovascular Event According to ASCOD Grades O0-D0, O1-D1, or O2-D2 and O3-D3
eFigure 8. LDL and Blood Pressure Evolution: Other Causes and Dissection
eFigure 9. Five-Year Cumulative Incidence of Recurrent Major Cardiovascular Event According to ASCOD Grades A1-A2 and A3, S1-S2 and S3, C1-C2 and C3, O1-O2 and O3, D1-D2 and D3, and A0, S0, C0, O0, or D0
eMethods 1. ASCOD Phenotyping: Method of Classification
eMethods 2. Grades of Predefined ASCOD Phenotypes
Nonauthor Collaborators
Data Sharing Statement