Abstract.
Significance
Photoacoustic imaging is an emerging imaging modality that combines the high contrast of optical imaging and the high penetration of acoustic imaging. However, the strong focusing of the laser beam in optical-resolution photoacoustic microscopy (OR-PAM) leads to a limited depth-of-field (DoF).
Aim
Here, a volumetric photoacoustic information fusion method was proposed to achieve large volumetric photoacoustic imaging at low cost.
Approach
First, the initial decision map was built through the focus detection based on the proposed three-dimensional Laplacian operator. Majority filter-based consistency verification and Gaussian filter-based map smoothing were then utilized to generate the final decision map for the construction of photoacoustic imaging with extended DoF.
Results
The performance of the proposed method was tested to show that our method can expand the limited DoF by a factor of 1.7 without the sacrifice of lateral resolution. Four sets of multi-focus vessel data at different noise levels were fused to verify the effectiveness and robustness of the proposed method.
Conclusions
The proposed method can efficiently extend the DoF of OR-PAM under different noise levels.
Keywords: photoacoustic microscopy, noise insensitive, volumetric fusion, spatial domain, extended depth-of-field
1. Introduction
Photoacoustic imaging, which combines the advantages of optical imaging and acoustic imaging to provide high-resolution and non-invasive imaging with deep penetration depth,1–6 has been widely applied in biomedicine, such as breast cancer diagnosis,7 thyroid imaging,8 and brain imaging.9 As an important branch of photoacoustic imaging, optical-resolution photoacoustic microscopy (OR-PAM) satisfies the criterion of high-resolution imaging in biomedical research.10 Raster scanning is utilized in OR-PAM to capture three-dimensional (3D) information. However, the reliance on a focused laser beam for high-resolution imaging introduces challenges, such as reduced lateral resolution outside the focal regions and a limited depth-of-field (DoF). The restricted DoF in OR-PAM consequently hampers volumetric imaging speed, thereby imposing limitations on its practical applications, such as imaging of biological tissue with a rough surface (e.g., cerebrovascular11) and fast acquisition of physiological and pathological processes.7,9 Conventional photoacoustic microscopy utilizes axial scanning to achieve the volumetric imaging of sample, and the multi-focus photoacoustic data can be acquired by mechanically moving the probe or sample.12 The utilization of volumetric fusion of multi-focus photoacoustic data is a cost-effective strategy for enhancing the DoF of OR-PAM.
To address the limited DoF of OR-PAM, Yao et al.13 proposed double-illumination photoacoustic microscopy (PAM) by illuminating the sample from both the top and bottom sides simultaneously, which provides improved penetration depth and extended DoF. However, this method is restricted to thin biological tissue. Shi et al.14 utilized the Grueneisen relaxation effect to suppress the artifact introduced by the sidelobe of Bessel beam to achieve PAM with extended DoF. However, two lasers are required to excite the nonlinear photoacoustic signal. Hajireza et al.15 reported a multifocus OR-PAM for extended DoF based on wavelength tuning and chromatic aberration. However, this system is limited to the acquisition of multifocus imaging at discrete depths. These methods can achieve high-resolution photoacoustic imaging with large DoF, at the expense of increased system complexity and high cost. Multi-focus image fusion (MFIF), which is used to integrate multiple images of the same target with different focal positions into single in-focus image,16–18 has shown promising prospects in addressing the narrow DoF of microscopy system recently.19,20 Awasthi et al.21 proposed a deep learning-based model for fusing the photoacoustic images reconstructed using different algorithms to improve the quality of photoacoustic imaging. However, this model is primarily targeted at photoacoustic tomography and a large amount of data is required for training. Zhou et al.22 utilized a 2D image fusion algorithm with enhancement filtering to construct the photoacoustic image with extended DoF for accurate vascular quantification. However, this method falls short in the fusion of volumetric information for photoacoustic data.
In this work, a cost-effective volumetric fusion method is proposed, to facilitate the acquisition of high-resolution and large volumetric photoacoustic image with conventional PAM. The focused regions in multi-focus photoacoustic data were identified with the proposed 3D modified Laplacian operator. The misidentified regions in the built initial decision map (IDM) were corrected by consistency verification, and Gaussian filter (GF) was employed to smooth the map and reduce block artifact. Finally, photoacoustic data with enhanced DoF can be achieved by the voxel-wise weighted-averaging based on the final decision map (FDM). Quantitative evaluation suggests that the DoF of photoacoustic microscopy can be expanded by a factor of 1.7 while maintaining the lateral resolution within focused regions through the proposed method. The effectiveness and robustness of the proposed method were verified by fusing four sets of multi-focus vessel data under different noise levels.
2. Method
2.1. Volumetric Fusion Based on 3D Modified Laplacian Operator
To construct high-resolution and large volumetric photoacoustic imaging, the focused regions in multi-focus photoacoustic data were extracted and preserved in the fused imaging. A focus measure based on 3D modified Laplacian operator, which quantifies the sharpness of photoacoustic imaging, was proposed to identify focused regions within multi-focus data. The Laplacian operator for photoacoustic data is defined as
| (1) |
The second derivatives in orthogonal directions can have opposite signs and cancel each other.23 The 3D modified Laplacian operator for photoacoustic data , which utilizes the absolute values of the second derivatives to measure the signal intensity variation, is defined as
| (2) |
The sharper edges and contours within DoF, which result in more rapid intensity variation of photoacoustic signal, give higher response to the modified Laplacian operator. ML is defined as the discrete approximation of the modified Laplacian operator . The ML for photoacoustic data is given by
| (3) |
where is the signal intensity of at . The focus measure for the ’th image block of centered at is defined as the sum-modified Laplacian (SML) within the ’th block as shown in Eq. (4):
| (4) |
where determines the size of the block. The SML evaluates the high frequency information of an image block, and a larger SML represents a higher level of focus. The multi-focus photoacoustic data and with the size of simulated through the virtual OR-PAM24 were divided into non-overlapping blocks with equal size of , respectively. The focus measures based on the 3D modified Laplacian operator for each block in and were computed to build the IDM as shown in Eq. (5):
| (5) |
where and are the focus measures for the ’th block in and , respectively. The voxels within focused regions in multi-focus photoacoustic data can be identified through IDM. The voxel is considered to be within the focused regions in if IDM , and be within the focused regions in if IDM . The noise in the photoacoustic data can cause errors in the process of focus detection. Therefore, the consistency verification based on majority filter (MF) was employed to refine the IDM. If the ’th block is identified as the focused region in while the adjacent six blocks in the orthonormal six directions are identified as the focused regions in , the IDM for the voxels of j’th block are switched to zero and vice versa. The GF was then employed on the refined IDM to smooth the boundaries to generate FDM. The Gaussian filtering for IDM is formulated as
| (6) |
where is the Gaussian function for spatial difference. is a window centered at . is the normalization factor defined as
| (7) |
where is given by Eq. (8),
| (8) |
where is the standard deviation of Gaussian function . The high-resolution and large volumetric photoacoustic imaging was computed by the voxel-wise weighted-averaging as shown in Eq. (9):
| (9) |
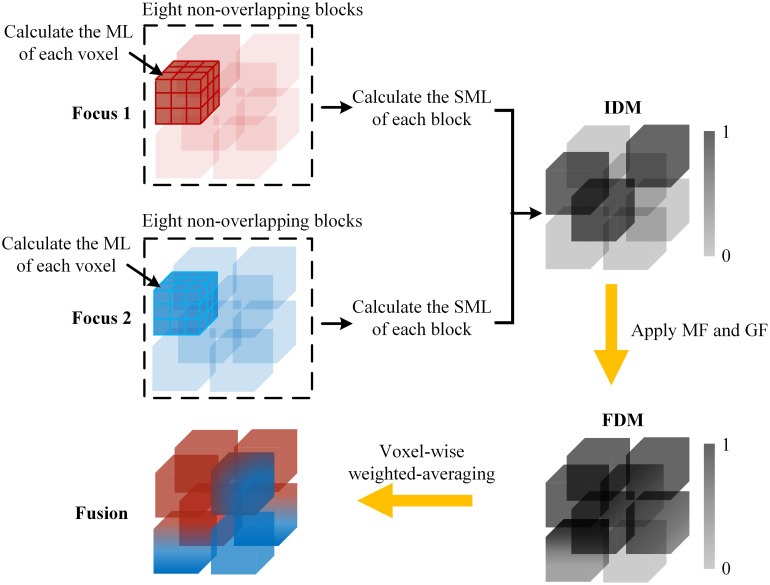
The process of the proposed volumetric fusion method is shown in Fig. 1. The ML of each voxel in multi-focus photoacoustic imaging was computed, and the multi-focus photoacoustic imaging was divided into non-overlapping blocks. The SML of each block was calculated and compared to construct the IDM. The IDM is refined with MF and smoothed with GF to generate the FDM. The Fusion can be constructed by voxel-wise weighted-averaging of multi-focus imaging based on the FDM.
Fig. 1.
Proposed volumetric fusion method based on SML. ML is the discrete approximation of .
2.2. Multi-Focus 3D Data Simulation through Virtual OR-PAM
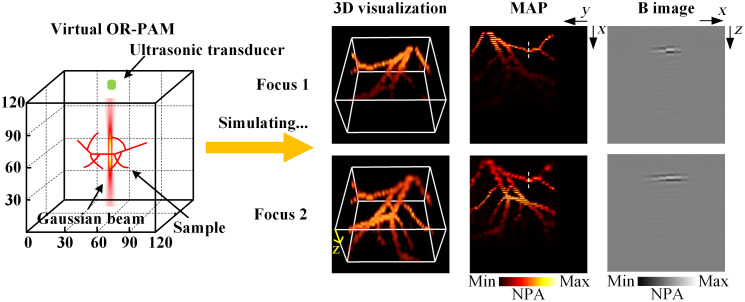
The multi-focus 3D photoacoustic data were simulated through a virtual photoacoustic microscopy24 using Gaussian beam, as shown in Fig. 2. An objective lens with a numerical aperture of 0.14 was used to generate the Gaussian beam. The wavelength of light was set as 532 nm. The 3D grid is and the pixel size is , . The medium around the sample was set as water, and the speed of sound was set to 1500 m/s. The photoacoustic signal was collected using an ultrasonic detector with a center frequency of 75 MHz and a bandwidth of 67%. Multi-focus photoacoustic data with two focuses were employed as an example to demonstrate the proposed method. Two vertically tilted fibers were placed in the grid as required and imaged to test the performance of the proposed method. Four sets of multi-focus tilted vessel at five noise levels (Gaussian noise was added in the experiment since most noise in photoacoustic imaging can be considered as Gaussian noise25–28) were simulated to further validate the robustness and effectiveness of the proposed method. The experiment data in this work were simulated through a 64-bit Windows 10, Intel (R) Core (TM) i7-12700H CPU @ 2.30 GHz desktop running windows operating system. The 3D visualization and max amplitude projection (MAP) images of the simulated multi-focus photoacoustic data presented in Fig. 2 show that the imaging within DoF reveals more details while the imaging outside the DoF appears partially blurred. The B images of the simulated multi-focus data at the position indicated by the white dashed lines in the MAP images demonstrate that the lateral resolution within focused regions is better than that of the defocused regions.
Fig. 2.
Acquisition of multi-focus photoacoustic imaging through the virtual OR-PAM. NPA, normalized photoacoustic amplitude.
3. Results
3.1. Performance Test by Fusing Multi-Focus Vertically Tilted Fiber
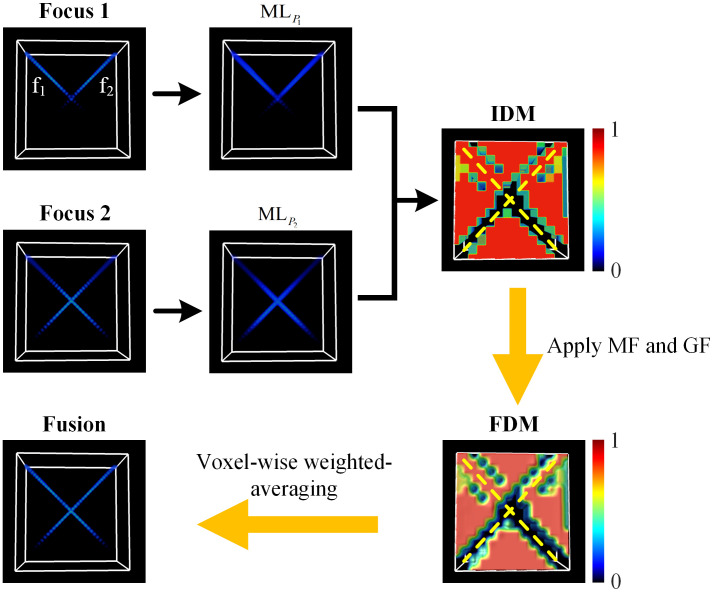
The performance of the proposed method was tested by fusing multi-focus vertically tilted fibers as shown in Figs. 3 and 4. Figure 3 shows the process of the proposed volumetric information fusion method, taking the simulated fibers and as an example. The focus measures based on 3D modified Laplacian operator of multi-focus fiber were calculated to generate the IDM. The IDM was then refined and smoothed by filtering to generate the FDM, and photoacoustic imaging with extended DoF can be achieved by the voxel-wise weighted-averaging, as shown in Fig. 3.
Fig. 3.
Demonstration for the process of volumetric fusion, taking the fusion of multi-focus fiber as an example. and are the two vertically tilted fibers. and are the discrete approximation of for and, respectively. The yellow dashed lines in IDM and FDM indicate the position of fibers and .
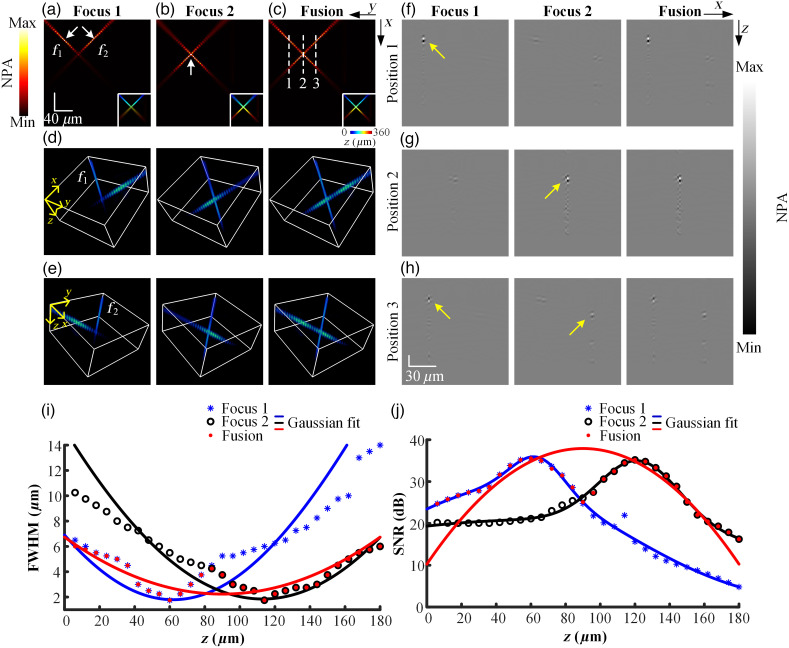
Fig. 4.
(a), (b) MAP images of multi-focus fiber data. (c) MAP image of the fiber fused through the proposed method. The depth-coding MAP images of (a)–(c) are presented in the lower right corner, respectively. (d), (e) 3D visualization of the multi-focus fiber from two views, respectively. and are the two vertically tilted fibers. (f)–(h) B images of the white dashed lines in panel (c) before and after fusion. (i) Variation of FWHM along with the depth before and after fusion. (j) Variation of SNR along with the depth before and after fusion. NPA, normalized photoacoustic amplitude.
Figures 4(a) and 4(b) are the MAP images of multi-focus fiber where the optical focuses were set at (Focus 1) and (Focus 2) in the 3D grid, respectively. Figure 4(c) is the MAP image of the fused fiber (Fusion). The depth-coding MAP images of Figs. 4(a)–4(c) are displayed in the lower right corner, respectively. The focal planes of Focus 1 and Focus 2 are indicated by the white arrows. Figures 4(d) and 4(e) are the 3D visualization of the fibers before and after fusion from two views rendered by Amira software, respectively. The narrow DoF limits OR-PAM from capturing the complete structure of fibers through single imaging. The lateral resolution and signal-to-noise ratio (SNR) degrade rapidly outside the focal plane, which results in partially blurred imaging. The location of optical focus determines the clear portion of imaging. As shown in Figs. 4(a)–4(c), the large volumetric and high-resolution fiber can be achieved by fusing multi-focus fiber data through the proposed method. The B images of Focus 1, Focus 2, and Fusion at three depths indicated by the white dashed lines in Fig. 4(c) are shown in Figs. 4(f)–4(h). The in-focus signals in the B images are indicated by the yellow arrows. The lateral resolution of the focused regions can be preserved in the fused B images, which verifies that the proposed method can identify the focused regions accurately at different depths. The full width at half maximum (FWHM) of the profile of the fiber before and after fusion was measured, as shown in Fig. 4(i). A smaller FWHM suggests a better lateral resolution. The lateral resolution in the focused part (30 to of Focus 1, 80 to of Focus 2) is better than that of the defocused part (80 to of Focus 1, 30 to of Focus 2). The DoF of OR-PAM is quantified as the depth interval over which the FWHM of the fiber becomes twice that of the focal plane. The DoF of the fiber of Focus 1, Focus 2, and Fusion was measured to be about 71.2, 79.9, and , respectively, which suggests that the proposed method can increase the DoF of OR-PAM by a factor of 1.7 without sacrificing the lateral resolution. The SNR variation of the fiber along the depth direction was measured, as shown in Fig. 4(j). The SNR in the focused part (30 to of Focus 1, 80 to of Focus 2) is higher than that of the defocused part (80 to of Focus 1, 30 to of Focus 2) and is precisely preserved in the fused fiber.
3.2. Large Imaging of Vascular
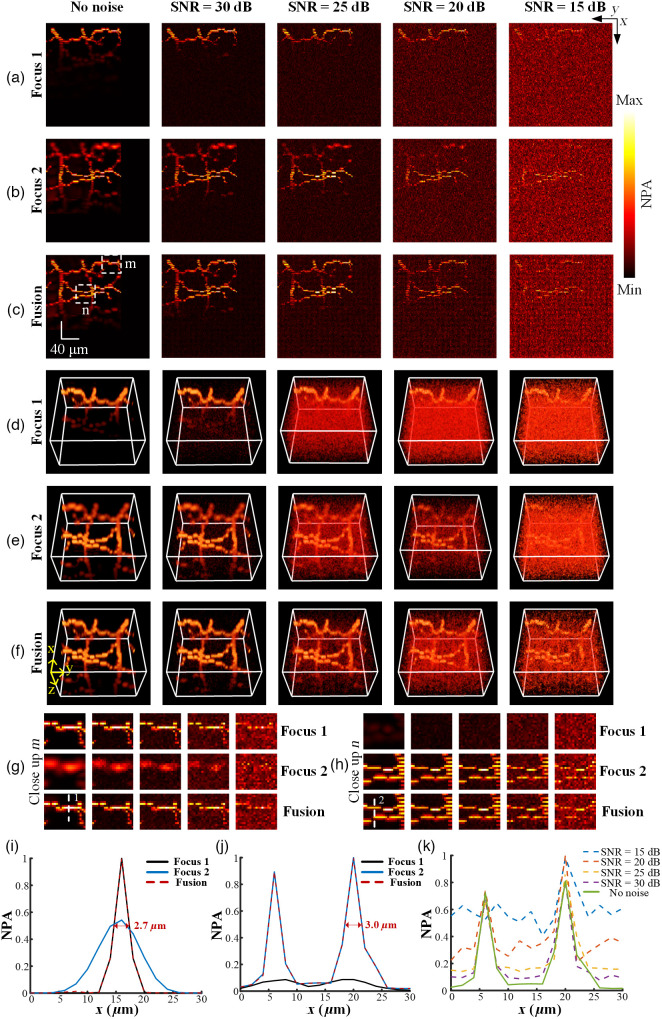
The robustness and effectiveness of the proposed method were verified by fusing multi-focus vessels at five noise levels, as shown in Fig. 5. Figures 5(a) and 5(b) are the MAP images of 1 set of multi-focus vessels where the optical focuses were set at (Focus 1) and (Focus 2) in the 3D grid, respectively. The complete structure of the vessel cannot be captured in single imaging due to the narrow DoF as shown in Figs. 4(a) and 4(b). The noise presented in the MAP images increases with the decrease in SNR. Figure 5(c) is the MAP image of the high-resolution and large volumetric data (Fusion) obtained via the proposed method at five noise levels, which verifies the remarkable robustness to noise using our method. The focused regions can be accurately identified through the proposed 3D modified Laplacian operator under noise condition. Figures 5(d)–5(f) are the 3D visualization rendered by Amira software for intuitive observation. The normalized intensity distribution at positions 1 and 2 indicated by the white dashed lines in Figs. 5(g) and 5(h) was analyzed to evaluate the capability to preserve lateral resolution within focused regions using our method, as shown in Figs. 5(i) and 5(j). When there is no noise, the FWHM of the normalized photoacoustic signals of Focus 1, Focus 2, and Fusion at position 1 was measured to be 2.7 (Focus 1), 9.3 (Focus 2), and (Fusion), respectively, as shown in Fig. 5(i). The FWHM of the second peak of the normalized photoacoustic signals of Focus 1, Focus 2, and Fusion at position 2 was measured to be 9.9 (Focus 1), 3.0 (Focus 2), and (Fusion), respectively, as shown in Fig. 5(j). The lateral resolution within focused regions can be maintained in the fused vessel through the voxel-wise weighted-averaging fusion rule, which validates the effectiveness of the proposed method in processing the sample with intricate structure. The normalized intensity distribution of the Fusion at position 2 under different noise levels was analyzed, as shown in Fig. 5(k). The influence of noise on the photoacoustic signal is insignificant when SNR is 30 dB. The decrease in SNR leads to the increase of the influence of noise on the photoacoustic signal. The photoacoustic signal cannot be visually distinguished from the added noise when SNR drops to 15 dB, as shown in Fig. 5(k). However, the focused regions within DoF can be accurately identified and preserved through the proposed method when a high level of noise is added, which further verifies the effectiveness and robustness of our method.
Fig. 5.
(a)–(b) MAP images of multi-focus vessel data at five noise levels. (c) MAP image of the vessel fused through the proposed method. (d)–(f) 3D visualization for (a)–(c) rendered by the Amira software. (g) Close-up images of vessel before and after fusion at five noise levels indicated by the white dashed rectangle in panel (c). (h) Close-up images of vessel before and after fusion at five noise levels indicated by the white dashed rectangle in panel (c). (i), (j) Normalized intensity distribution before and after fusion at position 1 and 2 indicated by the white dashed lines in panels (g) and (h). (k) Normalized intensity distribution of the fused vessel under five noise levels at position 2 indicated by the white dashed line in panel (h). NPA, normalized photoacoustic amplitude.
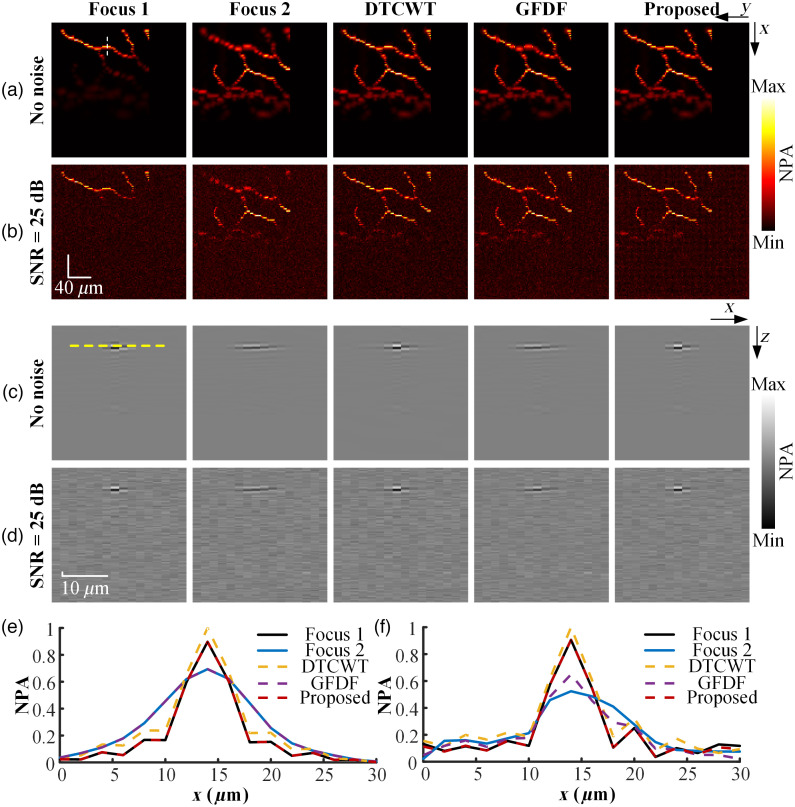
The superior performance of the proposed method over previous representative 2D-based MFIF algorithms was verified by comparing the MAP images and B images of the fused data. Two state-of-the-art MFIF methods, including the transform domain-based method dual tree complex wavelet transform (DTCWT)29 and the spatial domain-based method guided filter-based focus region detection for multi-focus image fusion (GFDF),30 were selected for comparison. Four common metrics in MFIF were selected to quantify the performance of different methods from multiple perspectives, including (1) information theory-based metric cross entropy (CE),31 which estimates the dissimilarity between source images and fused image in terms of information; (2) image feature-based metric spatial frequency (SF),32 which reveals the edge and texture information of the fused image; (3) human perception-based metric ,33 which quantifies the performance of MFIF algorithm by leveraging the principles of human visual system; and (4) similarity-based metric structural similarity index measure (SSIM),34 which measures the similarity between source images and fused image in terms of luminance, contrast, and structure. The multi-focus volumetric imaging of vessel was sliced to establish the multi-focus slice sequence. The 2D slices at the same position in multi-focus sequence are processed with DTCWT and GFDF, respectively. The fused 2D slices were stacked to produce high-resolution photoacoustic imaging with extended DoF. As shown in Fig. 6, one group of simulated multi-focus vessel was selected to compare different methods at two noise levels. Figures 6(a) and 6(b) are the MAP images of the Focus 1, Focus 2, and fused vessel obtained via different methods when no noise is added and , respectively. The B images at the position indicated by the white dashed line in Fig. 6(a) before and after fusion were compared, as shown in Figs. 6(c) and 6(d). The normalized intensity distribution of photoacoustic signal processed with Hilbert transform at the position indicated by the yellow dashed line in Fig. 6(c) before and after fusion is compared, as shown in Figs. 6(e) and 6(f). The proposed method, which utilizes the 3D modified Laplacian operator for the focus measure of volumetric imaging, can accurately identify and preserve the lateral resolution within focused regions at different noise levels compared to 2D-based MFIF methods. By contrast, the GFDF, which was affected by the lateral resolution outside the DoF in Focus 2, failed to identify the lateral resolution within focused regions at different noise levels. The poorer lateral resolution within the defocused regions in Focus 2 was mistakenly preserved in the fused photoacoustic imaging, as shown in Figs. 6(c)–6(f). The outperformance of the proposed method is attributed to the direct focus detection and fusion of volumetric information, whereas the slicing process of volumetric imaging leads to a loss of spatial correlation when implementing 2D-based MFIF methods. The MAP images of the 4 groups of high-resolution and large volumetric vessel obtained through different methods were evaluated using 4 metrics when there is no noise and , respectively, as shown in Table 1. The proposed volumetric fusion method outperforms the conventional 2D-based MFIF method from multiple perspectives, which further validates the effectiveness of the direct fusion of volumetric photoacoustic information.
Fig. 6.
(a), (b) MAP images of Focus 1, Focus 2, and the fused data when there is no noise and , respectively. (c), (d) B images at the position indicated by the white dashed line in panel (a) when there is no noise and , respectively. (e), (f) Normalized intensity distribution at the position indicated by the yellow dash line in panel (c) when there is no noise and , respectively. NPA, normalized photoacoustic amplitude.
Table 1.
Quantitative evaluation of different methods.
| Method | Noise level | CE | SF | SSIM | |
|---|---|---|---|---|---|
| DTCWT | No noise | 0.1008 | 28.24 | 34.42 | 1.7263 |
| 25 dB | 0.1200 | 33.92 | 44.17 | 1.4280 | |
| GFDF | No noise | 0.0977 | 27.11 | 140.85 | 1.7241 |
| 25 dB | 0.1012 | 33.10 | 132.11 | 1.4412 | |
| Proposed | No noise | 0.0863 | 28.82 | 25.37 | 1.7264 |
| 25 dB | 0.0976 | 34.39 | 35.96 | 1.4277 |
4. Conclusion and Discussion
We proposed a noise insensitive volumetric fusion method that utilizes 3D modified Laplacian operator and Gaussian filtering to enhance the DoF of OR-PAM. Experimental results demonstrate that the proposed method is capable of extending the DoF of OR-PAM by a factor of 1.7 and shows superior performance at different levels of noise. The superiority of the proposed method over previous 2D-based MFIF methods was quantitatively verified with four categories of metrics. Our work provides a cost-effective approach for the acquisition of photoacoustic imaging with extended DoF.
The virtual OR-PAM, which is capable of performing A, B, and C scan, was verified to be consistent with the actual OR-PAM system.11,35,36 Hence, the experiments based on the virtual OR-PAM are reliable. For sample with simple structure, the focused boundary can be determined through the quantification of FWHM or SNR, and the volumetric fusion can be achieved through the simple combination of multi-focus data. For example, the focused boundary of the multi-focus fiber in this work can be estimated as a single plane given by the intersection between the FWHM of Focus 1 and Focus 2, as shown in Fig. 4(i). For sample with intricate structure (such as cerebrovascular), accurately quantifying the variation of FWHM and SNR along depth direction is difficult. In addition, the depth of optical focus experiences a shift due to the variations in scattering and absorption of heterogeneous samples.37 The focused boundary cannot be approximated as a single plane. Therefore, this approach is not applicable to turbid biological tissue and limited to transparent sample with weak absorption and scattering such as water. Furthermore, this approach can be time-consuming and labor-intensive for multi-focus data that include more than two focuses. By contrast, the proposed method can automatically identify and preserve the focused regions within multi-focus data in the fusion results.
In this work, the effectiveness of the proposed method was demonstrated through dual-focus photoacoustic data of fiber and vessel. Actually, the proposed method can be applied to multi-focus data that include more than two focuses by pairwise fusion. Dual-focus data with adjacent focuses can be first combined through the proposed method. Then, the resulting fused data can be subsequently integrated with data from another adjacent focus. This process is repeated iteratively until the data from all focuses have been processed to achieve high-resolution and large volumetric photoacoustic imaging. The proposed method is not limited by the focal positions, or the number of focuses in multi-focus data. Compared to the approach of estimating a focused boundary through FWHM quantification, the proposed method exhibits the advantages of enhanced flexibility, ease of portability, and broader applicability.
Acknowledgments
The authors thank Ganyu Chen from Jiluan Academy, Nanchang University for her help with the data acquisition using virtual OR-PAM in this work. The authors thank Xiaohai Yu and Rui Wang from Ji luan Academy, Nanchang University for their help with the discussion of signal processing in this work. This work was supported by the National Natural Science Foundation of China (Grant No. 62265011), Jiangxi Provincial Natural Science Foundation (Grant Nos. 20224BAB212006 and 20232BAB202038), Key Research and Development Program of Jiangxi Province (Grant No. 20212BBE53001), and Training Program of Innovation and Entrepreneurship for Undergraduates in Nanchang University (Grant Nos. 2020CX152, 202110403052, and 2021CX157).
Biographies
Sihang Li is currently studying for a bachelor’s degree in the School of Qianhu at Nanchang University, Nanchang, China. His research interests include photoacoustic microscopy, information fusion, and signal processing.
Hao Wu is currently studying for a bachelor’s degree in electronic information engineering at Nanchang University, Nanchang, China. His research interests include holographic imaging, photoacoustic tomography, and deep learning.
Hongyu Zhang is currently studying for a bachelor’s degree in electronic information engineering at Nanchang University, Nanchang, China. His research interests include photoacoustic tomography, deep learning, and medical image processing.
Zhipeng Zhang is currently studying for a bachelor’s degree in communication engineering at Nanchang University, Nanchang, China. His research interests include image processing, artificial intelligence, photoacoustic tomography, and holographic imaging.
Qiugen Liu received his PhD in biomedical engineering from Shanghai Jiao Tong University, Shanghai, China, in 2012. Currently, he is a professor at Nanchang University. He is a winner of the Excellent Young Scientists Fund. He has published more than 50 publications and serves as committee member of several international and domestic academic organizations. His research interests include artificial intelligence, computational imaging, and image processing.
Xianlin Song received his PhD in optical engineering from Huazhong University of Science and Technology, China in 2019. He joined the School of Information Engineering at Nanchang University as an assistant professor in 2019. He has published more than 20 publications and given more than 15 invited presentations at international conferences. His research topics include optical imaging, biomedical imaging, and photoacoustic imaging.
Contributor Information
Sihang Li, Email: 6109120062@email.ncu.edu.cn.
Hao Wu, Email: 6105120143@email.ncu.edu.cn.
Hongyu Zhang, Email: 6105120152@email.ncu.edu.cn.
Zhipeng Zhang, Email: 6105120158@email.ncu.edu.cn.
Qiugen Liu, Email: liuqiegen@hotmail.com.
Xianlin Song, Email: songxianlin@ncu.edu.cn.
Disclosures
The authors declare no conflicts of interest.
Code, Data, and Materials Availability
The data that support the findings of this study are available upon reasonable request.
References
- 1.Wang L. V., Yao J., “A practical guide to photoacoustic tomography in the life sciences,” Nat. Methods 13(8), 627–638 (2016). 10.1038/nmeth.3925 [DOI] [PMC free article] [PubMed] [Google Scholar]
- 2.Steinberg I., et al. , “Photoacoustic clinical imaging,” Photoacoustics 14, 77–98 (2019). 10.1016/j.pacs.2019.05.001 [DOI] [PMC free article] [PubMed] [Google Scholar]
- 3.Hosseinaee Z., et al. , “Towards non-contact photoacoustic imaging,” Photoacoustics 20, 100207 (2020). 10.1016/j.pacs.2020.100207 [DOI] [PMC free article] [PubMed] [Google Scholar]
- 4.Gröhl J., et al. , “Deep learning for biomedical photoacoustic imaging: a review,” Photoacoustics 22, 100241 (2021). 10.1016/j.pacs.2021.100241 [DOI] [PMC free article] [PubMed] [Google Scholar]
- 5.Wang R., et al. , “Photoacoustic imaging with limited sampling: a review of machine learning approaches,” Biomed. Opt. Express 14(4), 1777–1799 (2023). 10.1364/BOE.483081 [DOI] [PMC free article] [PubMed] [Google Scholar]
- 6.Tang K., et al. , “Denoising method for photoacoustic microscopy using deep learning,” Proc. SPIE 11525, 611–616 (2020). 10.1117/12.2584879 [DOI] [Google Scholar]
- 7.Manohar S., Dantuma M., “Current and future trends in photoacoustic breast imaging,” Photoacoustics 16, 100134 (2019). 10.1016/j.pacs.2019.04.004 [DOI] [PMC free article] [PubMed] [Google Scholar]
- 8.Yang M., et al. , “Photoacoustic/ultrasound dual imaging of human thyroid cancers: an initial clinical study,” Biomed. Opt. Express 8(7), 3449–3457 (2017). 10.1364/BOE.8.003449 [DOI] [PMC free article] [PubMed] [Google Scholar]
- 9.Menozzi L., et al. , “Three-dimensional non-invasive brain imaging of ischemic stroke by integrated photoacoustic, ultrasound and angiographic tomography (PAUSAT),” Photoacoustics 29, 100444 (2023). 10.1016/j.pacs.2022.100444 [DOI] [PMC free article] [PubMed] [Google Scholar]
- 10.Zhou Y., et al. , “Optical-resolution photoacoustic microscopy with ultrafast dual-wavelength excitation,” J. Biophotonics 13(6), e201960229 (2020). 10.1002/jbio.201960229 [DOI] [PubMed] [Google Scholar]
- 11.Jiang B., Yang X., Luo Q., “Reflection-mode Bessel-beam photoacoustic microscopy for in vivo imaging of cerebral capillaries,” Opt. Express 24(18), 20167–20176 (2016). 10.1364/OE.24.020167 [DOI] [PubMed] [Google Scholar]
- 12.Lan B., et al. , “High-speed widefield photoacoustic microscopy of small-animal hemodynamics,” Biomed. Opt. Express 9(10), 4689–4701 (2018). 10.1364/BOE.9.004689 [DOI] [PMC free article] [PubMed] [Google Scholar]
- 13.Yao J., et al. , “Double-illumination photoacoustic microscopy,” Opt. Lett. 37(4), 659–661 (2012). 10.1364/OL.37.000659 [DOI] [PMC free article] [PubMed] [Google Scholar]
- 14.Shi J., et al. , “Bessel-beam Grueneisen relaxation photoacoustic microscopy with extended depth of field,” J. Biomed. Opt. 20(11), 116002 (2015). 10.1117/1.JBO.20.11.116002 [DOI] [PMC free article] [PubMed] [Google Scholar]
- 15.Hajireza P., Forbrich A., Zemp R. J., “Multifocus optical-resolution photoacoustic microscopy using stimulated Raman scattering and chromatic aberration,” Opt. Lett. 38(15), 2711–2713 (2013). 10.1364/OL.38.002711 [DOI] [PubMed] [Google Scholar]
- 16.Liu Y., et al. , “Multi-focus image fusion: a survey of the state of the art,” Inf. Fusion 64, 71–91 (2020). 10.1016/j.inffus.2020.06.013 [DOI] [Google Scholar]
- 17.Zhang X., “Deep learning-based multi-focus image fusion: a survey and a comparative study,” IEEE Trans. Pattern Anal. Mach. Intell. 44(9), 4819–4838 (2021). 10.1109/TPAMI.2021.3078906 [DOI] [PubMed] [Google Scholar]
- 18.Zhang H., et al. , “Image fusion meets deep learning: a survey and perspective,” Inf. Fusion 76, 323–336 (2021). 10.1016/j.inffus.2021.06.008 [DOI] [Google Scholar]
- 19.Manescu P., et al. , “Content aware multi-focus image fusion for high-magnification blood film microscopy,” Biomed. Opt. Express 13(2), 1005–1016 (2022). 10.1364/BOE.448280 [DOI] [PMC free article] [PubMed] [Google Scholar]
- 20.Liang Y., et al. , “Efficient misalignment-robust multi-focus microscopical images fusion,” Signal Process. 161, 111–123 (2019). 10.1016/j.sigpro.2019.03.020 [DOI] [Google Scholar]
- 21.Awasthi N., et al. , “PA-Fuse: deep supervised approach for the fusion of photoacoustic images with distinct reconstruction characteristics,” Biomed. Opt. Express 10(5), 2227–2243 (2019). 10.1364/BOE.10.002227 [DOI] [PMC free article] [PubMed] [Google Scholar]
- 22.Zhou W., et al. , “Multi-focus image fusion with enhancement filtering for robust vascular quantification using photoacoustic microscopy,” Opt. Lett. 47(15), 3732–3735 (2022). 10.1364/OL.459629 [DOI] [PubMed] [Google Scholar]
- 23.Nayar S. K., Nakagawa Y., “Shape from focus,” IEEE Trans. Pattern Anal. Mach. Intell. 16(8), 824–831 (1994). 10.1109/34.308479 [DOI] [Google Scholar]
- 24.Song X., et al. , “Virtual optical-resolution photoacoustic microscopy using the k-wave method,” Appl. Opt. 60(36), 11241–11246 (2021). 10.1364/AO.444106 [DOI] [PubMed] [Google Scholar]
- 25.Guney G., et al. , “Comparison of noise reduction methods in photoacoustic microscopy,” Comput. Biol. Med. 109, 333–341 (2019). 10.1016/j.compbiomed.2019.04.035 [DOI] [PubMed] [Google Scholar]
- 26.Stephanian B., et al. , “Additive noise models for photoacoustic spatial coherence theory,” Biomed. Opt. Express 9(11), 5566–5582 (2018). 10.1364/BOE.9.005566 [DOI] [PMC free article] [PubMed] [Google Scholar]
- 27.Kong Q., et al. , “Denoising signals for photoacoustic imaging in frequency domain based on empirical mode decomposition,” Optik 160, 402–414 (2018). 10.1016/j.ijleo.2018.02.023 [DOI] [Google Scholar]
- 28.Kazakeviciute A., Ho C. J. H., Olivo M., “Multispectral photoacoustic imaging artifact removal and denoising using time series model-based spectral noise estimation,” IEEE Trans. Med. Imaging 35(9), 2151–2163 (2016). 10.1109/TMI.2016.2550624 [DOI] [PubMed] [Google Scholar]
- 29.Hill P. R., Canagarajah C. N., Bull D. R., “Image fusion using complex wavelets,” in Br. Mach. Vis. Conf.,Marshall D., Rosin P. L., Eds., BMVA, pp. 1–10 (2002). 10.5244/C.16.47 [DOI] [Google Scholar]
- 30.Qiu X., et al. , “Guided filter-based multi-focus image fusion through focus region detection,” Signal Process. Image Commun. 72, 35–46 (2019). 10.1016/j.image.2018.12.004 [DOI] [Google Scholar]
- 31.Bulanon D. M., Burks T. F., Alchanatis V., “Image fusion of visible and thermal images for fruit detection,” Biosyst. Eng. 103(1), 12–22 (2009). 10.1016/j.biosystemseng.2009.02.009 [DOI] [Google Scholar]
- 32.Eskicioglu A. M., Fisher P. S., “Image quality measures and their performance,” IEEE Trans. Commun. 43(12), 2959–2965 (1995). 10.1109/26.477498 [DOI] [Google Scholar]
- 33.Chen H., Varshney P. K., “A human perception inspired quality metric for image fusion based on regional information,” Inf. Fusion 8(2), 193–207 (2007). 10.1016/j.inffus.2005.10.001 [DOI] [Google Scholar]
- 34.Liu Z., et al. , “Objective assessment of multiresolution image fusion algorithms for context enhancement in night vision: a comparative study,” IEEE Trans. Pattern Anal. Mach. Intell. 34(1), 94–109 (2011). 10.1109/TPAMI.2011.109 [DOI] [PubMed] [Google Scholar]
- 35.Yang X., et al. , “Multifocus optical-resolution photoacoustic microscope using ultrafast axial scanning of single laser pulse,” Opt. Express 25(23), 28192–28200 (2017). 10.1364/OE.25.028192 [DOI] [Google Scholar]
- 36.Liu Y., et al. , “Assessing the effects of norepinephrine on single cerebral microvessels using optical-resolution photoacoustic microscope,” J. Biomed. Opt. 18(7), 076007 (2013). 10.1117/1.JBO.18.7.076007 [DOI] [PubMed] [Google Scholar]
- 37.Yi L., Sun L., Ming X., “Simulation of penetration depth of Bessel beams for multifocal optical coherence tomography,” Appl. Opt. 57(17), 4809–4814 (2018). 10.1364/AO.57.004809 [DOI] [PubMed] [Google Scholar]
Associated Data
This section collects any data citations, data availability statements, or supplementary materials included in this article.
Data Availability Statement
The data that support the findings of this study are available upon reasonable request.


