

Key Points
Question
Are lower values for estimated glomerular filtration rate (eGFR based on either creatinine alone or creatinine and cystatin C) and more severe albuminuria associated with adverse kidney and cardiovascular outcomes?
Findings
In this retrospective individual-level data analysis of 27 503 140 individuals from 114 cohorts, lower eGFR and more severe albuminuria were each associated with higher rates of adverse kidney outcomes, including kidney failure with replacement therapy and acute kidney injury. Lower eGFR and more severe albuminuria also were associated with adverse cardiovascular outcomes, including cardiovascular mortality, heart failure, and atrial fibrillation.
Meaning
Lower eGFR values and more severe albuminuria were associated with multiple adverse outcomes.
Abstract
Importance
Chronic kidney disease (low estimated glomerular filtration rate [eGFR] or albuminuria) affects approximately 14% of adults in the US.
Objective
To evaluate associations of lower eGFR based on creatinine alone, lower eGFR based on creatinine combined with cystatin C, and more severe albuminuria with adverse kidney outcomes, cardiovascular outcomes, and other health outcomes.
Design, Setting, and Participants
Individual-participant data meta-analysis of 27 503 140 individuals from 114 global cohorts (eGFR based on creatinine alone) and 720 736 individuals from 20 cohorts (eGFR based on creatinine and cystatin C) and 9 067 753 individuals from 114 cohorts (albuminuria) from 1980 to 2021.
Exposures
The Chronic Kidney Disease Epidemiology Collaboration 2021 equations for eGFR based on creatinine alone and eGFR based on creatinine and cystatin C; and albuminuria estimated as urine albumin to creatinine ratio (UACR).
Main Outcomes and Measures
The risk of kidney failure requiring replacement therapy, all-cause mortality, cardiovascular mortality, acute kidney injury, any hospitalization, coronary heart disease, stroke, heart failure, atrial fibrillation, and peripheral artery disease. The analyses were performed within each cohort and summarized with random-effects meta-analyses.
Results
Within the population using eGFR based on creatinine alone (mean age, 54 years [SD, 17 years]; 51% were women; mean follow-up time, 4.8 years [SD, 3.3 years]), the mean eGFR was 90 mL/min/1.73 m2 (SD, 22 mL/min/1.73 m2) and the median UACR was 11 mg/g (IQR, 8-16 mg/g). Within the population using eGFR based on creatinine and cystatin C (mean age, 59 years [SD, 12 years]; 53% were women; mean follow-up time, 10.8 years [SD, 4.1 years]), the mean eGFR was 88 mL/min/1.73 m2 (SD, 22 mL/min/1.73 m2) and the median UACR was 9 mg/g (IQR, 6-18 mg/g). Lower eGFR (whether based on creatinine alone or based on creatinine and cystatin C) and higher UACR were each significantly associated with higher risk for each of the 10 adverse outcomes, including those in the mildest categories of chronic kidney disease. For example, among people with a UACR less than 10 mg/g, an eGFR of 45 to 59 mL/min/1.73 m2 based on creatinine alone was associated with significantly higher hospitalization rates compared with an eGFR of 90 to 104 mL/min/1.73 m2 (adjusted hazard ratio, 1.3 [95% CI, 1.2-1.3]; 161 vs 79 events per 1000 person-years; excess absolute risk, 22 events per 1000 person-years [95% CI, 19-25 events per 1000 person-years]).
Conclusions and Relevance
In this retrospective analysis of 114 cohorts, lower eGFR based on creatinine alone, lower eGFR based on creatinine and cystatin C, and more severe UACR were each associated with increased rates of 10 adverse outcomes, including adverse kidney outcomes, cardiovascular diseases, and hospitalizations.
This individual-participant data meta-analysis of 114 cohorts evaluates associations of lower estimated glomerular filtration rate (eGFR) based on creatinine alone, lower eGFR based on creatinine combined with cystatin C, and more severe albuminuria with adverse kidney outcomes, cardiovascular outcomes, and other health outcomes.
Introduction
Chronic kidney disease (CKD), which is defined by albuminuria (urine albumin to creatinine ratio [UACR] ≥30 mg/g/d) or a glomerular filtration rate (GFR) less than 60 mL/min/1.73 m2 that persists for at least 3 months, affects approximately 14% of adults in the US.1 Both lower estimated GFR (eGFR) values and more severe albuminuria have been associated with higher rates of kidney failure with replacement therapy, acute kidney injury, all-cause mortality, and cardiovascular mortality.2,3,4,5,6
This study evaluated associations of albuminuria, eGFR, and the combination of albuminuria and eGFR with 10 adverse health outcomes, consisting of incident kidney failure with replacement therapy, all-cause mortality, cardiovascular mortality, acute kidney injury, hospitalization, coronary heart disease, stroke, heart failure, atrial fibrillation, and peripheral artery disease. Associations were evaluated within subgroups of age, sex, and presence of diabetes and cardiovascular disease. The eGFR was assessed using race-free equations that incorporated creatinine alone or both creatinine and cystatin C.7 The prespecified analyses included evaluating whether eGFR based on creatinine and cystatin C was more strongly associated with adverse outcomes compared with eGFR based on creatinine alone.
Methods
Study Population
Investigators in the CKD Prognosis Consortium (ckdpc.org) were invited to participate in the current meta-analysis if their represented cohorts included individuals with both eGFR and albuminuria as well as having 50 events or more for at least 1 of the selected outcomes. For measures of prevalence and absolute incidence of adverse outcomes, we used data from the Optum Labs Data Warehouse, which is a data set with deidentified administrative claims and electronic health records for patients who were followed up longitudinally. The data derived from the electronic health records included a subset that was normalized and standardized into a single database.8 The study was approved by the institutional review board (IRB) at the Bloomberg School of Public Health, Johns Hopkins University. The data were preexisting and deidentified; however, in accordance with individual cohort policies, the study underwent expedited IRB approval. The IRB waived the requirement for informed consent.
Kidney Measures
All individuals had serum creatinine measurements with eGFR based on creatinine alone estimated using the race-free Chronic Kidney Disease Epidemiology Collaboration (CKD-EPI) 2021 creatinine equation.7 A subset of the population had serum creatinine and cystatin C measurements with eGFR estimated using the CKD-EPI 2021 creatinine-cystatin C equation. The methods for the creatinine and cystatin C measurements for each cohort are described in eAppendix 1 in Supplement 1.9,10,11 The categories of eGFR were 105 mL/min/1.73 m2 or greater, 90 to 104 mL/min/1.73 m2, 60 to 89 mL/min/1.73 m2, 45 to 59 mL/min/1.73 m2, 30 to 44 mL/min/1.73 m2, 15 to 29 mL/min/1.73 m2, and less than 15 mL/min/1.73 m2.
Albuminuria was measured and calculated as UACR, urine protein to creatinine ratio, or dipstick proteinuria. For the former 2 methods, both spot and 24-hour collections were accepted. For the latter 2 methods, the values were extrapolated to the UACR using a previously published multivariable conversion equation.12 In the categorical analyses, dipstick proteinuria categories of negative, trace, 1+, 2+, and 3+ or 4+ were classified into the UACR categories of less than 10 mg/g, 10 to 29 mg/g, 30 to 299 mg/g, 300 to 999 mg/g, and 1000 mg/g or greater, respectively. In the sensitivity analyses without dipstick values, all dipstick measures were classified in the missing UACR category.
Outcomes
The following outcomes were requested for each cohort: all-cause mortality, cardiovascular mortality (death due to cardiovascular disease), kidney failure with replacement therapy (receipt of chronic dialysis or kidney transplant), all-cause hospitalization, and hospitalizations for stroke (ischemic or hemorrhagic), myocardial infarction, heart failure (any hospitalization or death with heart failure), acute kidney injury, atrial fibrillation, and peripheral artery disease. Some of the cohorts were linked to the US Renal Data System13 to ascertain kidney failure with replacement therapy, some of the cohorts performed expert adjudication for specific outcomes, and some of the cohorts identified outcomes based on coding alone using the International Classification of Diseases, Ninth Revision, or the International Statistical Classification of Diseases and Related Health Problems, Tenth Revision. Cohort-specific outcome definitions appear in eAppendix 1 in Supplement 1. Individuals with a history of the outcome were excluded from the analyses of incident events. Each cohort contributed between 1 and 10 analyses, depending on the outcomes available for each cohort. General population cohorts with fewer than 50 events for a specific outcome and CKD cohorts with fewer than 25 events were excluded from the meta-analysis for the corresponding outcome.
Statistical Analyses
Cox proportional hazards models were used to relate kidney measurements to adverse outcomes separately in each cohort. Random-effects models were used for the meta-analysis of the hazard ratios (HRs). The kidney measurements were collected at a single visit. In the categorical analyses, individuals were classified by the categories of eGFR (<15, 15-29, 30-44, 45-59, 60-89, 90-104, and ≥105 mL/min/1.73 m2) and UACR (<10, 10-29, 30-299, 300-999, and ≥1000 mg/g). The models included interaction terms for all combinations of the eGFR and UACR categories (eg, the product terms of eGFR <15 mL/min/1.73 m2 and UACR <10 mg/g; eGFR of 15-29 mL/min/1.73 m2 and UACR <10 mg/g; and eGFR of 30-44 mL/min/1.73 m2 and UACR <10 mg/g, etc). The reference group was set as an eGFR of 90 to 104 mL/min/1.73 m2 and a UACR less than 10 mg/g. Because the CKD cohorts lacked individuals in the reference group, only general population and electronic health record cohorts were used in the categorical analyses.
Because fewer individuals had data to contribute to the eGFR analyses based on creatinine and cystatin C, the less common categories of eGFR and UACR were combined to ensure adequate numbers of events. Hence, the 2 lowest categories of eGFR were combined (<15 and 15-29 mL/min/1.73 m2) and the 2 highest categories of UACR were combined (300-999 and ≥1000 mg/g). Model adjustment differed depending on the outcome and included a subset of the following covariates: age, sex, smoking status (current, former, never), systolic blood pressure, total cholesterol, high-density lipoprotein cholesterol, body mass index, use of antihypertensive medications, and a history of diabetes, coronary heart disease, stroke, heart failure, atrial fibrillation, peripheral artery disease, cancer, and chronic obstructive pulmonary disease when relevant (eg, an analysis of incident peripheral artery disease as an outcome would not include peripheral artery disease as an adjustment variable). All covariate definitions and models appear in eAppendix 1 in Supplement 1.
Quantitative covariates were included in the model using a continuous scale. The missing data for albuminuria were treated as a separate category when the missingness exceeded 10% in a given cohort, otherwise a complete case analysis was performed. For other variables, the extent and handling of missing data are detailed in eTable 1 in Supplement 2 and in eAppendix 1 in Supplement 1. Models were run overall and by stratum for age (<65 years, ≥65 years) and sex (female, male).
To facilitate comparison of associations across cohorts, outcomes, and by filtration marker (eGFR based on creatinine alone vs eGFR based on creatinine and cystatin C), eGFR and UACR were also modeled continuously with linear spline terms and knots at eGFRs of 60 mL/min/1.73 m2 and 105 mL/min/1.73 m2 and log transformation for UACR. The model parameters were otherwise identical to those of the categorical analyses. Continuous analyses were performed in all cohorts, including the general population, electronic health record, and CKD cohorts. The meta-analysis of β coefficients from the Cox proportional hazards models used random effects as detailed above.
Forest plots were examined to assess the heterogeneity of the effect sizes across cohorts and cohort characteristics. Subgroup analyses were performed by age, sex, diabetes, and presence of cardiovascular disease. In the sensitivity analyses, continuous associations also were examined using other estimating equations for GFR, including previous CKD-EPI equations14,15 (CKD-EPI 2009 equation for eGFR based on creatinine alone and CKD-EPI 2012 equation for eGFR based on creatinine and cystatin C), but only using the non-Black (NB) race value, and European Kidney Function Collaboration (EKFC) equations16 (EKFC equations for eGFR based on creatinine alone and for eGFR based on creatinine and cystatin C).
After the meta-analysis of the β coefficients (log HRs), we compared log HRs within each combined category of eGFR and UACR across populations or subgroups of populations using matched-pair Wilcoxon signed rank tests. The between-population differences were summarized using medians and IQRs. A P value <.05 was considered statistically different.
The largest cohort, the Optum Labs Data Warehouse (electronic health records for populations of patients in the US) was used to estimate the prevalence for the eGFR and UACR categories and the unadjusted incidence rates for each adverse outcome within the categories of eGFR and UACR. For these analyses, single measurements for eGFR and albuminuria were used. The incidence of adverse outcomes was estimated individually within each of the 39 health systems and summarized as a median cohort value across each health system (eg, 19 health systems had higher incidence rates and 19 health systems had lower incidence rates). Adjusted excess incidence (ie, the difference in incidence comparing 1 combined eGFR and UACR category vs the reference category) was estimated by treating incidence rates in the median health system in the reference group among the Optum Labs Data Warehouse cohorts as a constant and combining the HRs from the meta-analysis for each group in the categorical analysis of eGFR based on creatinine alone.
All analyses were conducted using Stata MP version 16.1 (StataCorp). All statistical testing was 2-sided. Statistical significance was determined by P < .05.
Results
Study Population
A total of 120 cohorts were evaluated. Of these 120 cohorts, the individual cohort principal investigators refused to provide data for 2 cohorts and were unable to send data or perform the analysis within the time allotted for 4 cohorts, leaving 114 cohorts in this individual-participant data meta-analysis. The data sources included 37 observational studies or clinical trials of individuals identified from the general population, 49 electronic health record databases, and 28 observational studies or clinical trials of adults with CKD. Additional information on the included cohorts appears in eAppendix 1 and eAppendix 2 in Supplement 1.
Population With eGFR Based on Creatinine Alone
Of the 120 cohorts evaluated for inclusion, 114 cohorts including 27 503 140 individuals had data available for eGFR based on creatinine alone and were included in the analyses (Table 1). Among these individuals, the mean age was 54 years (SD, 17 years), 51% were women, the mean eGFR based on creatinine alone was 90 mL/min/1.73 m2 (SD, 22 mL/min/1.73 m2), and 33.0% had measures of albuminuria. Of those with albuminuria measures, the median UACR was 11 mg/g (IQR, 8-16 mg/g). The number of cohorts contributing to each outcome ranged from 52 (for acute kidney injury) to 108 (for all-cause mortality). The rates of adverse outcomes were lowest for peripheral artery disease (median rate among 62 cohorts, 1.4 events per 1000 person-years) and kidney failure with replacement therapy (median rate among 83 cohorts, 1.3 events per 1000 person-years) and highest for hospitalizations (median rate among 52 cohorts, 94 events per 1000 person-years) (eTable 2 in Supplement 2).
Table 1. Participant Characteristics for the Estimated Glomerular Filtration Rate (eGFR) Based on Creatinine Alone or Creatinine and Cystatin C.
| eGFR based on creatinine alone | eGFR based on creatinine and cystatin C |
|
|---|---|---|
| No. of cohorts | 114 | 20 |
| No. of individualsa | 27 503 140 | 721 394 |
| Age, mean (SD), y | 54 (17) | 59 (12) |
| Sex, % | ||
| Female | 51 | 53 |
| Male | 49 | 47 |
| Follow-up, mean (SD), y | 4.8 (3.3) | 10.8 (4.1) |
| Comorbid conditions, % | ||
| Taking medications for hypertension | 16.6 | 27.0 |
| Diabetes | 15.2 | 9.4 |
| Former smoking | 13.1 | 35.0 |
| Current smoking | 10.6 | 11.5 |
| Coronary heart disease | 9.9 | 6.3 |
| History of cancer | 13.0 | 10.8 |
| Chronic obstructive pulmonary disease | 7.5 | 2.4 |
| Atrial fibrillation | 4.5 | 4.7 |
| History of heart failure | 3.5 | 3.2 |
| History of stroke | 3.2 | 3.5 |
| Peripheral artery disease | 1.6 | 1.0 |
| Vital signs and laboratory studies | ||
| Systolic blood pressure, mean (SD), mm Hg | 126 (17) | 138 (20) |
| Body mass index, mean (SD)b | 29 (7) | 28 (5) |
| Cholesterol, mean (SD), mmol/L | ||
| Total | 4.7 (1.3) | 5.0 (1.1) |
| High-density lipoprotein | 1.3 (0.4) | 1.3 (0.4) |
| eGFR, mean (SD), mL/min/1.73 m2 | ||
| Based on creatinine alone | 90 (22) | 89 (20)c |
| Based on creatinine and cystatin C | 88 (22) | |
| Urine albumin to creatinine ratio, median (IQR), mg/gd | 11 (8-16) | 9 (6-18) |
SI conversion factors: To convert high-density and total cholesterol to mg/dL, divide by 0.0259.
Not necessarily the denominator for each characteristic. The proportion with missing data for each characteristic appears in eTable 1 in Supplement 2. Detailed definitions of each of these characteristics appear in eAppendix 1 in Supplement 1.
Calculated as weight in kilograms divided by height in meters squared.
Based on creatinine alone.
These data for measurement of albuminuria represent less than 50% of the analytic population (9 067 753 [33.0%] for eGFR based on creatinine alone and 320 443 [44.4%] for eGFR based on creatinine and cystatin C).
Population With eGFR Based on Creatinine and Cystatin C
There were 20 cohorts included with 721 394 individuals that had data for cystatin C (eGFR based on creatinine and cystatin C population). Among these individuals, the mean age was 59 years (SD, 12 years), 53% were women, the mean eGFR was 89 mL/min/1.73 m2 (SD, 20 mL/min/1.73 m2) based on creatinine alone vs 88 mL/min/1.73 m2 (SD, 22 mL/min/1.73 m2) based on creatinine and cystatin C, and 44.4% had measures of albuminuria. Of those with albuminuria measures, the median UACR was 9 mg/g (IQR, 6-18 mg/g).
Both Populations
The clinical characteristics for each cohort appear in eTable 3 in Supplement 2 (eGFR based on creatinine alone population) and in eTable 4 in Supplement 2 (eGFR based on creatinine and cystatin C population). Most individuals who were missing albuminuria data came from the electronic health record cohorts (95.4% of the population for eGFR based on creatinine alone and 99.8% of the population for eGFR based on creatinine and cystatin C). For the analyses of eGFR based on creatinine alone, the mean follow-up time was 4.8 years (SD, 3.3 years). For the analyses of eGFR based on creatinine and cystatin C, the mean follow-up was 10.8 years (SD, 4.1 years) and the number of cohorts contributing data ranged from 3 (for hospitalizations) to 20 (for all-cause mortality) (eTable 5 in Supplement 2).
Analyses According to eGFR Based on Creatinine Alone and UACR
In the categorical analyses of eGFR based on creatinine alone, compared with the reference category of 90 to 104 mL/min/1.73 m2, the lower categories (eGFR ≤60 mL/min/1.73 m2) were significantly associated with higher risk for each outcome. Compared with the reference UACR category of less than 10 mg/g, the higher categories were associated with higher rates for each outcome (Figure 1). Risks among people with missing UACR data were comparable with those within the UACR category of 10 to 29 mg/g (median difference in log HRs, −0.03 [IQR, −0.11 to 0.09], P = .39; eTable 6 in Supplement 2). The patterns of risk associations were similar across each age category and among men and women, although the relative risks (RRs) were weaker in the older age (≥65 years) category compared with the younger age (<65 years) category (median difference in log HRs, −0.45 [interquartile interval {IQI}, −0.70 to −0.14], P < .001) and very slightly stronger in women compared with men (median difference in log HRs, 0.04 [IQI, −0.05 to 0.13], P < .001; eTable 7 in Supplement 2).
Figure 1. Categorical Analysis of the Associations of Estimated Glomerular Filtration Rate (eGFR) and Albuminuria With Subsequent Adverse Outcomes in the Population Based on Creatinine Alone.
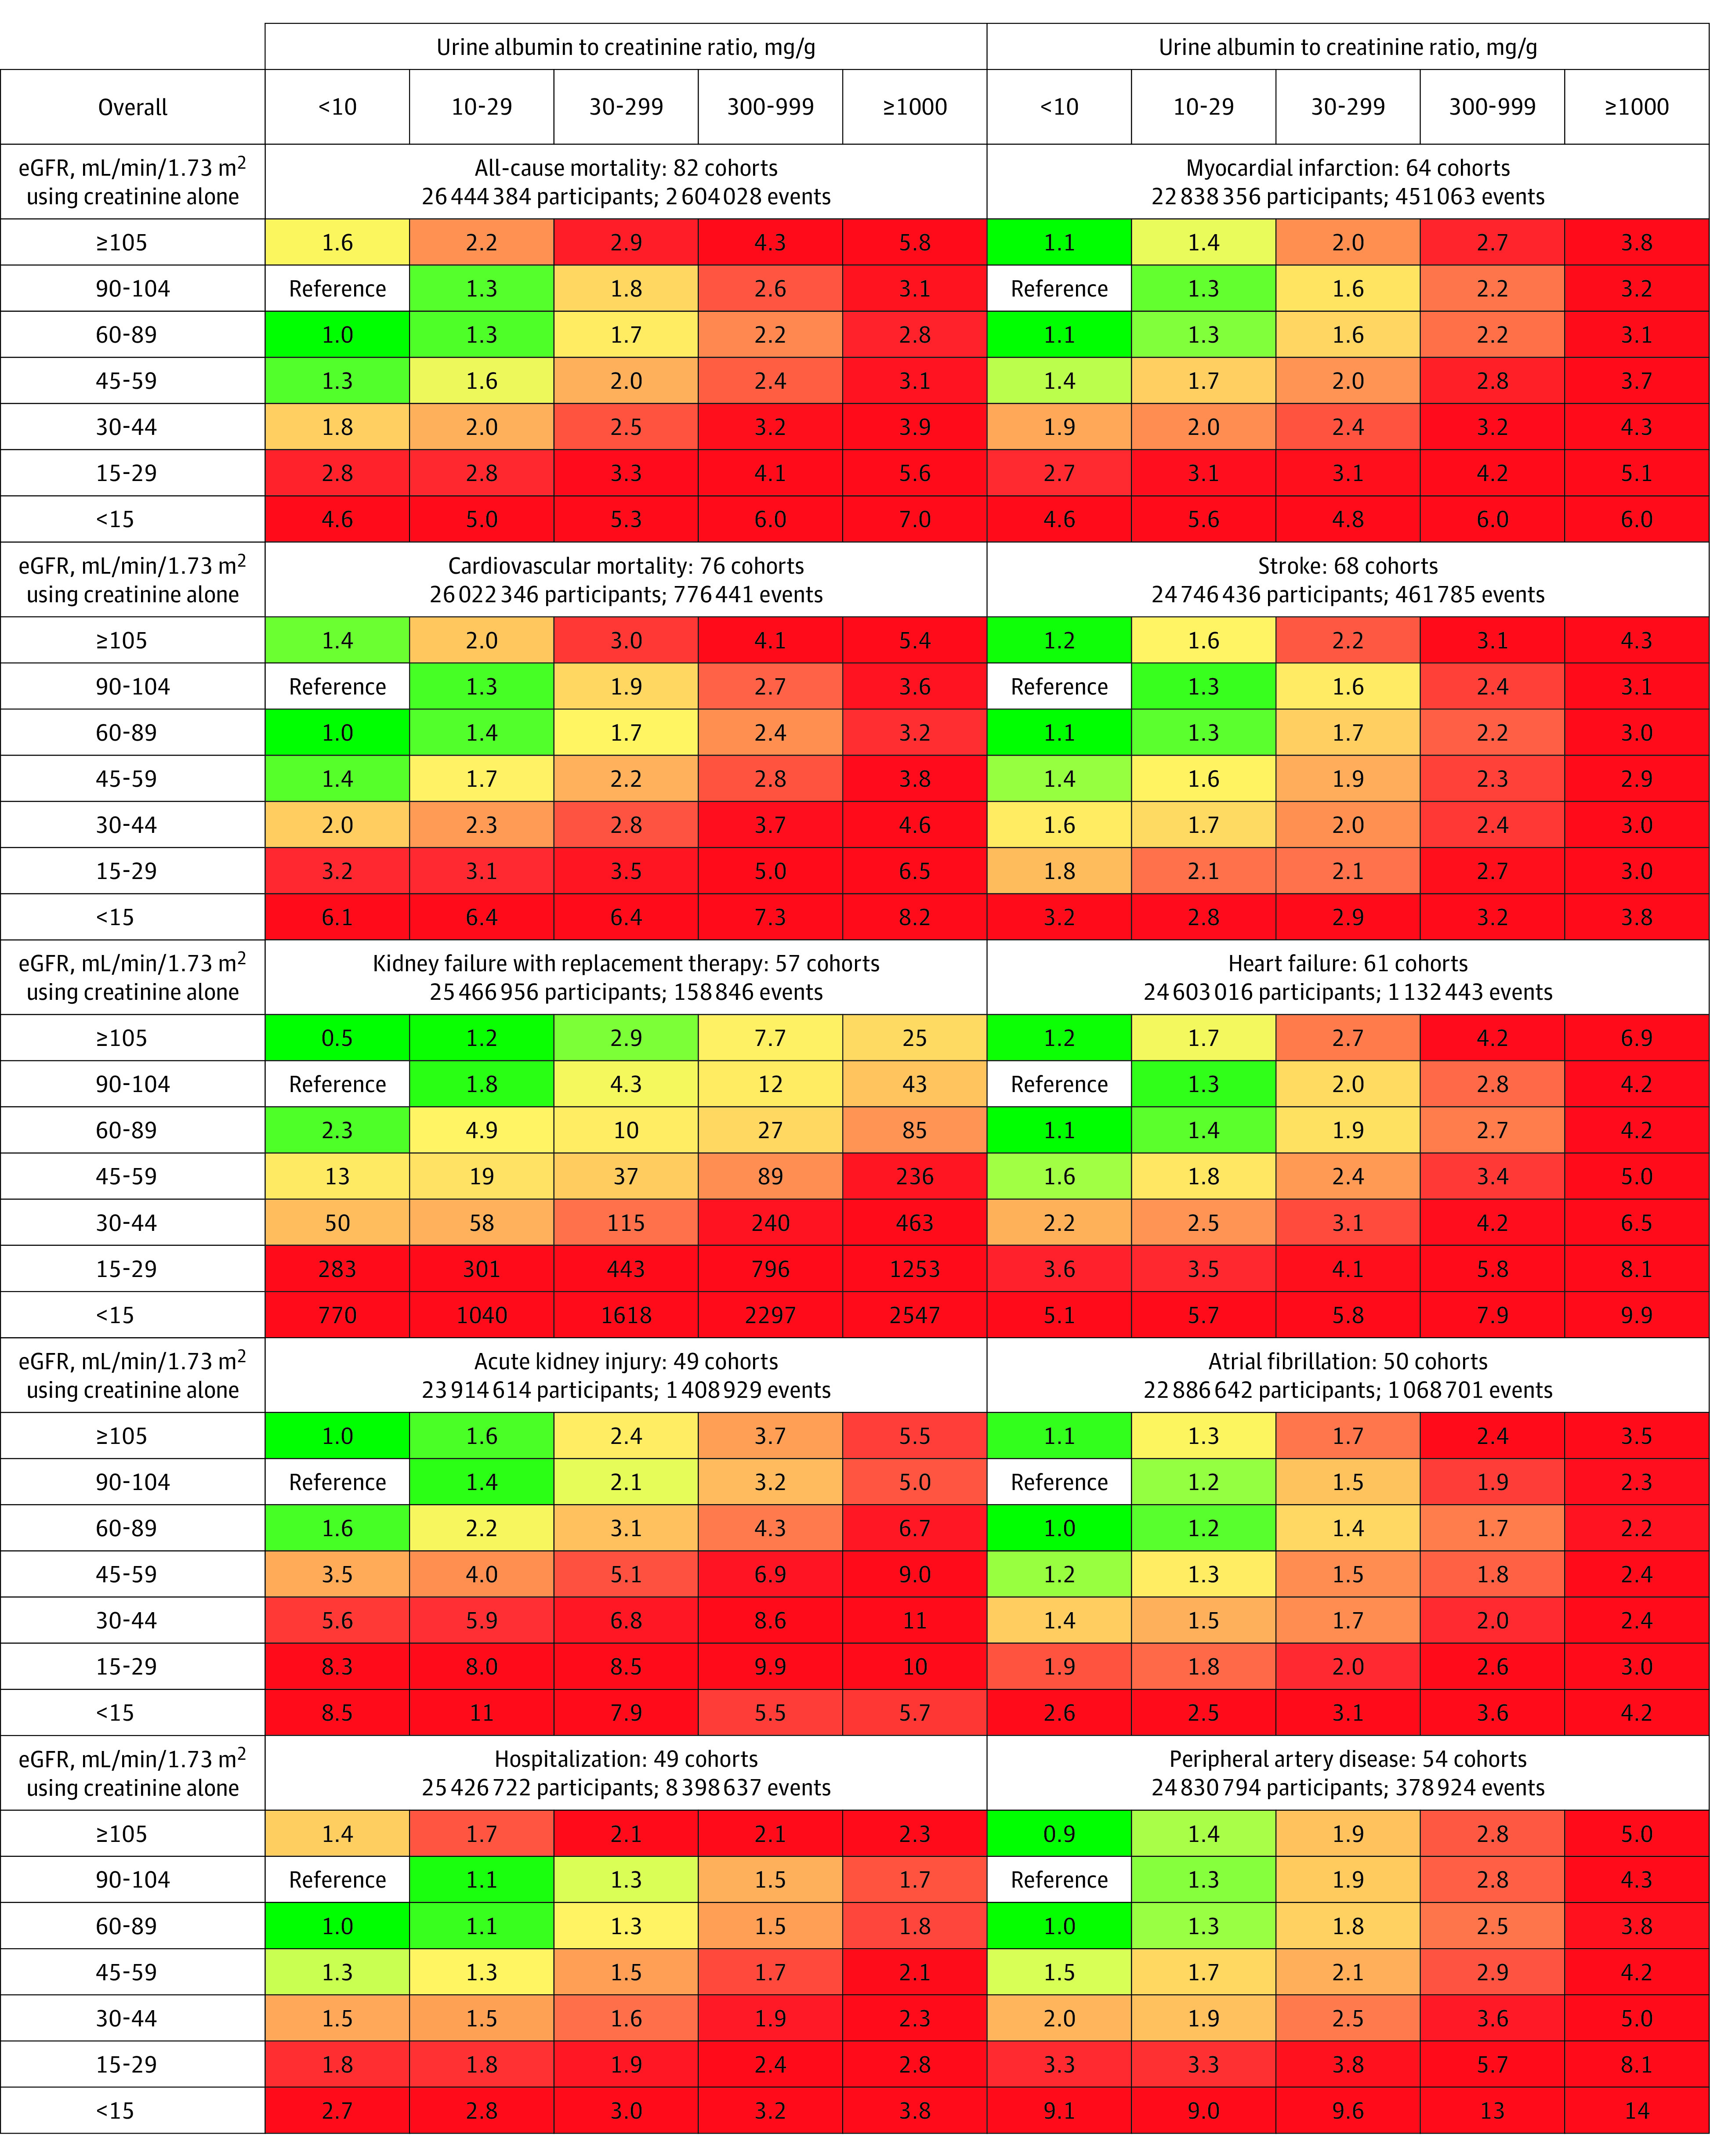
The numbers in the boxes reflect the adjusted hazard ratio vs the reference category. The adjustment variables appear in the legend for Figure 2. The sample sizes include individuals who are missing a measure of albuminuria. The percentile shaded the darkest green color corresponds to the proportion of cells in the grid without chronic kidney disease (eg, 6 of 35 cells with eGFR ≥60 mL/min/1.73 m2 and urine albumin to creatinine ratio <30 mg/g), and the percentile shaded the darkest red color corresponds to the proportion expected to be at the highest risk for adverse outcomes (eg, 11 of 35 cells with eGFR <15 mL/min/1.73 m2 and urine albumin to creatinine ratio ≥1000 mg/g).
Compared with an eGFR of 90 to 104 mL/min/1.73 m2 based on creatinine alone, the CKD category of G3a (an eGFR of 45-59 mL/min/1.73 m2 based on creatinine alone) was significantly associated with higher adjusted HRs for each outcome, even among people with a UACR less than 10 mg/g, a UACR of 10 mg/g to less than 30 mg/g, or in those with missing UACR (Table 2). When stratified by age and sex, the RRs for the CKD category of G3a were smaller among older adults (≥65 years of age) compared with younger adults (<65 years of age) (median difference in log HRs, −0.36 [IQI, −0.49 to −0.27], P < .001); however, all remained statistically significant except for hospitalizations among older adults with missing data for UACR. The RR comparisons between men and women were not significantly different (median difference in log HRs, 0.02 [IQI, −0.04 to 0.07], P = .19; eTable 8 in Supplement 2).
Table 2. Adjusted Hazard Ratios of Subsequent Adverse Outcomes for Individuals With Mild to Moderate Kidney Disease.
| Estimated glomerular filtration rate (eGFR), adjusted hazard ratio (95% CI)a | |||||||
|---|---|---|---|---|---|---|---|
| eGFR based on creatinine alone | eGFR based on creatinine and cystatin C | ||||||
| eGFR of 90-104 mL/min/1.73 m2 and UACR <10 mg/g | eGFR of 45-59 mL/min/1.73 m2 and UACR <10 mg/g | eGFR of 45-59 mL/min/1.73 m2 and UACR of 10-29 mg/g | eGFR of 45-59 mL/min/1.73 m2 and missing UACR | eGFR of 90-104 mL/min/1.73 m2 and UACR <10 mg/g | eGFR of 45-59 mL/min/1.73 m2 and UACR <10 mg/g | eGFR of 45-59 mL/min/1.73 m2 and UACR of 10-29 mg/g | |
| All-cause mortality | 1 [Reference] | 1.3 (1.2-1.4) | 1.6 (1.5-1.7) | 1.6 (1.5-1.7) | 1 [Reference] | 1.7 (1.5-1.8) | 2.2 (2.1-2.3) |
| Cardiovascular mortality | 1 [Reference] | 1.4 (1.3-1.4) | 1.7 (1.5-1.9) | 1.6 (1.4-1.8) | 1 [Reference] | 1.9 (1.6-2.2) | 2.7 (2.4-3.0) |
| Kidney failure with replacement therapy | 1 [Reference] | 12.7 (11.1-14.6) | 19.0 (15.6-23.1) | 17.7 (14.2-22.1) | 1 [Reference] | 5.8 (2.4-14.2) | 12.5 (5.4-29.1) |
| Acute kidney injury | 1 [Reference] | 3.5 (3.3-3.7) | 4.0 (3.7-4.3) | 3.8 (3.5-4.2) | 1 [Reference] | 3.9 (3.5-4.4) | 4.7 (4.2-5.2) |
| Hospitalization | 1 [Reference] | 1.3 (1.2-1.3) | 1.3 (1.3-1.4) | 1.2 (1.2-1.3) | 1 [Reference] | 1.3 (1.1-1.5) | 1.4 (1.1-1.7) |
| Coronary heart disease | 1 [Reference] | 1.4 (1.3-1.5) | 1.7 (1.6-1.8) | 1.6 (1.4-1.8) | 1 [Reference] | 1.6 (1.3-2.0) | 2.0 (1.7-2.3) |
| Stroke | 1 [Reference] | 1.4 (1.3-1.5) | 1.6 (1.5-1.7) | 1.5 (1.4-1.7) | 1 [Reference] | 1.6 (1.4-1.9) | 1.8 (1.5-2.2) |
| Heart failure | 1 [Reference] | 1.6 (1.5-1.7) | 1.8 (1.7-2.0) | 1.9 (1.8-2.1) | 1 [Reference] | 1.5 (1.1-2.1) | 2.2 (1.8-2.8) |
| Atrial fibrillation | 1 [Reference] | 1.2 (1.2-1.3) | 1.3 (1.3-1.4) | 1.4 (1.3-1.5) | 1 [Reference] | 1.3 (1.1-1.5) | 1.6 (1.5-1.9) |
| Peripheral artery disease | 1 [Reference] | 1.5 (1.3-1.6) | 1.8 (1.6-2.0) | 1.9 (1.6-2.1) | 1 [Reference] | 2.5 (1.5-4.2) | 3.7 (2.7-4.9) |
Abbreviation: UACR, urine albumin to creatinine ratio.
The adjustment variables included age, sex, smoking status (current, former, never), systolic blood pressure, total cholesterol, high-density lipoprotein cholesterol, body mass index, use of antihypertensive medications, and a history of diabetes, coronary heart disease, stroke, heart failure, atrial fibrillation, peripheral artery disease, cancer, and chronic obstructive pulmonary disease when relevant. All models appear in eAppendix 1 in Supplement 1. The cohorts used in these analyses are the general population and electronic health record cohorts (the chronic kidney disease cohorts did not have sufficient individuals in the reference groups) and those missing a measure of albuminuria were included. All comparisons yielded P < .001. The number of cohorts appears in Figure 1 and Figure 2 and the cell-specific sample sizes and number of events appear in eTables 6 and 12 in Supplement 2.
In the continuous analyses, the HRs for the spline term for lower eGFR (<60 mL/min/1.73 m2) and an 8-fold higher UACR were highest for kidney failure with replacement therapy (HR for eGFR <60 per 15 mL/min/1.73 m2, 3.89 [95% CI, 3.73-4.06]), and all (for eGFR) or nearly all (for UACR) associations were statistically significant in the individual cohorts (eTable 9 in Supplement 2 and the eFigure in Supplement 1). In the sensitivity analyses excluding albuminuria measured by dipstick, the UACR associations were not statistically different from those when the dipstick measures were included (median difference in log HRs, −0.02 [IQI, −0.02 to −0.004], P = .06; eTable 10 in Supplement 2). The HRs by subgroup of age, sex, diabetes, and cardiovascular disease appear in eTable 11 in Supplement 2.
Analyses According to eGFR Based on Creatinine and Cystatin C and UACR
In the categorical analyses of eGFR based on creatinine and cystatin C, compared with the reference category of 90 to 104 mL/min/1.73 m2, the eGFR categories below 60 mL/min/1.73 m2 were significantly associated with higher risk for each outcome. Compared with the UACR reference category of less than 10 mg/g, higher UACR categories were associated with higher rates for each outcome (Figure 2 and eTable 12 in Supplement 2). Associations remained statistically significant in subset analyses by age and sex; there were weaker RRs in older adults (≥65 years of age) compared with younger adults (<65 years of age) (median difference in log HRs, −0.14 [IQI, −0.36 to 0.03], P < .001), but not in women compared with men (median difference in log HRs, −0.002 [IQI, −0.10 to 0.11], P = .53; eTable 13 in Supplement 2).
Figure 2. Categorical Analysis of the Associations of Estimated Glomerular Filtration Rate (eGFR) and Albuminuria With Subsequent Adverse Outcomes in the Population Based on Creatinine and Cystatin C.

The numbers in the boxes reflect the adjusted hazard ratio compared with the reference category. The adjustment variables included age, sex, smoking status (current, former, never), systolic blood pressure, total cholesterol, high-density lipoprotein cholesterol, body mass index, use of antihypertensive medications, and a history of diabetes, coronary heart disease, stroke, heart failure, atrial fibrillation, peripheral artery disease, cancer, and chronic obstructive pulmonary disease when relevant. The cohorts used in these analyses are the general population and electronic health record cohorts (the chronic kidney disease [CKD] cohorts did not have sufficient individuals in the reference cells). The sample sizes include individuals who are missing a measure of albuminuria. The percentile shaded the darkest green color corresponds to the proportion of cells in the grid without CKD (eg, 6 of 24 cells), and the percentile shaded the darkest red color corresponds to the proportion expected to be at the highest risk for adverse outcomes (eg, 5 of 24 cells).
The differences in the adjusted HRs for eGFR based on creatinine and cystatin C between the older and younger age groups were smaller than those seen with eGFR based on creatinine alone (median difference in differences, −0.16 [IQI, −0.34 to −0.01], P < .001; eTable 13 in Supplement 2). The risk for all outcomes was increased in the CKD category of G3a (eGFR category of 45-59 mL/min/1.73 m2 based on creatinine and cystatin C) even among people with a UACR less than 10 mg/g, and these risks remained statistically significant in the subset analyses by age and sex (eTable 14 in Supplement 2). Compared with the analyses using eGFR based on creatinine alone, the risk associations with eGFR based on creatinine and cystatin C were stronger and less U-shaped (median difference in log HRs, 0.10 [IQI, 0.02 to 0.21], P < .001; Figure 3).
Figure 3. Hazard Ratios for Adverse Outcomes Using a Continuous Model of Estimated Glomerular Filtration Rate (eGFR).
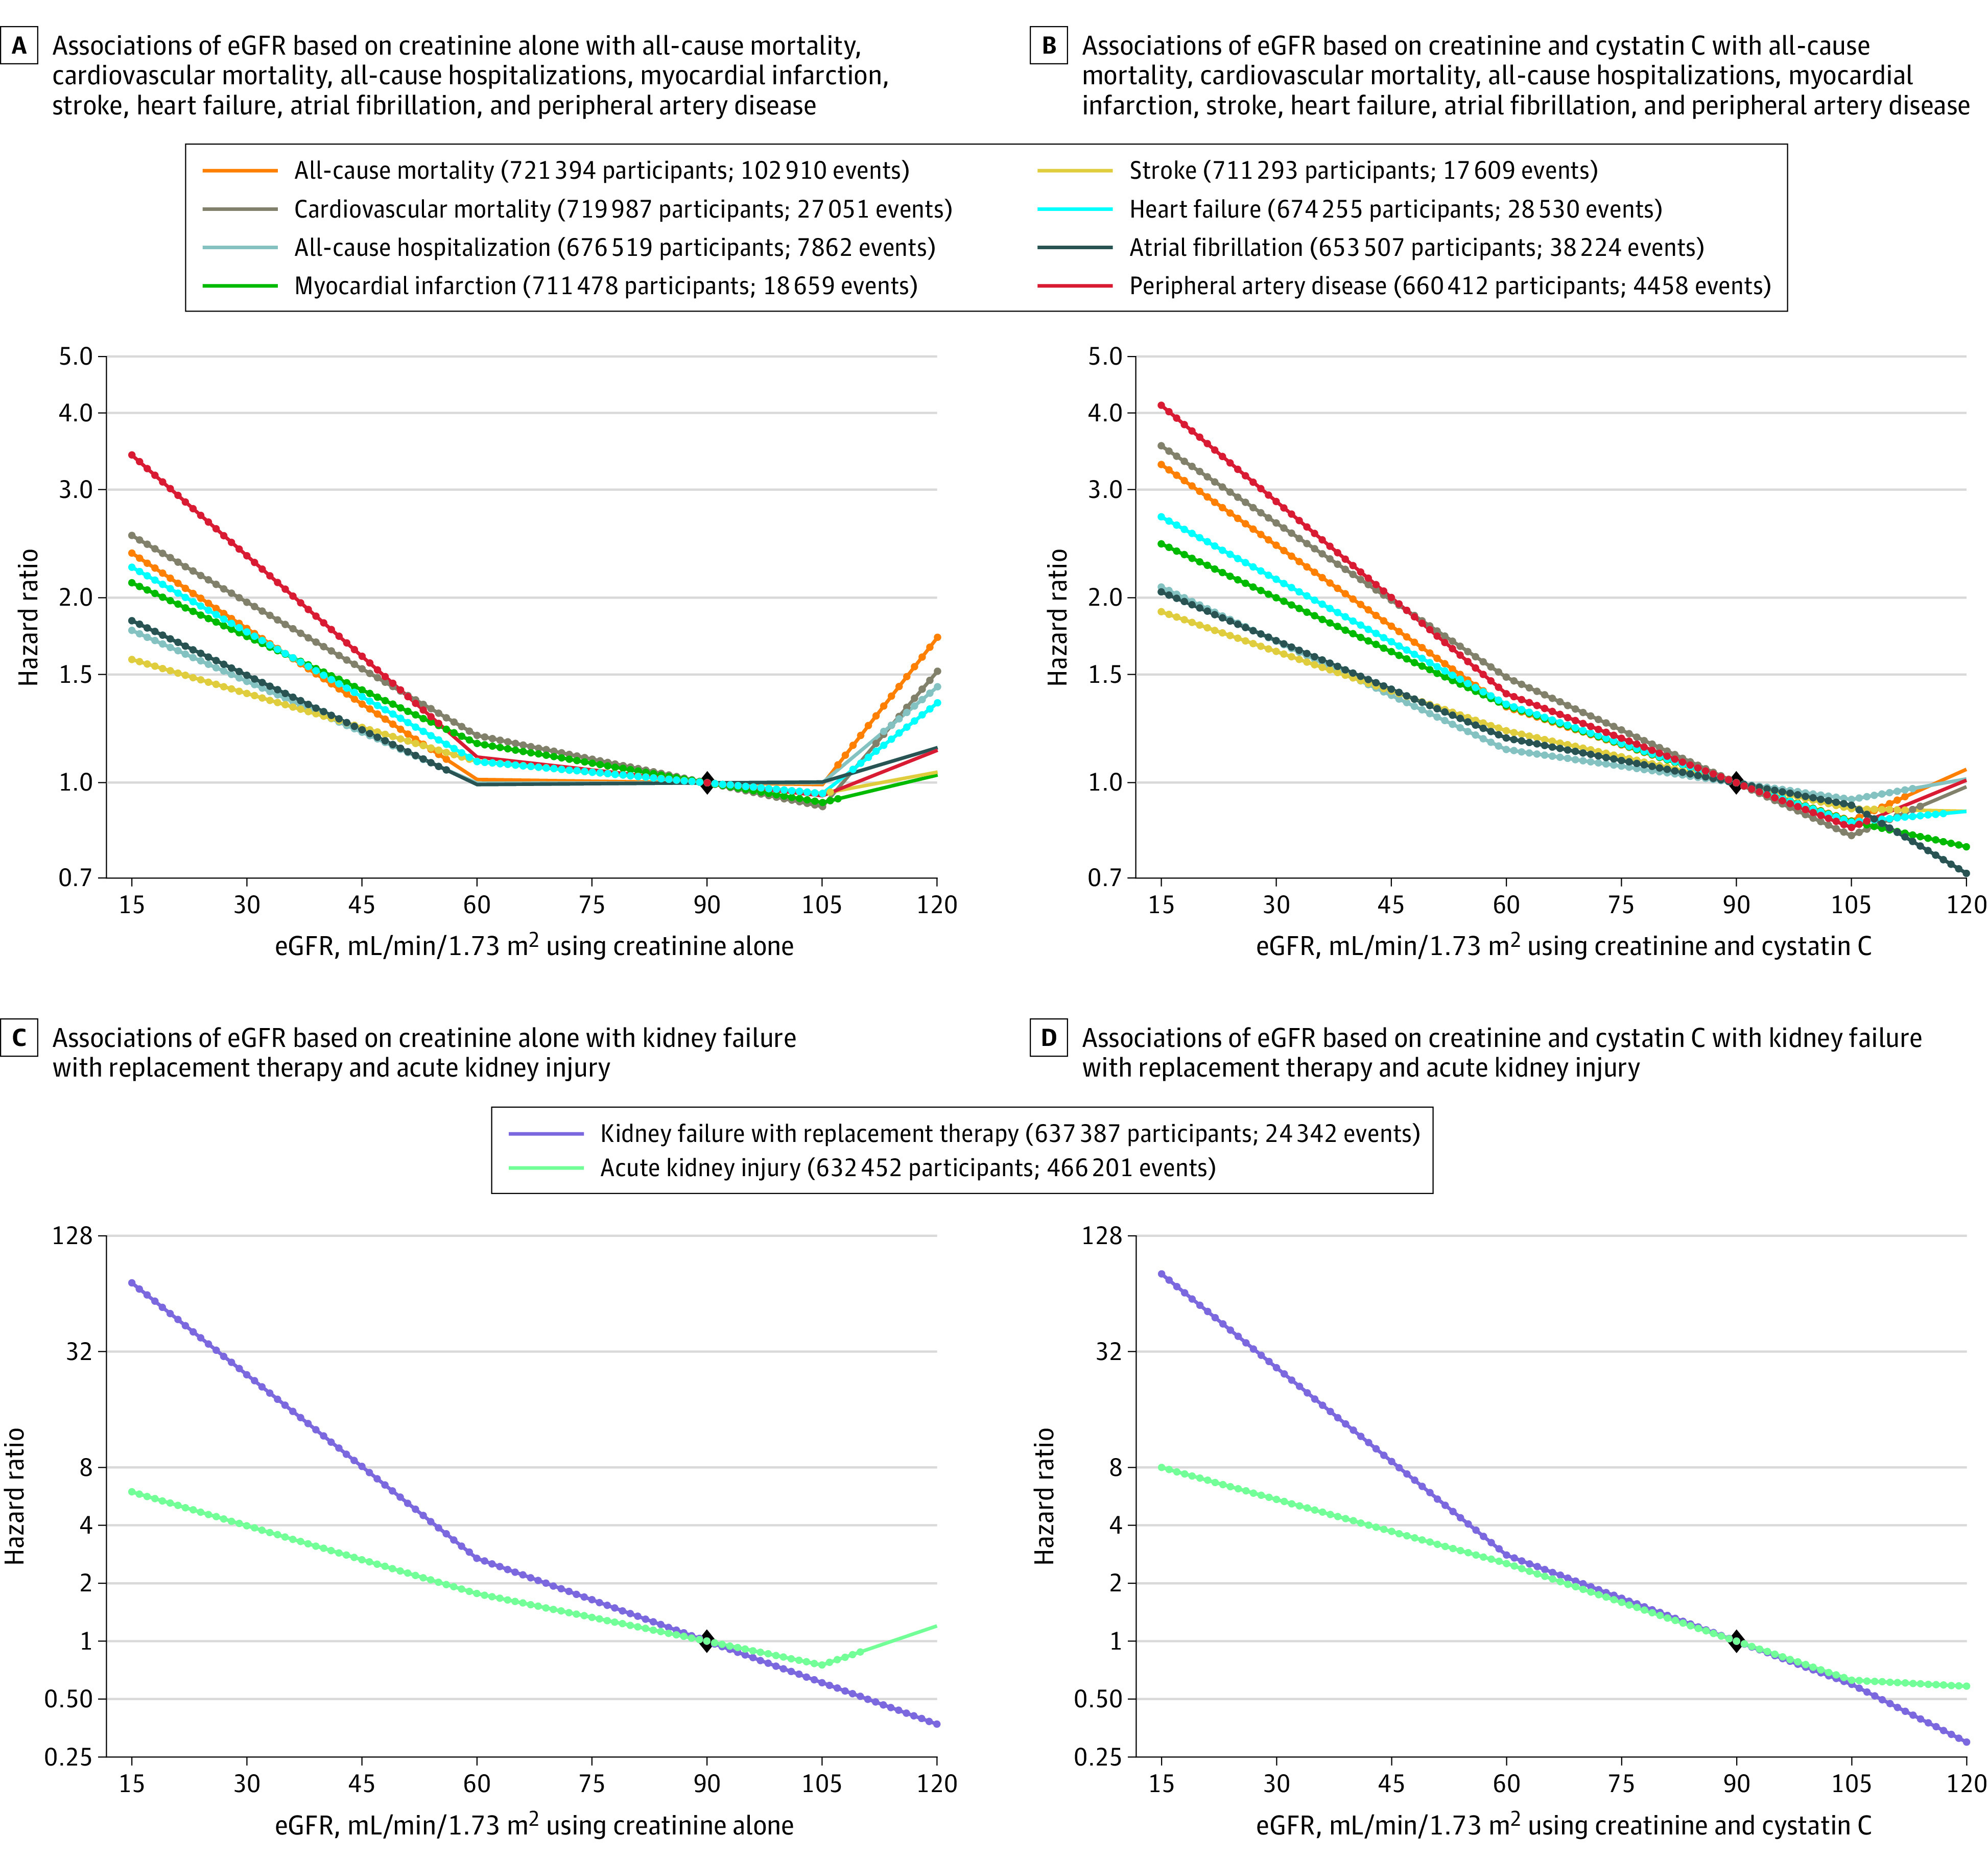
The diamond indicates the reference point at eGFR of 90 mL/min/1.73 m2. The dots indicate that the 95% CI for the hazard ratio from this spline model does not include 1.0.
Associations with alternative estimating equations for GFR appear in eTable 15 in Supplement 2. The alternative estimating equations were highly correlated with eGFR using the CKD-EPI 2021 equation in all cohorts (range of Pearson correlation coefficients, 0.98-1.00 for eGFR based on creatinine alone using the CKD-EPI 2021 and EKFC equations; range of Pearson correlation coefficients, 0.93-0.99 for eGFR based on creatinine and cystatin C using the CKD-EPI 2021 and EKFC equations; range of Pearson correlation coefficients, 0.99-1.00 for eGFR based on creatinine alone using the CKD-EPI 2021 and CKD-EPI 2009 NB equations; and range of Pearson correlation coefficients, 0.996-1.00 for eGFR based on creatinine and cystatin C using the CKD-EPI 2021 and CKD-EPI 2012 NB equations).
Prevalence of CKD and Incidence of Adverse Outcomes
Of the included individuals in the cohorts from the Optum Labs Data Warehouse, 63% were missing a measure of albuminuria (including dipstick measures). The prevalence of each category of eGFR based on creatinine alone was similar with and without the inclusion of those missing a measure of albuminuria. For example, the prevalence of eGFR less than 60 mL/min/1.73 m2 (based on creatinine alone) was 9.6% when individuals missing a measure of albuminuria were included and was 10% when those missing a measure of albuminuria were excluded. Among those with measures of albuminuria, the prevalence of the UACR category of 30 to 299 mg/g (category A2) was 9.9%, 3.1% had the UACR category of 300 to 999 mg/g, and 1.2% had the UACR category of 1000 mg/g or greater (eTable 16 in Supplement 2).
The unadjusted incidence rate for each adverse outcome was higher with more severe categories of eGFR and UACR. Hospitalizations were the most common adverse outcome. In the reference group (eGFR 90-104 mL/min/1.73 m2 and UACR <10 mg/g), the rate of hospitalizations was 79 per 1000 person-years, the rate for all-cause mortality was 11 per 1000 person-years, the rate for acute kidney injury was 4.5 per 1000 person-years, the rate for atrial fibrillation was 4.0 per 1000 person-years, the rate for heart failure was 3.9 per 1000 person-years, the rate for cardiovascular mortality was 2.3 per 1000 person-years, the rate for stroke was 2.1 per 1000 person-years, the rate for myocardial infarction was 1.7 per 1000 person-years, the rate for peripheral artery disease was 0.6 per 1000 person-years, and the rate for kidney failure with replacement therapy was 0.1 per 1000 person-years (eTable 17 in Supplement 2).
Among people with a UACR less than 10 mg/g, an eGFR of 45 to 59 mL/min/1.73 m2 based on creatinine alone was associated with significantly higher hospitalization rates compared with an eGFR of 90 to 104 mL/min/1.73 m2 (adjusted HR, 1.3 [95% CI, 1.2-1.3]; 161 vs 79 events per 1000 person-years; excess absolute risk, 22 events per 1000 person-years [95% CI, 19-25 events per 1000 person-years]). For the most severe CKD categories (eGFR <15 mL/min/1.73 m2 and UACR ≥1000 mg/g), the highest rates of adverse outcomes were for hospitalizations (562 per 1000 person-years), kidney failure with replacement therapy (325 per 1000 person-years), and mortality (148 per 1000 person-years). The adjusted excess mortality appears in eTable 18 in Supplement 2. The unadjusted incidence rates by age and sex appear in eTables 19-22 in Supplement 2.
Discussion
This individual-participant data meta-analysis of more than 27 million adults evaluated associations of eGFR and albuminuria with 10 adverse outcomes that included kidney outcomes, all-cause mortality, cardiovascular mortality, hospitalizations, and other cardiovascular events. There were strong graded associations with lower eGFR and adverse outcomes for the new, race-free 2021 CKD-EPI equation for eGFR based on creatinine alone7 and also when cystatin C was included as an additional filtration marker in eGFR (based on creatinine and cystatin C). The pattern of associations persisted irrespective of age, sex, diabetes, and cardiovascular disease and were stronger for eGFR based on creatinine and cystatin C compared with eGFR based on creatinine alone. This work supports recent recommendations to increase the use of cystatin C in clinical practice.17,18
Prior meta-analyses of eGFR and albuminuria with adverse outcomes evaluated only 5 adverse outcomes in 1.2 million individuals within 21 cohorts from 14 countries.2,3,4,5,6 These reports used eGFR based on creatinine alone; the Modification of Diet in Renal Disease study equation, which includes race; and an unvalidated equation to impute UACR from the ratio of urine protein to creatinine. In the current study, eGFR was calculated using the race-free estimating equations for both eGFR based on creatinine alone and eGFR based on creatinine and cystatin C per 2021 recommendations from the National Kidney Foundation and the American Society of Nephrology.17,18 The UACR was imputed from the ratio of urine protein to creatinine or the urine dipstick protein using a validated equation.12,19 The current study adds to the literature by providing strong evidence for the classification and risk stratification of CKD using the most up-to-date estimates of GFR, more categories of albuminuria, and additional cardiovascular outcomes. The use of 114 cohorts from across the world enhances the generalizability of the results.
The results underscore the importance of albuminuria in risk assessment. Even mildly elevated UACR (category A2; UACR of 30-299 mg/g) was statistically significantly associated with increased risk for all outcomes. The adjusted excess risk of mortality associated with a UACR of 300 to 999 mg/g and an eGFR of 90 to 104 mL/min/1.73 m2 was comparable with that of stage 1 colon cancer (17 deaths per 1000 person-years and a 5-year survival rate of 91%).20 Similar to previous observations,21 the current study demonstrates low rates of albuminuria measurement in electronic health records.
Some guidelines recommend cystatin C testing in patients with CKD, and others discourage measurement of cystatin C.2,22 The current study provides evidence for the potential utility of eGFR based on creatinine and cystatin C. With eGFR based on creatinine alone, there was a U-shaped association with the study outcomes, indicating a higher risk with both lower eGFR (<60 mL/min/1.73 m2) and higher eGFR (>105 mL/min/1.73 m2). This finding may indicate imprecision and systematic overestimation of GFR among people who progress to adverse events (thus contributing to the U-shaped curve). There was a more linear risk relationship for eGFR when based on both creatinine and cystatin C.
Both creatinine and cystatin C values are affected by clinical characteristics independent of GFR,23 and the most widely recognized non-GFR determinant for creatinine is muscle mass.24 Persons with low muscle mass, on average, have higher eGFR based on creatinine alone than eGFR based on creatinine and cystatin C.25 Differences in RRs between eGFR based on creatinine alone and eGFR based on creatinine and cystatin C were observed among older adults (≥65 years of age), suggesting that when clinically available, additional use of cystatin C could better identify high-risk individuals, particularly among older populations.
This study has several strengths. First, the sample size was large and included adults from multiple countries. Second, the most recent eGFR equations were evaluated. Third, the results suggested that deviations in risk associations across type, geographic location, and cohort characteristics were unlikely. Fourth, the subgroup analyses demonstrated the higher risk for adverse outcomes associated with lower eGFR and higher UACR across categories of age, sex, presence of diabetes, and history of cardiovascular disease.
Limitations
This study has several limitations. First, other estimating equations of GFR were not comprehensively tested.14,16 Second, the included cohorts used different study designs and protocols for outcome ascertainment. The outcomes were often based on International Classification of Diseases codes, which have variable sensitivity and specificity for each outcome measure.
Third, cystatin C was available in only a subset of cohorts. Fourth, the data used in the analyses were observational and causal inferences should not be made.26 Fifth, although the findings support the use of eGFR based on creatinine and cystatin C in the detection and staging of CKD, cystatin C is not widely available and may be expensive to routinely measure. Sixth, some variables such as baseline heart failure were missing from several cohorts and may have confounded the relationship between eGFR and the outcomes, particularly for acute kidney injury.
Conclusions
In this retrospective analysis of 114 cohorts, lower eGFR based on creatinine alone, lower eGFR based on creatinine and cystatin C, and more severe UACR were each associated with increased rates of 10 adverse outcomes, including adverse kidney outcomes, cardiovascular diseases, and hospitalizations.
eAppendix 1. Data analysis overview and analytic notes for some individual cohorts
eAppendix 2. Acronyms or abbreviations for cohorts included in the current study, investigators by cohort, and members of the CKD-PC steering committee and data coordinating center
eAppendix 3. Acknowledgements and funding for collaborating cohorts
eFigure. Forest plot of hazard ratios associated with kidney failure with replacement therapy, stratified into general population cohorts, electronic health record cohorts, and CKD cohorts: from the continuous model: eGFR (first panel) and albuminuria (second panel)
eReferences
eTable 1. Percent missing for each variable by cohort, eGFRcr population
eTable 2. Incidence rates for each outcome by cohort, eGFRcr population
eTable 3. Participant characteristics by cohort, eGFRcr population
eTable 4. Participant characteristics by cohort, eGFRcr-cys population
eTable 5. Incidence rates for each outcome by cohort, eGFRcr-cys population
eTable 6. Categorical analyses including missing albuminuria category, confidence intervals, and numbers of participants/events: eGFRcr population
eTable 7. Categorical analyses by age and sex, eGFRcr population
eTable 8. Associations with adverse outcomes within CKD category G3a for ACR <10 mg/g, ACR 10-29 mg/g, and missing ACR, eGFRcr population, stratified by age and sex
eTable 9. Associations with adverse outcomes using all cohorts and a continuous model for eGFR and albuminuria: eGFRcr population and eGFRcr-cys population, including N/n
eTable 10. Associations with adverse outcomes associated with albuminuria, comparison of risks with and without inclusion of dipstick proteinuria measures in the continuous model, eGFRcr population
eTable 11. Associations with adverse outcomes using all cohorts and a continuous model for eGFR and albuminuria by subgroups of age, sex, diabetes, and cardiovascular disease: eGFRcr population
eTable 12. Categorical analyses: numbers of participants/events, eGFRcr-cys population
eTable 13. Categorical analyses by age and sex: eGFRcr-cys population
eTable 14. Associations of adverse outcomes within CKD category G3a for ACR <10 mg/g and ACR 10-29 mg/g, stratified by age and sex: eGFRcr-cys population
eTable 15. Hazard ratios for adverse outcomes using the continuous model of eGFR and eGFRcr-cys, using different estimating equations in the population with cystatin C: eGFRcr-cys population
eTable 16. Prevalence of G- (eGFRcr) and A category in a US electronic health record database, with and without inclusion of people missing albuminuria
eTable 17. Incidence of adverse outcomes by G- (eGFRcr) and A category in a US electronic health record database, median cohort per 1000 person-years (25th and 75th percentile cohorts)
eTable 18. Adjusted excess incidence of adverse outcomes by G- (eGFRcr) and A category in a US electronic health record database, mean (95% CI)
eTable 19. Incidence of adverse outcomes in the population <65 years by G- (eGFRcr) and A category in a US electronic health record database, median cohort per 1000 person-years (25th and 75th percentile cohorts)
eTable 20. Incidence of adverse outcomes in people 65 years and older by G- (eGFRcr) and A category in a US electronic health record database, median cohort per 1000 person-years (25th and 75th percentile cohorts)
eTable 21. Incidence of adverse outcomes in men by G- (eGFRcr) and A category in a US electronic health record database, median cohort per 1000 person-years (25th and 75th percentile cohorts)
eTable 22. Incidence of adverse outcomes in women by G- (eGFRcr) and A category in a US electronic health record database, median cohort per 1000 person-years (25th and 75th percentile cohorts)
Nonauthor collaborators
Data sharing statement
References
- 1.GBD Chronic Kidney Disease Collaboration . Global, regional, and national burden of chronic kidney disease, 1990-2017: a systematic analysis for the Global Burden of Disease Study 2017. Lancet. 2020;395(10225):709-733. doi: 10.1016/S0140-6736(20)30045-3 [DOI] [PMC free article] [PubMed] [Google Scholar]
- 2.Kidney Disease: Improving Global Outcomes (KDIGO) CKD Work Group . KDIGO 2012 clinical practice guideline for the evaluation and management of chronic kidney disease. Kidney Int Suppl. 2013;3(1):1-150. [Google Scholar]
- 3.Levey AS, de Jong PE, Coresh J, et al. The definition, classification, and prognosis of chronic kidney disease: a KDIGO controversies conference report. Kidney Int. 2011;80(1):17-28. doi: 10.1038/ki.2010.483 [DOI] [PubMed] [Google Scholar]
- 4.Astor BC, Matsushita K, Gansevoort RT, et al. ; Chronic Kidney Disease Prognosis Consortium . Lower estimated glomerular filtration rate and higher albuminuria are associated with mortality and end-stage renal disease: a collaborative meta-analysis of kidney disease population cohorts. Kidney Int. 2011;79(12):1331-1340. doi: 10.1038/ki.2010.550 [DOI] [PMC free article] [PubMed] [Google Scholar]
- 5.Gansevoort RT, Matsushita K, van der Velde M, et al. ; Chronic Kidney Disease Prognosis Consortium . Lower estimated GFR and higher albuminuria are associated with adverse kidney outcomes: a collaborative meta-analysis of general and high-risk population cohorts. Kidney Int. 2011;80(1):93-104. doi: 10.1038/ki.2010.531 [DOI] [PMC free article] [PubMed] [Google Scholar]
- 6.van der Velde M, Matsushita K, Coresh J, et al. ; Chronic Kidney Disease Prognosis Consortium . Lower estimated glomerular filtration rate and higher albuminuria are associated with all-cause and cardiovascular mortality: a collaborative meta-analysis of high-risk population cohorts. Kidney Int. 2011;79(12):1341-1352. doi: 10.1038/ki.2010.536 [DOI] [PubMed] [Google Scholar]
- 7.Inker LA, Eneanya ND, Coresh J, et al. ; Chronic Kidney Disease Epidemiology Collaboration . New creatinine- and cystatin C-based equations to estimate GFR without race. N Engl J Med. 2021;385(19):1737-1749. doi: 10.1056/NEJMoa2102953 [DOI] [PMC free article] [PubMed] [Google Scholar]
- 8.OptumLabs . OptumLabs and OptumLabs Data Warehouse: Descriptions and Citation. OptumLabs; 2020. [Google Scholar]
- 9.Coresh J, Astor BC, McQuillan G, et al. Calibration and random variation of the serum creatinine assay as critical elements of using equations to estimate glomerular filtration rate. Am J Kidney Dis. 2002;39(5):920-929. doi: 10.1053/ajkd.2002.32765 [DOI] [PubMed] [Google Scholar]
- 10.Grubb A, Blirup-Jensen S, Lindström V, Schmidt C, Althaus H, Zegers I; IFCC Working Group on Standardisation of Cystatin C (WG-SCC) . First certified reference material for cystatin C in human serum ERM-DA471/IFCC. Clin Chem Lab Med. 2010;48(11):1619-1621. doi: 10.1515/CCLM.2010.318 [DOI] [PubMed] [Google Scholar]
- 11.NIST . Development of reference measurement procedures and reference materials for creatinine. Published March 29, 2009; updated June 2, 2021. Accessed March 6, 2023. https://www.nist.gov/programs-projects/development-reference-measurement-procedures-and-reference-materials-creatinine
- 12.Sumida K, Nadkarni GN, Grams ME, et al. ; Chronic Kidney Disease Prognosis Consortium . Conversion of urine protein-creatinine ratio or urine dipstick protein to urine albumin-creatinine ratio for use in chronic kidney disease screening and prognosis: an individual participant-based meta-analysis. Ann Intern Med. 2020;173(6):426-435. doi: 10.7326/M20-0529 [DOI] [PMC free article] [PubMed] [Google Scholar]
- 13.US Renal Data System . 2021 USRDS Annual Data Report: Epidemiology of Kidney Disease in the United States. National Institutes of Health, National Institute of Diabetes and Digestive and Kidney Diseases; 2021. [Google Scholar]
- 14.Levey AS, Stevens LA, Schmid CH, et al. ; CKD-EPI (Chronic Kidney Disease Epidemiology Collaboration) . A new equation to estimate glomerular filtration rate. Ann Intern Med. 2009;150(9):604-612. doi: 10.7326/0003-4819-150-9-200905050-00006 [DOI] [PMC free article] [PubMed] [Google Scholar]
- 15.Inker LA, Schmid CH, Tighiouart H, et al. ; CKD-EPI Investigators . Estimating glomerular filtration rate from serum creatinine and cystatin C. N Engl J Med. 2012;367(1):20-29. doi: 10.1056/NEJMoa1114248 [DOI] [PMC free article] [PubMed] [Google Scholar]
- 16.Pottel H, Björk J, Rule AD, et al. Cystatin C-based equation to estimate GFR without the inclusion of race and sex. N Engl J Med. 2023;388(4):333-343. doi: 10.1056/NEJMoa2203769 [DOI] [PubMed] [Google Scholar]
- 17.Delgado C, Baweja M, Crews DC, et al. A unifying approach for GFR estimation: recommendations of the NKF-ASN task force on reassessing the inclusion of race in diagnosing kidney disease. Am J Kidney Dis. 2022;79(2):268-288.e1. doi: 10.1053/j.ajkd.2021.08.003 [DOI] [PubMed] [Google Scholar]
- 18.Delgado C, Baweja M, Crews DC, et al. A unifying approach for GFR estimation: recommendations of the NKF-ASN task force on reassessing the inclusion of race in diagnosing kidney disease. J Am Soc Nephrol. 2021;32(12):2994-3015. doi: 10.1681/ASN.2021070988 [DOI] [PMC free article] [PubMed] [Google Scholar]
- 19.Résimont G, Vranken L, Pottel H, et al. Estimating urine albumin to creatinine ratio from protein to creatinine ratio using same day measurement: validation of equations. Clin Chem Lab Med. 2022;60(7):1064-1072. doi: 10.1515/cclm-2022-0049 [DOI] [PubMed] [Google Scholar]
- 20.American Cancer Society medical and editorial content team . Survival rates for colorectal cancer. Accessed June 9, 2023. https://www.cancer.org/cancer/types/colon-rectal-cancer/detection-diagnosis-staging/survival-rates.html
- 21.Shin JI, Chang AR, Grams ME, et al. ; CKD Prognosis Consortium . Albuminuria testing in hypertension and diabetes: an individual-participant data meta-analysis in a global consortium. Hypertension. 2021;78(4):1042-1052. doi: 10.1161/HYPERTENSIONAHA.121.17323 [DOI] [PMC free article] [PubMed] [Google Scholar]
- 22.National Institute for Health and Care Excellence . Chronic Kidney Disease: Assessment and Management—National Institute for Health and Care Excellence Guidelines. National Institute for Health and Care Excellence; 2021. [Google Scholar]
- 23.Porrini E, Ruggenenti P, Luis-Lima S, et al. Estimated GFR: time for a critical appraisal. Nat Rev Nephrol. 2019;15(3):177-190. doi: 10.1038/s41581-018-0080-9 [DOI] [PubMed] [Google Scholar]
- 24.Nankivell BJ, Nankivell LFJ, Elder GJ, Gruenewald SM. How unmeasured muscle mass affects estimated GFR and diagnostic inaccuracy. EClinicalMedicine. 2020;29-30:100662. doi: 10.1016/j.eclinm.2020.100662 [DOI] [PMC free article] [PubMed] [Google Scholar]
- 25.Ballew SH, Chen Y, Daya NR, et al. Frailty, kidney function, and polypharmacy: the Atherosclerosis Risk in Communities (ARIC) Study. Am J Kidney Dis. 2017;69(2):228-236. doi: 10.1053/j.ajkd.2016.08.034 [DOI] [PMC free article] [PubMed] [Google Scholar]
- 26.Levey AS, Grams ME, Inker LA. Uses of GFR and albuminuria level in acute and chronic kidney disease. N Engl J Med. 2022;386(22):2120-2128. doi: 10.1056/NEJMra2201153 [DOI] [PubMed] [Google Scholar]
Associated Data
This section collects any data citations, data availability statements, or supplementary materials included in this article.
Supplementary Materials
eAppendix 1. Data analysis overview and analytic notes for some individual cohorts
eAppendix 2. Acronyms or abbreviations for cohorts included in the current study, investigators by cohort, and members of the CKD-PC steering committee and data coordinating center
eAppendix 3. Acknowledgements and funding for collaborating cohorts
eFigure. Forest plot of hazard ratios associated with kidney failure with replacement therapy, stratified into general population cohorts, electronic health record cohorts, and CKD cohorts: from the continuous model: eGFR (first panel) and albuminuria (second panel)
eReferences
eTable 1. Percent missing for each variable by cohort, eGFRcr population
eTable 2. Incidence rates for each outcome by cohort, eGFRcr population
eTable 3. Participant characteristics by cohort, eGFRcr population
eTable 4. Participant characteristics by cohort, eGFRcr-cys population
eTable 5. Incidence rates for each outcome by cohort, eGFRcr-cys population
eTable 6. Categorical analyses including missing albuminuria category, confidence intervals, and numbers of participants/events: eGFRcr population
eTable 7. Categorical analyses by age and sex, eGFRcr population
eTable 8. Associations with adverse outcomes within CKD category G3a for ACR <10 mg/g, ACR 10-29 mg/g, and missing ACR, eGFRcr population, stratified by age and sex
eTable 9. Associations with adverse outcomes using all cohorts and a continuous model for eGFR and albuminuria: eGFRcr population and eGFRcr-cys population, including N/n
eTable 10. Associations with adverse outcomes associated with albuminuria, comparison of risks with and without inclusion of dipstick proteinuria measures in the continuous model, eGFRcr population
eTable 11. Associations with adverse outcomes using all cohorts and a continuous model for eGFR and albuminuria by subgroups of age, sex, diabetes, and cardiovascular disease: eGFRcr population
eTable 12. Categorical analyses: numbers of participants/events, eGFRcr-cys population
eTable 13. Categorical analyses by age and sex: eGFRcr-cys population
eTable 14. Associations of adverse outcomes within CKD category G3a for ACR <10 mg/g and ACR 10-29 mg/g, stratified by age and sex: eGFRcr-cys population
eTable 15. Hazard ratios for adverse outcomes using the continuous model of eGFR and eGFRcr-cys, using different estimating equations in the population with cystatin C: eGFRcr-cys population
eTable 16. Prevalence of G- (eGFRcr) and A category in a US electronic health record database, with and without inclusion of people missing albuminuria
eTable 17. Incidence of adverse outcomes by G- (eGFRcr) and A category in a US electronic health record database, median cohort per 1000 person-years (25th and 75th percentile cohorts)
eTable 18. Adjusted excess incidence of adverse outcomes by G- (eGFRcr) and A category in a US electronic health record database, mean (95% CI)
eTable 19. Incidence of adverse outcomes in the population <65 years by G- (eGFRcr) and A category in a US electronic health record database, median cohort per 1000 person-years (25th and 75th percentile cohorts)
eTable 20. Incidence of adverse outcomes in people 65 years and older by G- (eGFRcr) and A category in a US electronic health record database, median cohort per 1000 person-years (25th and 75th percentile cohorts)
eTable 21. Incidence of adverse outcomes in men by G- (eGFRcr) and A category in a US electronic health record database, median cohort per 1000 person-years (25th and 75th percentile cohorts)
eTable 22. Incidence of adverse outcomes in women by G- (eGFRcr) and A category in a US electronic health record database, median cohort per 1000 person-years (25th and 75th percentile cohorts)
Nonauthor collaborators
Data sharing statement