

Abstract
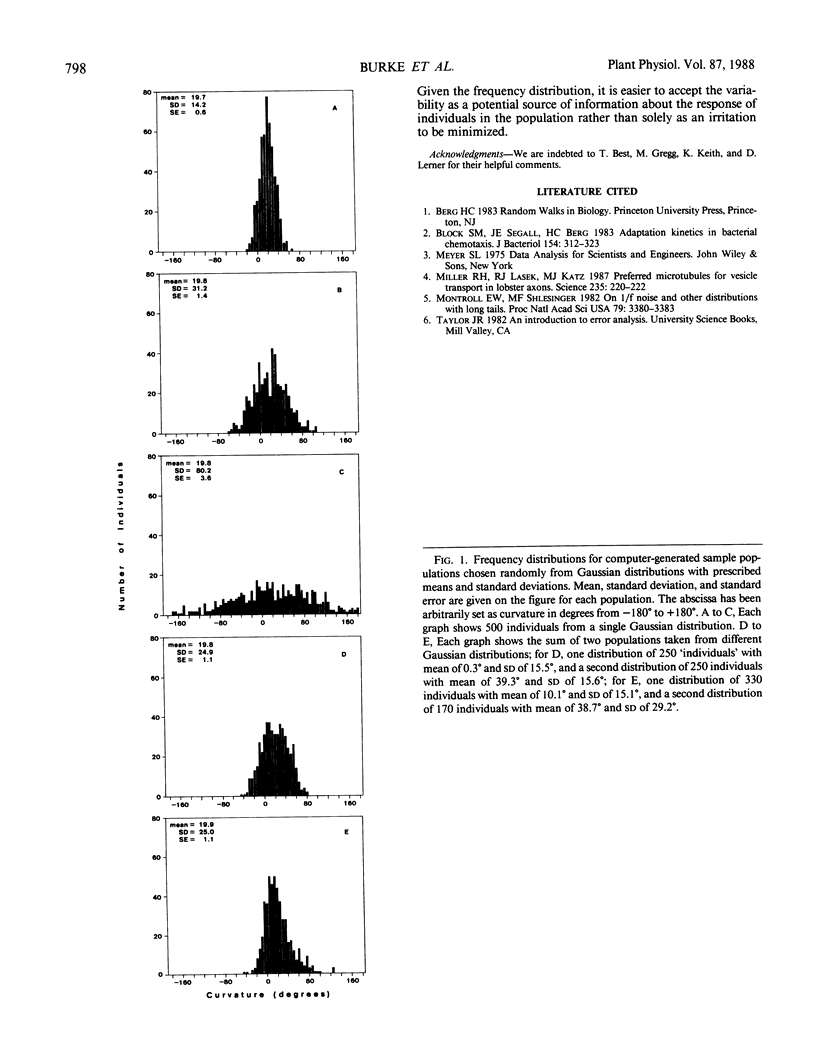
The mean and standard error are good representations for the response of a population to an experimental parameter and are frequently used for this purpose. Frequency distribution histograms show, in addition, responses of individuals in the population. Both the statistics and a visual display of the distribution of the responses can be obtained easily using a microcomputer and available programs. The type of distribution shown by the histogram may suggest different mechanisms to be tested.
Full text
PDF
Selected References
These references are in PubMed. This may not be the complete list of references from this article.
- Block S. M., Segall J. E., Berg H. C. Adaptation kinetics in bacterial chemotaxis. J Bacteriol. 1983 Apr;154(1):312–323. doi: 10.1128/jb.154.1.312-323.1983. [DOI] [PMC free article] [PubMed] [Google Scholar]
- Miller R. H., Lasek R. J., Katz M. J. Preferred microtubules for vesicle transport in lobster axons. Science. 1987 Jan 9;235(4785):220–222. doi: 10.1126/science.2432661. [DOI] [PubMed] [Google Scholar]
- Montroll E. W., Shlesinger M. F. On 1/f noise and other distributions with long tails. Proc Natl Acad Sci U S A. 1982 May;79(10):3380–3383. doi: 10.1073/pnas.79.10.3380. [DOI] [PMC free article] [PubMed] [Google Scholar]