

Abstract
Background & Aims:
Non-alcoholic fatty liver disease (NAFLD) can progress to cirrhosis and hepatic decompensation, but whether genetic variants influence the rate of progression to cirrhosis or are useful in risk stratification among patients with NAFLD is uncertain.
Methods:
We included participants from two independent cohorts, Michigan Genomics Initiative (MGI) and UK Biobank (UKBB), who had NAFLD defined by elevated alanine aminotransferase (ALT) levels in the absence of alternative chronic liver disease. The primary predictors were genetic variants and metabolic comorbidities associated with cirrhosis. We conducted time-to-event analyses using Fine-Gray competing risk models.
Results:
We included 7,893 and 46,880 participants from MGI and UKBB, respectively. In univariable analysis, PNPLA3-rs738409-GG genotype, diabetes, obesity, and ALT >2x upper limit of normal were associated with higher incidence rate of cirrhosis in both MGI and UKBB. PNPLA3-rs738409-GG had additive effects with clinical risk factors including diabetes, obesity, and ALT elevations. Among patients with indeterminate Fibrosis-4 (FIB4) scores (1.3–2.67), those with diabetes, and PNPLA3-rs738409-GG genotype had incidence rate of cirrhosis comparable to that of patients with high-risk FIB4 scores (>2.67) and 2.9 to 4.8-times that of patients with diabetes but CC/CG genotypes. In contrast, FIB4<1.3 was associated with incidence rate of cirrhosis significantly lower than that of FIB4>2.67, even in the presence of clinical risk factors and high-risk PNPLA3 genotype.
Conclusions:
PNPLA3-rs738409 genotype and diabetes identified patients with NAFLD currently considered indeterminate risk (FIB4 1.3–2.67) who had similar risk of cirrhosis as those considered high-risk (FIB4 2.67). PNPLA3 genotyping may improve prognostication and allow for prioritization of intensive intervention.
Keywords: genetics, predictive modeling, risk stratification, TRIB1, polygenic risk score
INTRODUCTION
Non-alcoholic fatty liver disease (NAFLD) is a leading cause of cirrhosis and end-stage liver disease 1 and is implicated in 36% of liver-related deaths and over one billion dollars in annual healthcare costs in the United States 2, 3. However, while NAFLD is a leading cause of liver-related mortality, most patients with NAFLD do not die from liver disease or even develop cirrhosis 4. NAFLD pathophysiology is heterogeneous with variable rates of disease progression and spontaneous regression, and we have limited ability to predict which patients with NAFLD are most likely to progress to cirrhosis 5. The most consistent clinical predictor of incident cirrhosis and liver-related death is fibrosis stage 6, 7. However, determining fibrosis stage requires testing such as liver elastography or liver biopsy which are infrequently available outside of a subspecialist setting 8. Other factors such as diabetes and obesity are less strongly predictive 9–11. Improving risk stratification is critical to prioritizing the highest-risk patients to intensive interventions.
Incorporating genetic variants may help predict risk of disease progression. Liver cirrhosis and fibrosis are largely genetically mediated with estimated heritability around 50% 12–14. In addition, genetic and environmental risk factors may interact to further exacerbate risk of hepatic steatosis or cirrhosis. We previously found that genetic susceptibility to hepatic steatosis interacted with insulin resistance to increase risk of hepatic steatosis and that PNPLA3 genotype, insulin resistance, and their interaction accounted for 8% of variability in hepatic steatosis 15. In addition, a recent genome-wide multi-trait association study for cirrhosis and alanine aminotransferase (ALT) found that a polygenic risk score (PRS) for cirrhosis interacted with alcohol intake and body mass index to increase lifetime risk of cirrhosis 16.
Despite this, there has been little uptake of genotyping for clinical management of NAFLD. The literature on effects of genetic variation on NAFLD-related cirrhosis has largely consisted of case-control studies comparing patients with vs. without cirrhosis, but there is very limited literature on how genetics impacts rate of disease progression. In addition, most genetic studies on incident cirrhosis in NAFLD have used the general population as controls, so the effects of genetic variants on disease progression in patients with established NAFLD are not well-characterized 17, 18. Most importantly, whether incorporating genetics into risk stratification results in meaningful improvement over clinical predictors such as Fibrosis-4 (FIB4), diabetes, and obesity status, is unknown. Improved understanding of how genetics influences rate of disease progression and how it interacts with established risk factors for advanced liver disease is crucial for genetic testing to be applicable in clinical practice 19.
We conducted an exploratory study in two independent cohorts to determine how known NAFLD-promoting genetic variants influence rate of progression to cirrhosis among patients with NAFLD and whether genetics can improve upon risk stratification.
METHODS
Ethics
The Institutional Review Board of the University of Michigan (Ann Arbor, MI) approved all research conducted in this study. All Michigan Genomics Initiative (MGI) participants provided written informed consent. UK Biobank (UKBB) protocols were approved by the National Research Ethics Service Committee and all participants provided written informed consent. UKBB analyses in this project were conducted under Resource Project 18120. This study followed STROBE guidelines.
Cohorts and genotyping
MGI is an ongoing prospective cohort that has been recruiting patients seen at Michigan Medicine (Ann Arbor, MI, USA) since 2012, with >80,000 subjects with genotyping of whole blood on an Illumina HumanCoreExome v.12.1 array, a combined GWAS and exome array consisting of >500,000 SNPs at the time of analysis 20. Imputation was performed to Haplotype Reference Consortium (release 1 for chromosomes 1–22 and 1.1 for X) 13.
UKBB is a prospective cohort of >500,000 individuals living in the UK aged 40–69 years at recruitment (2006–2010) 21. Participants were genotyped on one of two arrays: UK BiLEVE Axiom Array (n = 50,520) or UK BioBank Axiom Array (n = 438,692) with >95% overlap. SNPs were imputed to Haplotype Reference Consortium and UK10K. For quality control, we used EasyQC (version 9.2) with an imputation quality cutoff of 0.85.
Genetic predictors
We selected genetic variants previously associated with hepatic steatosis and/or cirrhosis 22–25, with individual variants modeled based on genotype (e.g., AA, AC, vs. CC alleles). The specific variants evaluated were: PNPLA3-rs738409, TM6SF2-rs58542926, HSD17B13-rs6834314, TRIB1-rs28601761, MBOAT7-rs641738, APOE-rs429358, GPAM-rs2792751, and GCKR-rs1260326. We also evaluated a previously reported PRS for cirrhosis, based on dosages of individual genetic variants, weighted by the beta value for each genetic variant 16.
NAFLD definition
In both MGI and UKBB, we included patients with NAFLD defined based on ALT elevations in the absence of excess alcohol intake or other etiologies of chronic liver disease including chronic viral hepatitis and alcohol-related liver disease (Supp. Table 1) 26–28. In MGI, we required outpatient ALT levels ≥31 U/L in women or ≥40 U/L in men, on at least two occasions at least six months apart, or an ICD code for NAFLD (571.8, K76.0, or K75.81). We previously reported that in a Michigan Medicine cohort these criteria have 89–96% specificity for NAFLD 26. In UKBB, serial ALT values are unavailable in >90% of participants, so we required only a single ALT elevation. In both cohorts, the NAFLD index date was the first date of ALT elevation.
Outcomes
The primary outcome was cirrhosis, defined based on ICD-9 and −10 codes for cirrhosis or portal hypertensive complications which are highly specific for diagnosis of cirrhosis (Supp. Table 1) 29–31. Diagnosis codes are available through linkage to the electronic medical record in MGI and to National Health Service data in UKBB. For patients with multiple diagnosis codes for cirrhosis, the earliest was used. Both inpatient and outpatient ICD codes are available in MGI, but only inpatient codes are available in UKBB. We excluded patients with prevalent cirrhosis defined as first diagnosis of cirrhosis 1 year after the NAFLD index date or earlier. Patients were followed until onset of cirrhosis, death, or last follow-up date, whichever was earliest. For UKBB, last follow-up date was May 31, 2017, and for MGI, December 31, 2021.
As a sensitivity analysis, we also used as the outcome liver-related events (LREs), defined as hepatic decompensation or hepatocellular carcinoma (Supp. Table 1); specifically, compensated cirrhosis would not count as an LRE in this analysis.
Statistical methods
Other predictors
We generated a “clinical risk score” based on presence of diabetes, obesity, and ALT ≥2x upper limit of normal (ULN), which were the clinical predictors most strongly associated with incident cirrhosis. Each patient received 2 points for presence of diabetes, and 1 each for presence of obesity or ALT ≥2x ULN, for a range of 0–4 points. These values were assigned approximately based on the beta values in multivariable analysis in MGI (Table 1; β = 0.41 for obesity, β = 0.40 for ALT ≥2x ULN, and β = 0.70 for diabetes), except that to simplify the score, obesity and ALT ≥2x ULN were each assigned 1 point and diabetes was assigned 2 points. The same score was used in both the MGI and UKBB cohorts. We then divided patients into low, intermediate, and high risk (0–1, 2–3, and 4 points, respectively) groups; these cutoffs were chosen because cumulative incidence of cirrhosis was similar in patients with 0 vs. 1, or 2 vs. 3 points (Supp. Figure 1).
Table 1:
Multivariable predictors of incident cirrhosis
| Predictor | Michigan Genomics Initiative (n=6,482) | UK Biobank (n=49,751) | ||
|---|---|---|---|---|
| Hazard ratio (95% confidence interval) | P value | Hazard ratio (95% confidence interval) | P value | |
| Diabetes | 2.01 (1.43–2.83) | <.0001 | 3.05 (2.28–4.08) | <.0001 |
| Body mass index | ||||
| Lean/overweight | (Referent) | (Referent) | ||
| Obese | 1.50 (1.04–2.18) | 0.031 | 1.25 (0.96–1.62) | 0.094 |
| Alanine aminotransferase | ||||
| <38/60 U/L in women/men | (Referent) | (Referent) | ||
| >= 38/60 U/L in women/men | 1.49 (1.06–2.10) | 0.024 | 3.06 (2.32–4.02) | <.0001 |
| PNPLA3-rs738409 genotype | ||||
| CC | (Referent) | (Referent) | ||
| CG | 1.43 (1.00–2.06) | 0.052 | 1.05 (0.80–1.38) | .73 |
| GG | 3.24 (2.01–5.23) | <.0001 | 1.99 (1.38–2.88) | .00024 |
| TRIB1-rs28601761 genotype | ||||
| GG | (Referent) | (Referent) | ||
| GC | 1.20 (0.69–2.11) | 0.52 | 1.24 (0.83–1.86) | .29 |
| CC | 1.91 (1.10–3.32) | 0.022 | 1.33 (0.88–2.00) | .18 |
Models were run as Fine-Gray competing risk analyses. Results are shown as hazard ratio (95% confidence interval). In univariable models, effect of each specific predictor is shown after adjustment for age, sex, and genetic principal components 1–10 to account for ethnic variation. Multivariable results indicate hazard ratios for each predictor additionally adjusted for all of the other predictors shown in this table.
We conducted subgroup analyses in which effects of genetic predictors significantly associated with incident cirrhosis were stratified by presence of environmental risk factors for incident cirrhosis. Finally, we conducted sensitivity analyses to stratify patients based on presence or absence of advanced fibrosis/cirrhosis based on FIB4 score cutoffs<1.3, 1.3–2.67, or >2.67 32, 33.
Comparing diagnostic accuracy of genetic predictors
We compared the diagnostic accuracy of PNPLA3-rs738409-GG genotype with a cirrhosis PRS 16 using a time-dependent receiver operating characteristic (ROC) framework 34. Here, cases were defined as those diagnosed with cirrhosis within 8 years after the index date, and controls were defined as those with at least 8 years of follow-up who did not develop cirrhosis. We computed area under the curve (AUC) for PNPLA3-rs738409-GG genotype or for the cirrhosis polygenic risk score, plus age, sex, and genetic principal components 1–10. In UKBB, principal components were calculated using 407,219 unrelated, high-quality samples and 147,604 high-quality genetic variants chosen to minimize linkage disequilibrium 35. In MGI, principal components were derived from a Human Genome Diversity Panel reference panel and approximately 650,000 genetic variants 36. We also calculated sensitivity, specificity, and positive/negative likelihood ratios 37. AUC values were compared and corresponding confidence intervals generated using the DeLong method 38.
Survival models
In time to event analyses, the primary outcome was incident cirrhosis, modeled as a Fine-Gray analysis with competing risk of death without cirrhosis 39. Follow-up time was defined as time from first ALT elevation (in MGI) or ALT elevation (in UKBB) to first diagnosis of cirrhosis or loss to follow-up, whichever came first. Patients lost to follow-up were censored (removed from further analysis) at last follow-up date. All models were adjusted for age, sex, and genetic principal components 1–10 to account for ancestry (principal components are variables that summarize overall genetic variation and, therefore, population stratification by ancestry). In addition, we conducted multivariable models which included age, sex, and principal components, as well as all predictors associated with incident cirrhosis at P<.1 in univariable analysis. We used competing risk methods to calculate incidence rate and cumulative incidence of cirrhosis, which in this case is defined as the product of the probability of having cirrhosis and the probability of having neither cirrhosis nor death without cirrhosis, over the follow-up period 40, 41. In these models, we reported hazard ratios (HR) for predictors 39.
In addition, we reported incidence of cirrhosis both as incidence rate (and incidence rate ratios [IRRs]) and 10-year cumulative incidence (). Incidence rates were defined as number of events (i.e. incident cirrhosis cases) divided by person-years (PY) of follow-up. Incidence rates were compared using a Poisson test with number of events and PY of follow-up as the input parameters 42. IRRs were computed by dividing incidence rates, with 95% confidence intervals defined as , where and are the number of incident events in the two groups whose incidence rates are being compared 43. was calculated as proportion of patients with an event at 10 years using competing risk methods, with confidence intervals (CI) computed as as previously reported 44. Note that incidence rate and IRRs do not take into account competing risks, while does. Annotated code is shown in Supp. Data 1.
For descriptive statistics, quantitative variables were reported as mean (standard error) and categorical variables as percentages (%). Continuous variables were compared with the Student t test if normally-distributed and the Mann-Whitney test if not normally-distributed. Categorical variables were compared with a chi-squared statistic.
In the primary analysis in the discovery cohort, we used Bonferroni-adjusted P values for genetic predictors for 9 comparisons. Otherwise, a two-sided P value < .05 was used to determine statistical significance. R version 4.0.2 (Vienna, Austria) was used for all analyses, with the cmprsk package used for time to event analyses. For each analysis, patients with missing datapoints were excluded.
RESULTS
Cohorts
The derivation cohort was MGI. Baseline characteristics are shown in Supp. Table 2. The MGI cohort included 7,893 participants with NAFLD, median age was 52 years, and 57% were female. There was a high prevalence of diabetes (36%) and obesity (58%). Incident cirrhosis developed in 194 (2.5%) MGI participants during a median follow-up of 71.6 (45.3–100.9 months), yielding an incidence rate of 4.0 per 1,000 PY overall. Of the remaining patients, 600 died during follow-up, 4,514 were lost to follow-up during the study period, and the remainder reached the end of the study period. Number of distinct outpatient ALT measurements in the MGI cohort is shown in Supp. Figure 2; the median number of measurements was 9.
The validation cohort was UKBB. Unlike MGI, UKBB is a community-based cohort and as expected had a lower prevalence of comorbidities such as diabetes and obesity, and lower FIB4 scores (Supp. Table 2). The UKBB cohort included 46,880 patients. During median follow-up of 106.3 (IQR 97.3–114.3 months), 248 (0.53%) developed incident cirrhosis, yielding an incident rate of 0.60 per 1000 PY overall. Of the remaining patients, 1,601 died during follow-up, 141 were lost to follow-up during the study period, and the remainder reached the end of the study period.
Validation of NAFLD and cirrhosis phenotypes
The NAFLD phenotype was validated in MGI as detailed in Methods. We also evaluated in a Michigan Medicine cohort sensitivity for ICD-10 codes for cirrhosis by evaluating patients with NAFLD (defined by ALT as above) who had an ultrasound, computed tomography, or magnetic resonance imaging study that reported a cirrhotic-appearing liver. We found that 973/1251 (77.8%) of these patients had an ICD code for cirrhosis within 12 months of the date of the imaging study showing cirrhosis, suggesting that ICD codes have acceptable sensitivity for cirrhosis. In UKBB, we validated the ALT definition of NAFLD among the subset of participants who underwent liver magnetic resonance imaging with proton density fat fraction measurement and found that specificity of ALT elevations was 93.0% (3,272/3,515) for liver fat fraction >5.5%. As additional validation that NAFLD defined by ALT level is clinically relevant, we found that UKBB participants with elevated ALT as defined above had markedly increased risk of incident cirrhosis than those without elevated ALT (Supp. Figure 3) with HR 7.38 (95% CI 6.21–8.78, P<.0001). We were unable to validate sensitivity of ICD codes for cirrhosis in UK Biobank as we do not have access to a “gold standard” metric of cirrhosis.
Predictors of incident cirrhosis in Michigan Genomics Initiative
In models adjusted only for age, sex, and genetic principal components 1–10, FIB4 score was a strong predictor of incident cirrhosis (HR 4.34 [95% CI 2.82–6.70, P<.0001) for >2.67 vs. <= 2.67 (Supp. Table 3, Supp. Figure 4). Other risk factors included diabetes (HR 2.14 [95% CI 1.60–2.85, P<.0001]), higher body mass index (HR 1.83 [95% CI 1.26–2.64, P=.0014] for obese vs. lean/overweight), and elevated ALT (HR 2.00 [95% CI 1.48–2.69], P<.0001 for ≥ vs. <2x ULN) (Table 1, Figure 1).
Figure 1:
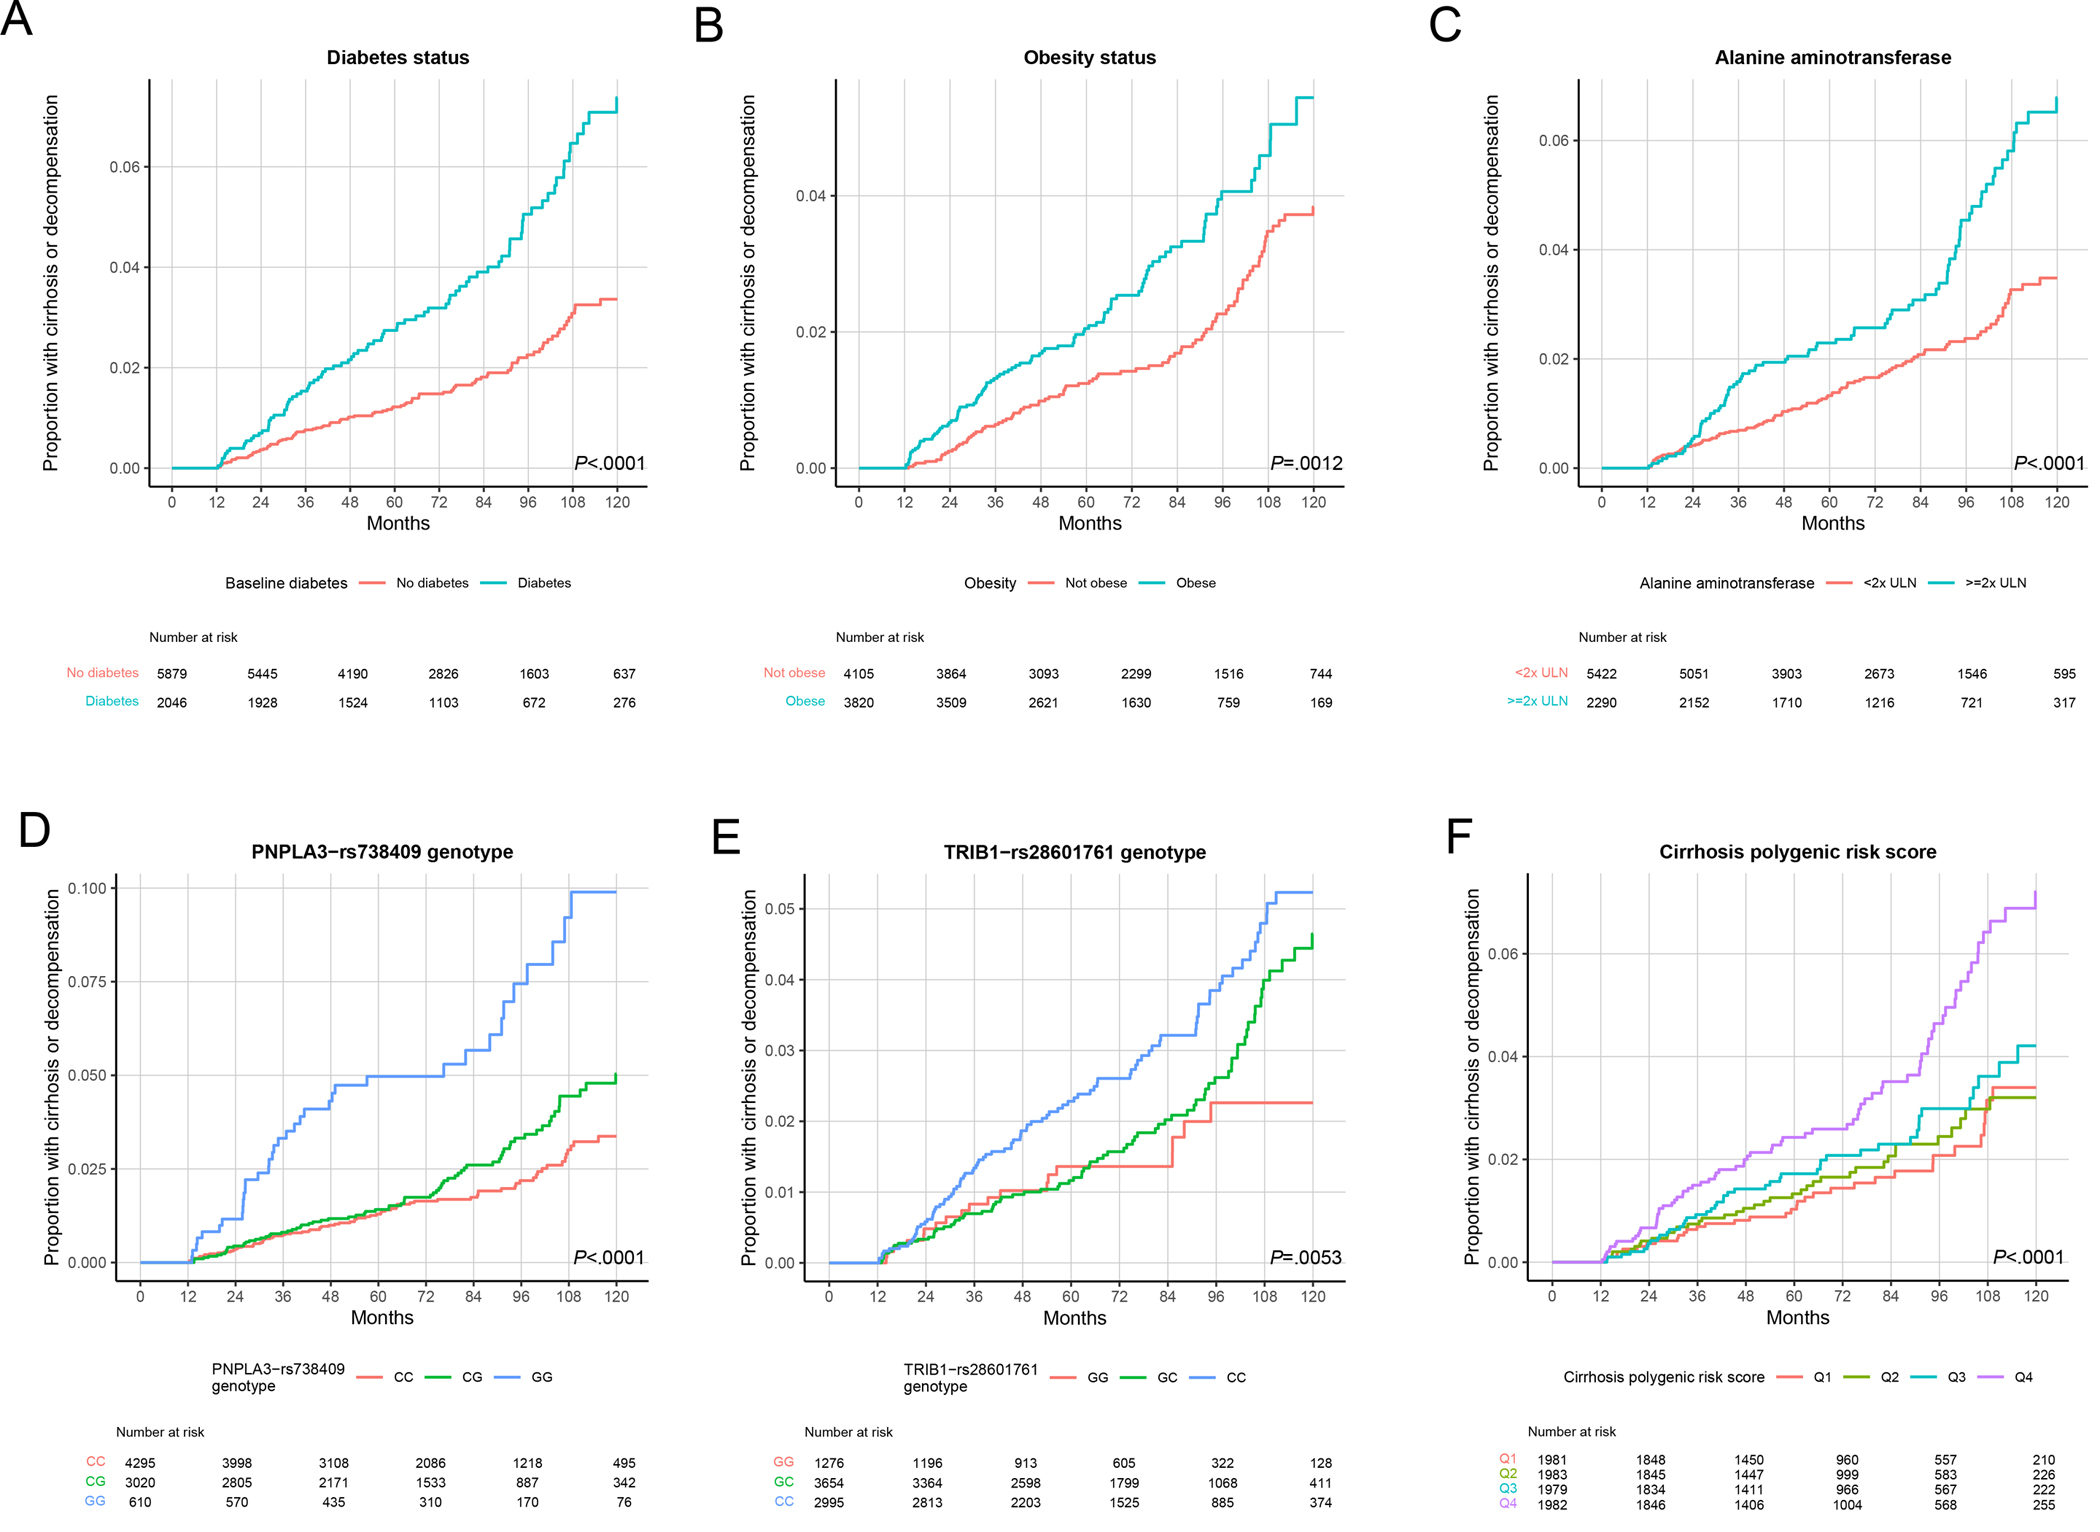
Genetic and environmental factors associated with progression to cirrhosis in Michigan Genomics Initiative. Models were run as Fine-Gray competing risk analyses. (A) Diabetes status. (B) Obesity status. (C) Alanine aminotransferase (ALT), with upper limit of normal (ULN) defined as 19 U/L in women and 30 U/L in men. (D) PNPLA3-rs738409 genotype. (E) TRIB1-rs28601761 genotype. (F) Cirrhosis polygenic risk score, divided into quartiles (Q), with Q1 indicating the lowest quartile.
We systematically evaluated genetic variants previously associated with NAFLD (Methods). In MGI, only two of these individual variants were associated with increased rate of progression to cirrhosis: PNPLA3-rs738409-GG (vs. CC) with HR 3.48 (95% CI 2.32–5.22, Padjusted<.0001) and TRIB1-rs28601761-CC (vs. GG) with HR 2.15 (95% CI 1.30–3.53, Padjusted=.023) (Supp. Table 3, Figure 1). A previously reported PRS for cirrhosis was associated with incident cirrhosis, but we observed an effect only at the highest risk quartile: HR 2.30 (95% CI 1.53–3.46, Padjusted=.00058) vs. lowest quartile (Supp. Table 3, Supp. Figure 4). Variants in TM6SF2, HSD17B13, and other previously reported risk loci were not significantly associated with incident cirrhosis (Supp. Table 3, Supp. Figure 4). We then generated a multivariable model for incident cirrhosis that additionally included the most consistent predictors of incident cirrhosis in MGI, namely PNPLA3-rs738409-G, TRIB1-rs28601761-C, diabetes, obesity (categorized as obesity vs. lean/overweight), and ALT level (categorized as ≥ vs. < 2x ULN) and all predictors remained significantly associated with incident cirrhosis with similar HRs compared to the univariable analysis (Table 1).
Secondary analyses in Michigan Genomics Initiative
In models including gene-environment interaction terms (e.g. PNPLA3-rs738409-G dosage * diabetes status), the interaction terms were not significant for either PNPLA3 or TRIB1 genotype and any of the environmental predictors (P>.05 for all). Consistent with this, HRs of PNPLA3 and TRIB1 genotype across different clinical risk categories (e.g. people with vs. without diabetes) were not significantly from one another (Pheterogeneity>.05 for all) (Supp. Figure 5).
We conducted a sensitivity analysis where LREs rather than cirrhosis were the primary outcome and found that the main clinical and genetic predictors identified in the primary analysis were associated with LREs, other than TRIB1 genotype (Supp. Table 4). Another sensitivity analysis stratifying by patients without baseline advanced fibrosis (FIB4 <1.3) or with indeterminate FIB4 (1.3–2.67) showed concordant directions of effects of PNPLA3 genotype, TRIB1 genotype, diabetes, obesity, and ALT elevation, though statistical significance was weaker than in the overall cohort (Supp. Table 5).
Combined impact of PNPLA3 or TRIB1 genotype and clinical risk factors on incident cirrhosis
Next, we sought to integrate genetic and clinical risk factors for risk stratification in patients with low (<1.3) or indeterminate FIB4 values (1.3–2.67) who are not considered to be at high risk for incident cirrhosis by current guidelines 33. PNPLA3-rs738409-GG genotype was associated with higher incidence rate of cirrhosis compared to CC/CG genotypes, among both patients with low FIB4 (incidence rate 6.7 [95% CI 3.2–12.3] vs. 2.4 [95% CI 1.8–3.1] events per 1,000 PY; incidence rate ratio 2.8 [95% CI 2.2–3.6]; P=.0057) and with indeterminate FIB4 (incidence rate 11.4 [95% CI 6.4–18.8] vs. 4.3 [95% CI 3.3–5.5] cases per 1,000 PY; incidence rate ratio 2.7 [95% CI 2.3–3.1]; P=.0017) (Table 2, Supp. Table 6). The association between PNPLA3 genotype and cirrhosis risk was also significant when stratified by diabetes status, obesity status, and ALT level. Notably, in patients with indeterminate FIB4 and diabetes, PNPLA3-rs738409-GG had incidence rate ratio of 4.4 (95% CI 3.4–5.8) vs. CC/CG genotype (28.8 [95% CI 13.8–52.9] vs. 6.5 [95% CI 4.2–9.5]/1000 PY) (Table 2). In patients with indeterminate FIB4, PNPLA3-rs738409-GG had incidence rate ratio 3.8 (95% CI 2.4–5.8) in those with intermediate clinical risk scores (17.6 [95% CI 6.5–38.4] vs. 4.7 [95% CI 2.7–7.5]/1000 PY; P=.011) and 3.3 (95% CI 1.2–8.7) in those with clinical high risk scores (30.5 [95% CI 6.3–89.2] vs. 9.3 [95% CI 3.4–20.3]/1000 PY; P=.11) (Table 2), compared to CC/CG genotype. TRIB1-rs28601761-CC genotype was associated with higher incidence rate of cirrhosis in patients with low FIB4 but not in those with indeterminate FIB4 scores (Supp. Table 7).
Table 2:
Incidence rate of cirrhosis stratified by PNPLA3 genotype, in patients in indeterminate Fibrosis-4 score, in the Michigan Genomics Initiative and UK Biobank
| Cohort | Incidence rate based on PNPLA3-rs738409 genotype | Incidence rate ratio | P value | |
|---|---|---|---|---|
| CC (lowest risk) or CG | GG (highest risk) | |||
| Michigan Genomics Initiative | ||||
| All (n=2,601) | 4.30 (3.29–5.52) | 11.38 (6.37–18.76) | 2.65 (2.25–3.11) | .0017 |
| Diabetes (n=712) | 6.50 (4.24–9.52) | 28.76 (13.79–52.90) | 4.43 (3.37–5.81) | .00039 |
| Obesity (n=1,169) | 4.22 (2.31–7.08) | 16.83 (7.70–31.95) | 3.46 (2.60–4.60) | .0031 |
| ALT >= 2x ULN (n=797) | 5.14 (3.29–7.65) | 14.73 (6.36–29.02) | 2.87 (2.07–3.97) | .015 |
| Clinical risk score | ||||
| Low (n=1,394) | 3.40 (2.15–5.09) | 4.88 (1.01–14.27) | 1.44 (0.69–3.01) | .47 |
| Intermediate (n=710) | 4.71 (2.74–7.54) | 17.64 (6.48–38.40) | 3.75 (2.41–5.83) | .0011 |
| High (n=130) | 9.33 (3.42–20.31) | 30.53 (6.30–89.23) | 3.27 (1.23–8.72) | .011 |
| UK Biobank | ||||
| All (n=23,114) | 0.61 (0.50–0.74) | 0.91 (0.52–1.48) | 1.49 (1.30–1.71) | .16 |
| Diabetes (n=2,538) | 1.53 (1.03–2.19) | 4.39 (1.89–8.65) | 2.87 (2.10–3.91) | .013 |
| Obesity (n=10,375) | 0.68 (0.51–0.88) | 1.85 (1.04–3.05) | 2.73 (2.31–3.23) | .0013 |
| ALT >= 2x ULN (n=9,693) | 0.84 (0.65–1.08) | 1.13 (0.54–2.08) | 1.34 (1.07–1.68) | .34 |
| Clinical risk score | ||||
| Low (n=16,619) | 0.47 (0.36–0.60) | 0.17 (0.02–0.61) | 0.36 (0.13–0.99) | .17 |
| Intermediate (n=5,499) | 0.83 (0.58–1.15) | 2.06 (0.99–3.80) | 2.49 (1.94–3.21) | .022 |
| High (n=752) | 2.28 (1.22–3.91) | 5.77 (1.57–14.76) | 2.52 (1.33–4.79) | .010 |
Incidence rate is shown as events per 1,000 person-years (95% confidence interval), in the overall cohort and key subgroups. Clinical risk score: low risk includes patients with no diabetes and no more than one of ALT >= 2x ULN or obesity; high risk includes those with diabetes, obesity, and ALT >= 2x ULN; and intermediate risk indicates all other patients. Incidence rate ratios are shown as ratio for rs738409-GG vs. CC/CG genotype (95% confidence interval). Incidence rate ratio is for the incidence rate of PNPLA3-rs738409-GG genotype relative to CC/CF genotype. P value is for the association between PNPLA3 genotype (defined as rs738409-CC or -CG vs. -GG) and incidence rate of cirrhosis within each subgroup. Incidence rate confidence intervals and p values were computed using a Poisson statistic with number of events and follow-up duration as the parameters (see Methods for details). ULN, upper limit of normal, defined as 19 U/L for women or 30 U/L for men. Indeterminate Fibrosis-4 score was defined as 1.3–2.67.
Validation in UK Biobank
On univariable analysis, diabetes, obesity, elevated ALT, PNPLA3-rs738409-GG genotype were associated with incident cirrhosis, as was the case in MGI (Supp. Table 8). The association between the TRIB1-rs28601761-C allele and cirrhosis was not statistically significant. In UKBB unlike in MGI, TM6SF2-rs58542926-T associated with incident cirrhosis while the cirrhosis PRS did not (Supp. Table 8). Other genetic predictors were not significantly associated with incident cirrhosis (data not shown; P>.05 for all). On multivariable analysis, the association between obesity and incident cirrhosis was no longer statistically significant (P=.09) but there were otherwise no meaningful changes in the results with diabetes, ALT level, and PNPLA3-rs738409 genotype continuing to have significant associations and TRIB1-rs28601761-C not (Table 1).
We conducted sensitivity analyses in UKBB similar to those in MGI. After stratification by FIB4 score, associations between diabetes, obesity, ALT, and PNPLA3 genotypes and incident cirrhosis within each FIB4 category were similar to those in the overall cohort though P values were less significant due to a smaller number of events (Supp. Table 9). The factors associated with incident LREs in the overall UKBB cohort were the same as those associated with incident cirrhosis (Supp. Table 10). Unlike in MGI, HRs for effects of PNPLA3 genotype on incident cirrhosis were larger in higher-risk subgroups such as diabetes, obesity, and ALT ≥ 2x ULN (Supp. Figure 6).
Next, we validated in UKBB the combined effects on cirrhosis incidence of PNPLA3-rs738409 genotype and the non-genetic factors of diabetes, obesity, ALT elevations, and the clinical risk score, in patients with low (<1.3) or indeterminate (1.3–2.67) FIB4 scores. The associations between PNPLA3 genotype and metabolic risk factors, and incident cirrhosis were similar to the findings in MGI (Table 2, Supp. Table 11). Among patients with FIB4 1.3–2.67, PNPLA3-rs738409-GG genotype was associated with incidence rate ratio for cirrhosis of 2–3 among patients with diabetes, obesity, or intermediate or high clinical risk scores (Table 2).
Accuracy of PNPLA3 genotype vs. a cirrhosis PRS in predicting incident cirrhosis
We compared the accuracy of PNPLA3 genotype vs. the cirrhosis PRS 16 in predicting incident cirrhosis using a time-dependent ROC model, in patients with diabetes and FIB4 1.3–2.67 (Methods) 34. In MGI, AUC of PNPLA3-rs738409-GG genotype and the cirrhosis PRS were 0.78 (95% CI 0.71–0.85) and 0.73 (95% CI 0.65–0.81), respectively (P=.057), and in UKBB, 0.67 (95% CI 0.59–0.75) and 0.65 (95% CI 0.58–0.73), respectively (P=.33). All models included age, sex, and principal components 1–10. Sensitivity, specificity, positive likelihood ratio, and negative likelihood ratio of PNPLA3-rs738409-GG genotype for predicting incident cirrhosis were 0.30, 0.93, 4.40, 0.75, respectively, in MGI, and 0.21, 0.91, 2.33, and 0.87 in UKBB.
FIB4, PNPLA3 genotype, and clinical risk factors for risk stratification
Finally, we evaluated whether PNPLA3 genotyping could identify patients with low or indeterminate baseline FIB4 (<1.3 or 1.3–2.67) who are at high risk of disease progression, i.e. risk similar to that of those with FIB4 >2.67. We focused on patients with lower FIB4 scores but diabetes, based on our findings that diabetes has the most consistent effect on cirrhosis risk of the clinical risk factors (Table 2).
Among patients with indeterminate baseline FIB4 scores (1.3–2.67) and diabetes, PNPLA3 genotype identified a high-risk subpopulation. In MGI, PNPLA3-rs738409-GG carriers had cumulative incidence of cirrhosis similar to that of patients with high baseline FIB4 (HR = 1.96 [95% CI 0.95–4.17], p = .068), and nearly five-fold higher risk than those with rs738409-CC or CG genotypes (HR 4.76 [95% CI 2.22–10.00], P<.0001) (Figure 2). Similarly, in UKBB, persons with indeterminate baseline FIB4 score and diabetes who carried the PNPLA3-rs738409-GG genotype had incidence of cirrhosis similar to that of the patients with baseline FIB4 >2.67 (HR = 0.67 [95% CI 0.33–1.37], P=.28) and nearly three-fold greater than those with indeterminate FIB4, diabetes, but PNPLA3-rs738409-CC or CG genotypes (HR = 2.85 [95% CI 1.33–6.25], P=.0076) (Figure 2).
Figure 2:
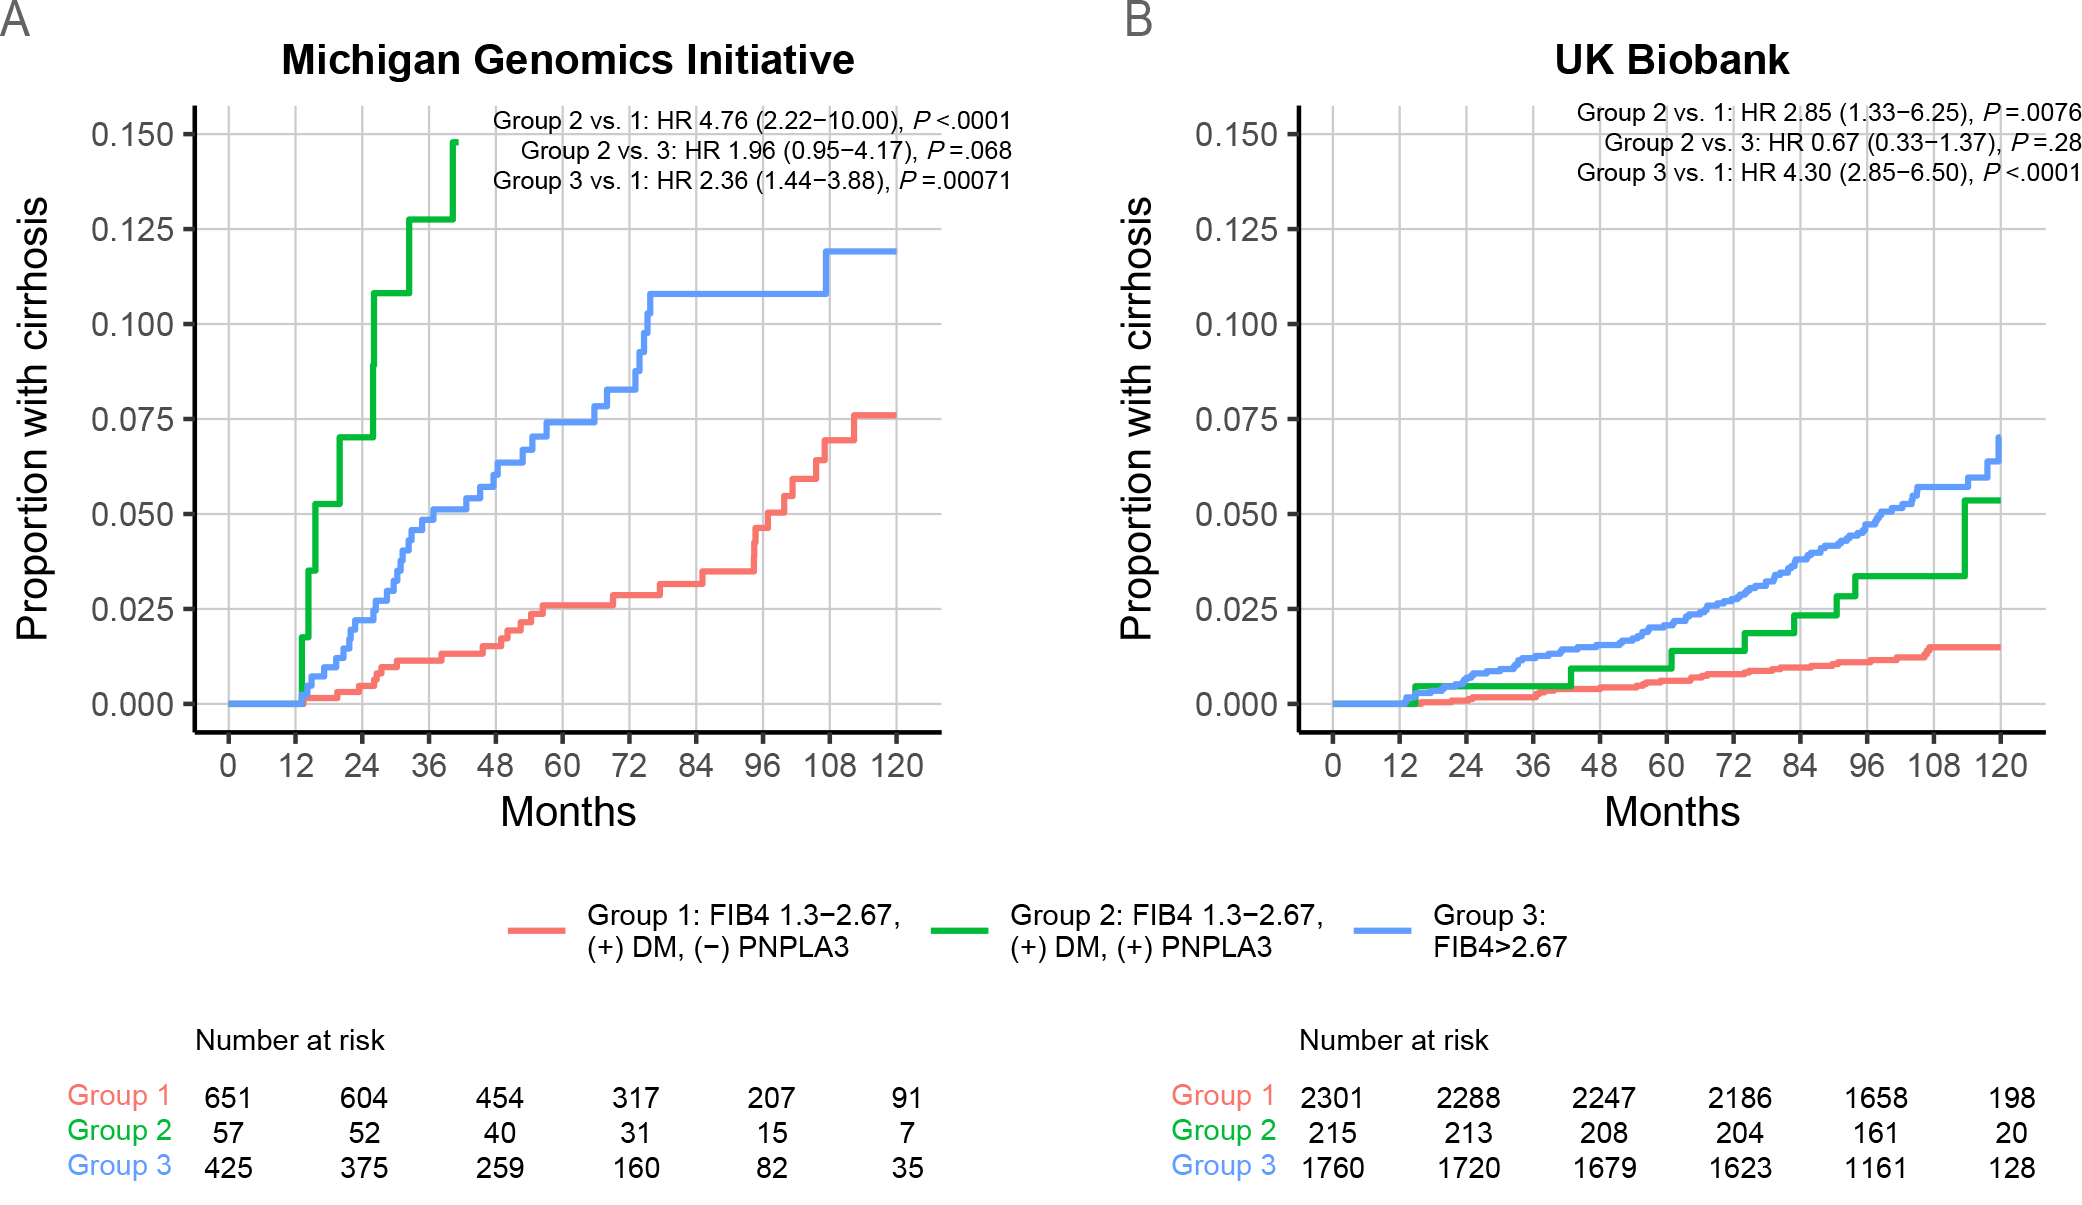
PNPLA3 genotype identifies a subgroup of patients with indeterminate FIB4 with cirrhosis incidence comparable to that of patients with high FIB4. (A-B) Patients were divided into three groups: high FIB4 (>2.67), indeterminate FIB4 (1.3–2.67) with diabetes [(+) DM] and PNPLA3-rs738409-GG genotype [(+) PNPLA3], and indeterminate FIB4 with diabetes and PNPLA3-rs738409-CC or -CG genotype [(−) PNPLA3]. (A) Michigan Genomics Initiative. (B) UK Biobank.
In contrast, in patients with FIB4 <1.3, PNPLA3 genotype and diabetes status did not identify a high-risk group. FIB4 >2.67 was associated with a markedly increased risk of incident cirrhosis compared to low FIB4 (<1.3), diabetes, and low-risk PNPLA3 genotype, with HR 3.9 (95% CI 2.2–6.9) and 40.4 (9.9–164.0) in MGI and UKBB, respectively (p<.0001 for both; Supp. Figure 7). Further, among patients with low FIB4 and diabetes, PNPLA3 genotype was not significantly associated with increased cumulative incidence of cirrhosis in either MGI or UKBB (p>.05 for both).
DISCUSSION
FIB4 is becoming increasingly used for risk stratification and incorporated into clinical pathways for management of NAFLD 33. However, in the primary care setting, the vast majority of patients do not have advanced fibrosis or elevated FIB4, and further methods for risk stratification are necessary. We found that PNPLA3 genotyping in conjunction with clinical risk factors may improve risk stratification in patients with NAFLD. Patients with indeterminate FIB4 (1.3–2.67), elevated genetic risk (PNPLA3-rs738409-GG), and diabetes have an overall incidence rate of cirrhosis comparable to that of patients with high FIB4 (>2.67) for whom closer monitoring and hepatology evaluation is recommended 33. In contrast, patients with low baseline FIB4 (<1.3) were at much lower risk even if diabetes was present and PNPLA3 genotype did not meaningfully affect this risk. Thus, routine PNPLA3 genotyping identifies a subgroup of patients with NAFLD and indeterminate FIB4 who are not otherwise considered to have high risk for advanced liver disease, but who may nonetheless warrant more regular follow-up and more aggressive treatment (Figure 3).
Figure 3:
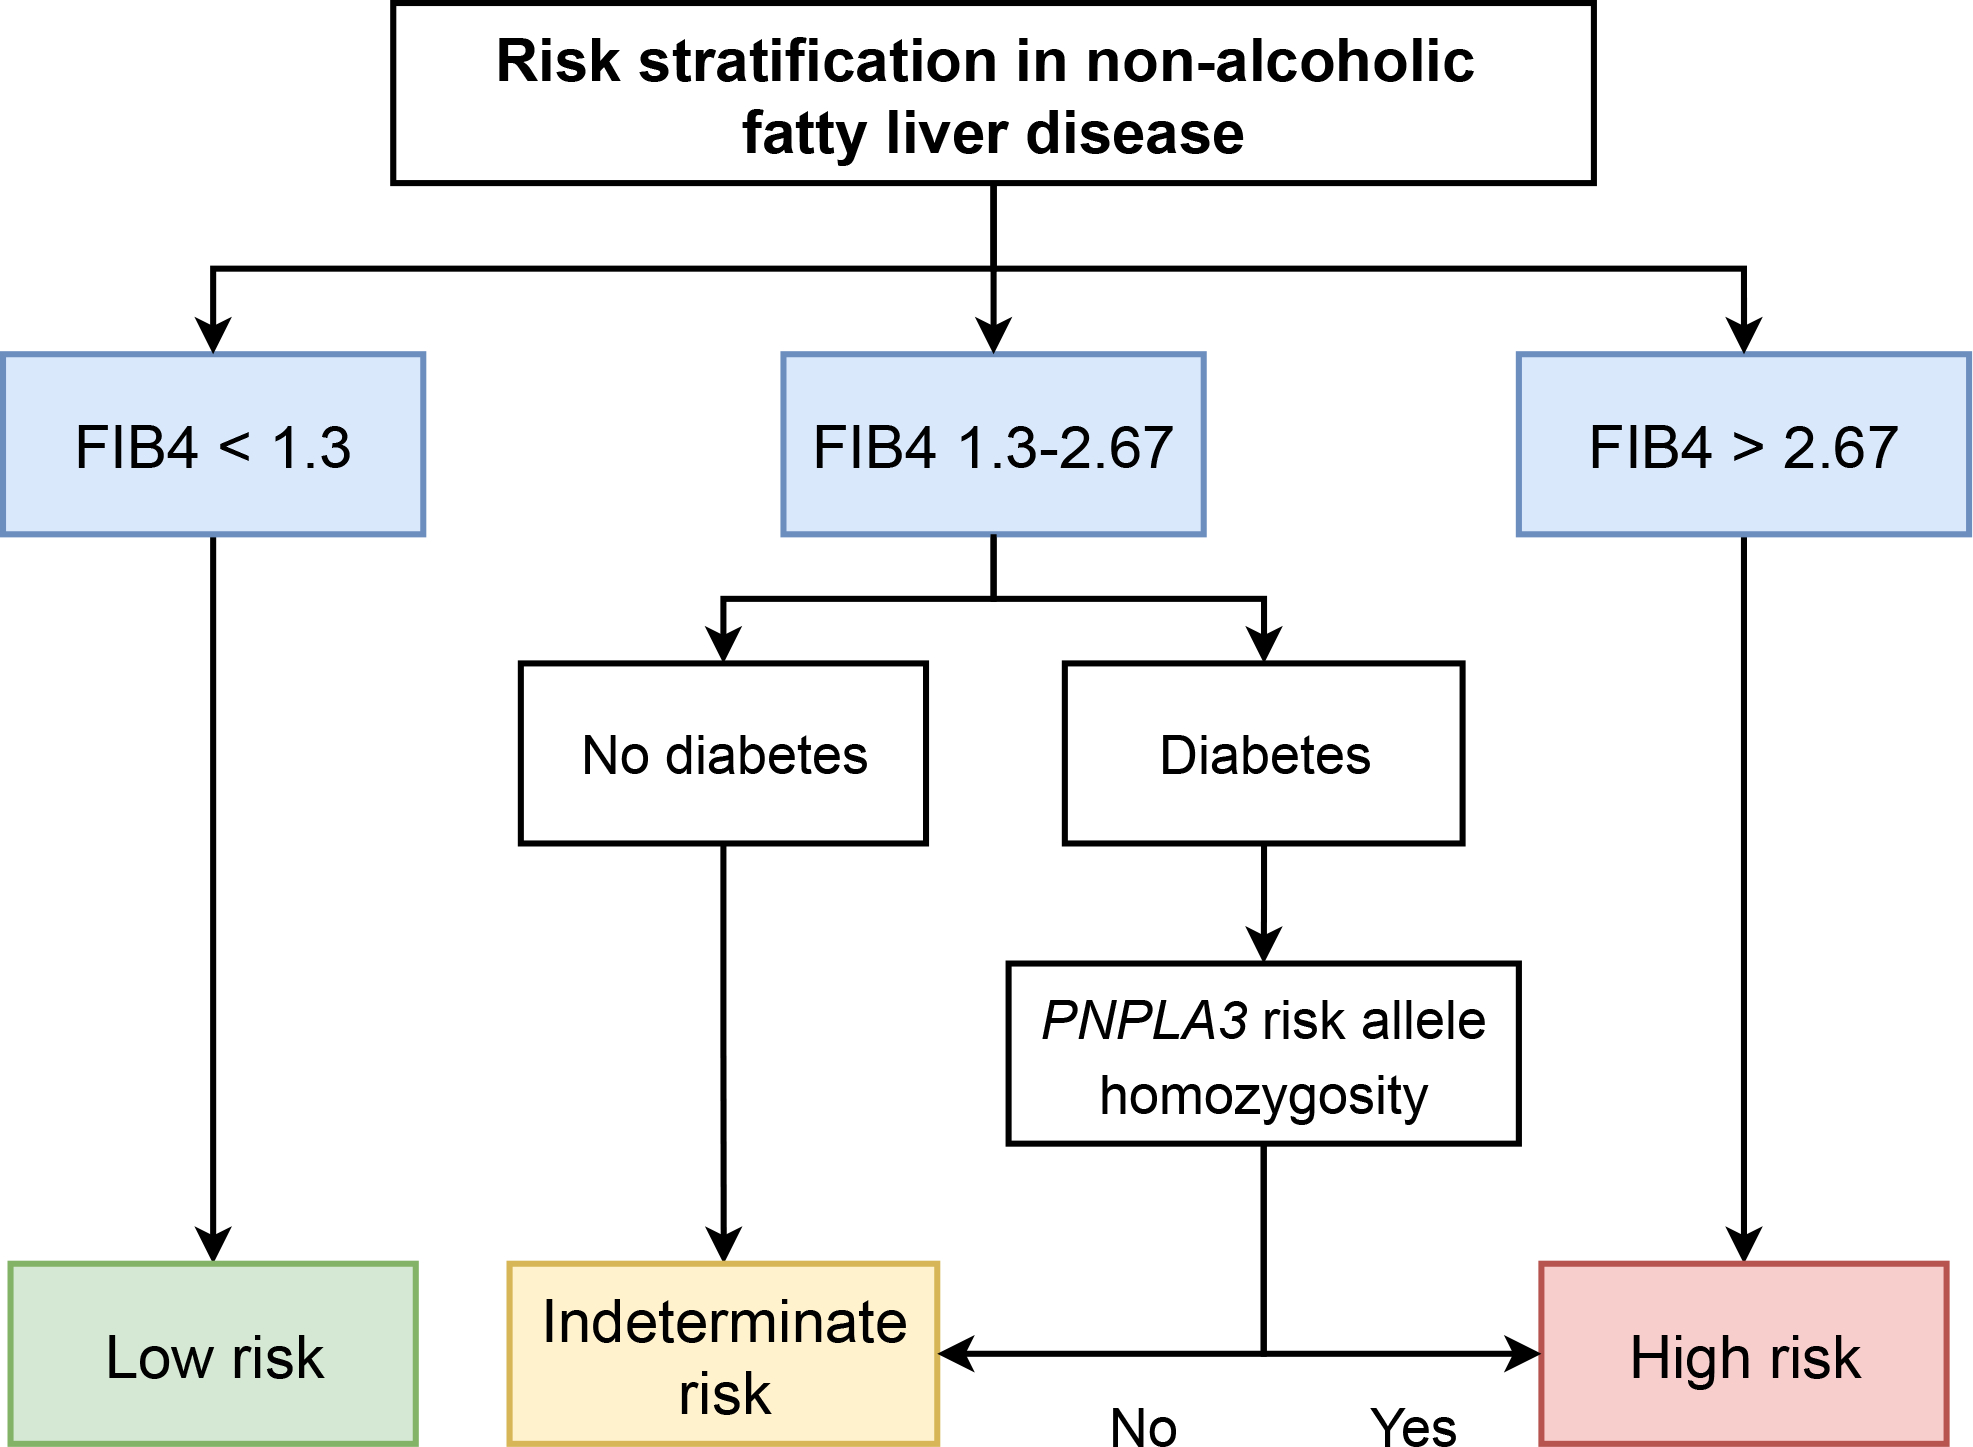
Schematic for incorporating PNPLA3 genotype into risk stratification in non-alcoholic fatty liver disease. “PNPLA3 risk allele homozygosity” refers to PNPLA3-rs738409-GG genotype. FIB4, fibrosis-4 score.
Contrary to other studies, we found that heterozygotes for the PNPLA3-rs738409-G allele had no difference in cirrhosis incidence than those who did not carry the risk allele. One of the earliest studies evaluating impact of PNPLA3 genotype on cirrhosis in NAFLD found a dose-dependent effect of the rs738409-G allele on fibrosis stage 45. Other studies have found a dose-dependent effect of the PNPLA3 risk allele on mortality, liver-related events, and liver-related death 46, 47. These differences may be in part due to choice of statistical modeling (time-to-event in our study vs. case-control in other studies) and how baseline fibrosis stage was accounted for (biopsy in other studies vs. FIB4 in our study). We found that a previously-reported cirrhosis PRS had similar AUC for incident cirrhosis compared to PNPLA3 genotype alone 16. PRSs have clear advantages compared to individual variants in that they better capture the polygenic nature of genetic risk of common diseases and may have greater statistical power, but may not be generalizable across ancestry and may obscure biological mechanisms behind gene-trait associations 48, 49. While it may be possible to develop more complex PRSs for cirrhosis, these findings suggest that genotyping of PNPLA3 alone, which is less expensive than genome-wide genotyping and easier to understand, may have similar clinical applicability for NAFLD.
A strength of our study is that the central finding that PNPLA3 status and diabetes together allowed for risk stratification of cirrhosis among patients with NAFLD was validated in both a tertiary care cohort with high prevalence of comorbidities (MGI) and a community-based cohort that is overall healthier than the general population (UKBB) 50. Cirrhosis was also defined differently between cohorts in that UKBB included only inpatient diagnosis codes (which could lower sensitivity, especially for detecting compensated cirrhosis) while MGI included inpatient or outpatient codes, thus better capturing patients with compensated cirrhosis. These differences manifested themselves clearly in a higher cumulative incidence of cirrhosis in MGI, though the cumulative incidence of cirrhosis was comparable in patients with high FIB4 across cohorts implying that this difference in cirrhosis definition is less important in higher risk patients. Importantly, our key finding was validated despite differences in cohort characteristics and definitions of NAFLD and cirrhosis. In addition, we evaluated the impact of PNPLA3-rs738409 genotype in conjunction with a clinical risk score and found it had prognostic significance independent of metabolic risk factors. Notably, PNPLA3-rs738409-GG carriers with diabetes had a risk similar to those with baseline high FIB4 scores, indicating that it identifies a group that would not be prioritized with current guidelines. Finally, this is one of the first studies evaluating the impact of genetics on the rate of disease progression in patients with NAFLD. While understanding the lifetime risk of cirrhosis as it relates to genetics is important, rate of progression is arguably more important in NAFLD because of the high prevalence of non-hepatic comorbidities among patients with NAFLD that may limit life expectancy 51.
One limitation of this study is that both the UKBB and MGI cohorts are predominantly Caucasian. We note that the PNPLA3-rs738409-G allele frequency varies across ancestry, and approximately 25% of patients of Asian or Hispanic ancestry have the highest risk -GG genotype (vs. 7% in the UKBB and MGI cohorts). These differences in allele frequency imply that our findings may be even more important in some non-Caucasian populations, but this remains to be determined and validation in ethnically diverse cohorts will be necessary. In addition, ascertainment of cirrhosis relied on ICD codes rather than “objective” evidence of cirrhosis. We and others have shown that ICD codes for cirrhosis have high specificity and positive predictive value 29, 30. In this study we report that in a Michigan Medicine cohort the sensitivity is >75% among those with imaging evidence of cirrhosis though we acknowledge that patients with abdominal imaging may represent a biased cohort and sensitivity may be lower among the general population with NAFLD. Unfortunately, we were unable to evaluate sensitivity of ICD codes for cirrhosis in UKBB. Patients in MGI may have been lost to follow-up at Michigan Medicine but subsequently diagnosed with cirrhosis at another medical center, which may result in decreased sensitivity for detecting incident cases of cirrhosis. We used a surrogate definition of NAFLD based on ALT elevations, though we and others have shown high specificity of this definition 26, 28, 52. Duration of NAFLD, which presumably is linked to risk of cirrhosis, was not known in our study 53. Finally, we did not have access to histology or elastography data to determine baseline fibrosis stage. We accounted for baseline fibrosis severity using FIB4 score which is well-validated for ruling out advanced fibrosis and is part of major society clinical care pathways 33, and to our knowledge there are no available cohorts of patients with transient elastography or histology of comparable size to our cohorts.
In summary, risk of cirrhosis among patients with NAFLD without baseline advanced fibrosis can be stratified using three readily available clinical datapoints: BMI, diabetes status, and ALT level. PNPLA3 genotype can further refine risk stratification. We suggest that patients with indeterminate FIB4 and metabolic risk factors (especially diabetes) routinely undergo PNPLA3 genotyping, followed by referral to hepatology if the rs738409-GG allele is present (Figure 3).
Supplementary Material
Acknowledgements:
The authors acknowledge the Michigan Genomics Initiative participants, Precision Health at the University of Michigan, the University of Michigan Medical School Central Biorepository, the University of Michigan Medical School Data Office for Clinical and Translational Research, and the University of Michigan Advanced Genomics Core for providing data and specimen storage, management, processing, and distribution services, and the Center for Statistical Genetics in the Department of Biostatistics at the School of Public Health for genotype data curation, imputation, and management in support of the research reported in this manuscript.
Grant support:
VLC was supported in part by a Clinical, Translational and Outcomes Research Award from the American Association for the Study of Liver Diseases and K08 DK132312. EKS, YC, XD, and AO are supported by NIH grants R01 DK106621, R01 DK107904 (to EKS) and The University of Michigan Department of Internal Medicine.
Abbreviations:
- ALT
alanine aminotransferase
- CI
confidence interval
- FIB4
Fibrosis-4
- HR
hazard ratio
- MGI
Michigan Genomics Initiative
- NAFLD
non-alcoholic fatty liver disease
- PRS
polygenic risk score
- PY
person-year
- UKBB
UK Biobank
- ULN
upper limit of normal
Footnotes
Disclosures: Vincent Chen, Antonino Oliveri, Matthew Miller, Karn Wijarnpreecha, Xiaomeng Du, Yanhua Chen, Kelly Cushing, Anna Lok, and Elizabeth Speliotes: nothing to disclose
Writing assistance: none
Data transparency: Individual-level data will not be made publicly available due to privacy restrictions for Michigan Genomics Initiative and UK Biobank. Full UK Biobank data are available to the public upon application.
REFERENCES
Author names in bold designate shared co-first authorship.
- 1.Chalasani N, Younossi Z, Lavine JE, et al. The diagnosis and management of nonalcoholic fatty liver disease: Practice guidance from the American Association for the Study of Liver Diseases. Hepatology 2018;67:328–357. [DOI] [PubMed] [Google Scholar]
- 2.Alvarez CS, Graubard BI, Thistle JE, et al. Attributable Fractions of NAFLD for Mortality in the United States: Results From NHANES III With 27 Years of Follow-up. Hepatology 2019;n/a. [DOI] [PMC free article] [PubMed] [Google Scholar]
- 3.Younossi ZM, Blissett D, Blissett R, et al. The economic and clinical burden of nonalcoholic fatty liver disease in the United States and Europe. Hepatology 2016;64:1577–1586. [DOI] [PubMed] [Google Scholar]
- 4.Canbay A, Kachru N, Haas JS, et al. Patterns and predictors of mortality and disease progression among patients with non-alcoholic fatty liver disease. Alimentary Pharmacology & Therapeutics 2020;52:1185–1194. [DOI] [PubMed] [Google Scholar]
- 5.Marengo A, Jouness RI, Bugianesi E. Progression and Natural History of Nonalcoholic Fatty Liver Disease in Adults. Clin Liver Dis 2016;20:313–24. [DOI] [PubMed] [Google Scholar]
- 6.Vilar-Gomez E, Calzadilla-Bertot L, Wai-Sun Wong V, et al. Fibrosis Severity as a Determinant of Cause-Specific Mortality in Patients With Advanced Nonalcoholic Fatty Liver Disease: A Multi-National Cohort Study. Gastroenterology 2018;155:443–457 e17. [DOI] [PubMed] [Google Scholar]
- 7.Ekstedt M, Hagstrom H, Nasr P, et al. Fibrosis stage is the strongest predictor for disease-specific mortality in NAFLD after up to 33 years of follow-up. Hepatology 2015;61:1547–54. [DOI] [PubMed] [Google Scholar]
- 8.Barritt AS, Watkins S, Gitlin N, et al. Patient Determinants for Histologic Diagnosis of NAFLD in the Real World: A TARGET-NASH Study. Hepatology Communications 2021;n/a. [DOI] [PMC free article] [PubMed] [Google Scholar]
- 9.Kanwal F, Kramer JR, Li L, et al. Effect of Metabolic Traits on the Risk of Cirrhosis and Hepatocellular Cancer in Nonalcoholic Fatty Liver Disease. Hepatology 2020;71:808–819. [DOI] [PubMed] [Google Scholar]
- 10.Hagstrom H, Nasr P, Ekstedt M, et al. Fibrosis stage but not NASH predicts mortality and time to development of severe liver disease in biopsy-proven NAFLD. J Hepatol 2017;67:1265–1273. [DOI] [PubMed] [Google Scholar]
- 11.Jarvis H, Craig D, Barker R, et al. Metabolic risk factors and incident advanced liver disease in non-alcoholic fatty liver disease (NAFLD): A systematic review and meta-analysis of population-based observational studies. PLoS Med 2020;17:e1003100. [DOI] [PMC free article] [PubMed] [Google Scholar]
- 12.Chen VL, Chen Y, Du X, et al. Genetic variants that associate with cirrhosis have pleiotropic effects on human traits. Liver International 2019;40:405–415. [DOI] [PMC free article] [PubMed] [Google Scholar]
- 13.Chen VL, Du X, Chen Y, et al. Genome-wide association study of serum liver enzymes implicates diverse metabolic and liver pathology. Nature Communications 2021;12:816. [DOI] [PMC free article] [PubMed] [Google Scholar]
- 14.Loomba R, Schork N, Chen CH, et al. Heritability of Hepatic Fibrosis and Steatosis Based on a Prospective Twin Study. Gastroenterology 2015;149:1784–93. [DOI] [PMC free article] [PubMed] [Google Scholar]
- 15.Barata L, Feitosa MF, Bielak LF, et al. Insulin Resistance Exacerbates Genetic Predisposition to Nonalcoholic Fatty Liver Disease in Individuals Without Diabetes. Hepatol Commun 2019;3:894–907. [DOI] [PMC free article] [PubMed] [Google Scholar]
- 16.Emdin CA, Haas M, Ajmera V, et al. Association of genetic variation with cirrhosis: a multi-trait genome-wide association and gene-environment interaction study. Gastroenterology 2020. [DOI] [PMC free article] [PubMed] [Google Scholar]
- 17.Buch S, Stickel F, Trepo E, et al. A genome-wide association study confirms PNPLA3 and identifies TM6SF2 and MBOAT7 as risk loci for alcohol-related cirrhosis. Nat Genet 2015;47:1443–8. [DOI] [PubMed] [Google Scholar]
- 18.Stickel F, Buch S, Nischalke HD, et al. Genetic variants in PNPLA3 and TM6SF2 predispose to the development of hepatocellular carcinoma in individuals with alcohol-related cirrhosis. Am J Gastroenterol 2018;113:1475–1483. [DOI] [PubMed] [Google Scholar]
- 19.Horton R, Crawford G, Freeman L, et al. Direct-to-consumer genetic testing. BMJ 2019;367:l5688. [DOI] [PMC free article] [PubMed] [Google Scholar]
- 20.Dey R, Schmidt EM, Abecasis GR, et al. A Fast and Accurate Algorithm to Test for Binary Phenotypes and Its Application to PheWAS. Am J Hum Genet 2017;101:37–49. [DOI] [PMC free article] [PubMed] [Google Scholar]
- 21.Sudlow C, Gallacher J, Allen N, et al. UK biobank: an open access resource for identifying the causes of a wide range of complex diseases of middle and old age. PLoS Med 2015;12:e1001779. [DOI] [PMC free article] [PubMed] [Google Scholar]
- 22.Kitamoto A, Kitamoto T, Nakamura T, et al. Association of polymorphisms in GCKR and TRIB1 with nonalcoholic fatty liver disease and metabolic syndrome traits. Endocr J 2014;61:683–9. [DOI] [PubMed] [Google Scholar]
- 23.Palmer ND, Kahali B, Kuppa A, et al. Allele-specific variation at APOE increases nonalcoholic fatty liver disease and obesity but decreases risk of Alzheimer’s disease and myocardial infarction. Hum Mol Genet 2021;30:1443–1456. [DOI] [PMC free article] [PubMed] [Google Scholar]
- 24.Speliotes EK, Yerges-Armstrong LM, Wu J, et al. Genome-wide association analysis identifies variants associated with nonalcoholic fatty liver disease that have distinct effects on metabolic traits. PLoS Genet 2011;7:e1001324. [DOI] [PMC free article] [PubMed] [Google Scholar]
- 25.Abul-Husn NS, Cheng X, Li AH, et al. A Protein-Truncating HSD17B13 Variant and Protection from Chronic Liver Disease. N Engl J Med 2018;378:1096–1106. [DOI] [PMC free article] [PubMed] [Google Scholar]
- 26.DiBattista JV, Burkholder DA, Lok AS, et al. Accuracy of Non-invasive Indices for Diagnosing Hepatic Steatosis Compared to Imaging in a Real-World Cohort. Digestive Diseases and Sciences 2022. [DOI] [PubMed] [Google Scholar]
- 27.Vujkovic M, Ramdas S, Lorenz KM, et al. A multiancestry genome-wide association study of unexplained chronic ALT elevation as a proxy for nonalcoholic fatty liver disease with histological and radiological validation. Nat Genet 2022. [DOI] [PMC free article] [PubMed] [Google Scholar]
- 28.Kanwal F, Kramer JR, Mapakshi S, et al. Risk of Hepatocellular Cancer in Patients With Non-Alcoholic Fatty Liver Disease. Gastroenterology 2018;155:1828–1837 e2. [DOI] [PMC free article] [PubMed] [Google Scholar]
- 29.Mapakshi S, Kramer JR, Richardson P, et al. Positive Predictive Value of International Classification of Diseases, 10th Revision, Codes for Cirrhosis and Its Related Complications. Clin Gastroenterol Hepatol 2018;16:1677–1678. [DOI] [PubMed] [Google Scholar]
- 30.Burkholder DA, Moran IJ, DiBattista JV, et al. Accuracy of International Classification of Diseases-10 Codes for Cirrhosis and Portal Hypertensive Complications. Dig Dis Sci 2021. [DOI] [PubMed] [Google Scholar]
- 31.Kim HS, Xiao X, Byun J, et al. Synergistic Associations of PNPLA3 I148M Variant, Alcohol Intake, and Obesity With Risk of Cirrhosis, Hepatocellular Carcinoma, and Mortality. JAMA Netw Open 2022;5:e2234221. [DOI] [PMC free article] [PubMed] [Google Scholar]
- 32.Xiao G, Zhu S, Xiao X, et al. Comparison of laboratory tests, ultrasound, or magnetic resonance elastography to detect fibrosis in patients with nonalcoholic fatty liver disease: A meta-analysis. Hepatology 2017;66:1486–1501. [DOI] [PubMed] [Google Scholar]
- 33.Kanwal F, Shubrook JH, Adams LA, et al. Clinical Care Pathway for the Risk Stratification and Management of Patients With Nonalcoholic Fatty Liver Disease. Gastroenterology 2021;161:1657–1669. [DOI] [PMC free article] [PubMed] [Google Scholar]
- 34.Kamarudin AN, Cox T, Kolamunnage-Dona R. Time-dependent ROC curve analysis in medical research: current methods and applications. BMC Med Res Methodol 2017;17:53. [DOI] [PMC free article] [PubMed] [Google Scholar]
- 35.Bycroft C, Freeman C, Petkova D, et al. The UK Biobank resource with deep phenotyping and genomic data. Nature 2018;562:203–209. [DOI] [PMC free article] [PubMed] [Google Scholar]
- 36.Zawistowski M, Fritsche LG, Pandit A, et al. The Michigan Genomics Initiative: a biobank linking genotypes and electronic clinical records in Michigan Medicine patients. medRxiv 2021:2021.12.15.21267864. [DOI] [PMC free article] [PubMed] [Google Scholar]
- 37.Brenner H, Gefeller O. Variation of Sensitivity, Specificity, Likelihood Ratios and Predictive Values with Disease Prevalence. Statistics in Medicine 1997;16:981–991. [DOI] [PubMed] [Google Scholar]
- 38.DeLong ER, DeLong DM, Clarke-Pearson DL. Comparing the areas under two or more correlated receiver operating characteristic curves: a nonparametric approach. Biometrics 1988;44:837–45. [PubMed] [Google Scholar]
- 39.Fine JP, Gray RJ. A proportional hazards model for the subdistribution of a competing risk. J Am Stat Assoc 1999;94:496–509. [Google Scholar]
- 40.Gray RJ. A class of K-sample tests for comparing the cumulative incidence of a competing risk. Ann Stat 1988:1141–1154. [Google Scholar]
- 41.Satagopan JM, Ben-Porat L, Berwick M, et al. A note on competing risks in survival data analysis. Br J Cancer 2004;91:1229–35. [DOI] [PMC free article] [PubMed] [Google Scholar]
- 42.Dobson AJ, Kuulasmaa K, Eberle E, et al. Confidence intervals for weighted sums of Poisson parameters. Statistics in medicine 1991;10:457–462. [DOI] [PubMed] [Google Scholar]
- 43.Sedgwick P Incidence rate ratio. BMJ 2010;341. [DOI] [PubMed] [Google Scholar]
- 44.Pintilie M Competing risks: a practical perspective: John Wiley & Sons, 2006. [Google Scholar]
- 45.Valenti L, Al-Serri A, Daly AK, et al. Homozygosity for the patatin-like phospholipase-3/adiponutrin I148M polymorphism influences liver fibrosis in patients with nonalcoholic fatty liver disease. Hepatology 2010;51:1209–17. [DOI] [PubMed] [Google Scholar]
- 46.Xia M, Ma S, Huang Q, et al. NAFLD-related gene polymorphisms and all-cause and cause-specific mortality in an Asian population: the Shanghai Changfeng Study. Aliment Pharmacol Ther 2022;55:705–721. [DOI] [PubMed] [Google Scholar]
- 47.Grimaudo S, Pipitone RM, Pennisi G, et al. Association Between PNPLA3 rs738409 C>G Variant and Liver-Related Outcomes in Patients With Nonalcoholic Fatty Liver Disease. Clin Gastroenterol Hepatol 2020;18:935–944 e3. [DOI] [PubMed] [Google Scholar]
- 48.Bianco C, Jamialahmadi O, Pelusi S, et al. Non-invasive stratification of hepatocellular carcinoma risk in non-alcoholic fatty liver using polygenic risk scores. J Hepatol 2021;74:775–782. [DOI] [PMC free article] [PubMed] [Google Scholar]
- 49.Martin AR, Kanai M, Kamatani Y, et al. Clinical use of current polygenic risk scores may exacerbate health disparities. Nat Genet 2019;51:584–591. [DOI] [PMC free article] [PubMed] [Google Scholar]
- 50.Fry A, Littlejohns TJ, Sudlow C, et al. Comparison of Sociodemographic and Health-Related Characteristics of UK Biobank Participants With Those of the General Population. Am J Epidemiol 2017;186:1026–1034. [DOI] [PMC free article] [PubMed] [Google Scholar]
- 51.Allen AM, Therneau TM, Larson JJ, et al. Nonalcoholic fatty liver disease incidence and impact on metabolic burden and death: A 20 year-community study. Hepatology 2018;67:1726–1736. [DOI] [PMC free article] [PubMed] [Google Scholar]
- 52.Serper M, Vujkovic M, Kaplan DE, et al. Validating a non-invasive, ALT-based non-alcoholic fatty liver phenotype in the million veteran program. PLoS One 2020;15:e0237430. [DOI] [PMC free article] [PubMed] [Google Scholar]
- 53.Zhang X, Wong GL, Yip TC, et al. Risk of liver-related events by age and diabetes duration in patients with diabetes and nonalcoholic fatty liver disease. Hepatology 2022. [DOI] [PubMed] [Google Scholar]
Associated Data
This section collects any data citations, data availability statements, or supplementary materials included in this article.