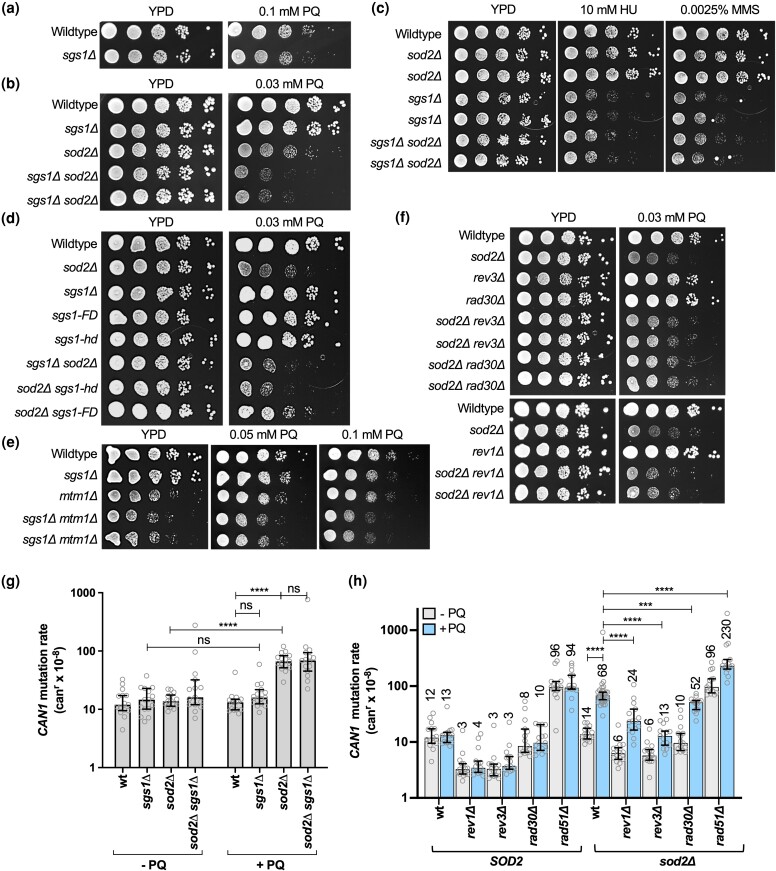
Fig. 4.
Sensitivity to DNA damage, replication stress, oxidative stress, and level of genome instability of cells lacking Sgs1 and Sod2 activities. a) Spot assay to determine the sensitivity of the sgs1Δ mutant to PQ. Ten-fold-dilutions of exponentially growing cell cultures were spotted on YPD or on YPD supplemented with 0.1 mM PQ and incubated at 30°. b) Spot assay to determine the sensitivity of the sgs1Δ sod2Δ mutant to PQ. Ten-fold-dilutions of exponentially growing cell cultures were spotted on YPD or YPD supplemented with 0.03 mM PQ and incubated at 30°. c) Spot assay to determine the sensitivity of the sgs1Δ sod2Δ mutant to HU and MMS. Ten-fold-dilutions of exponentially growing cell cultures were spotted on YPD or YPD supplemented with the indicated concentrations of HU or MMS and incubated at 30°. d) Spot assay to determine PQ-sensitivity of the sod2Δ mutant harboring sgs1 mutations that interrupt helicase activity (sgs1-hd) or Rad51-binding (sgs1-FD). Ten-fold-dilutions of exponentially growing cell cultures were spotted on YPD or YPD supplemented with 0.03 mM PQ and incubated at 30°. e) Spot assay to determine PQ-sensitivity of the sgs1Δ mutant with a deletion of MTM1. Ten-fold-dilutions of exponentially growing cell cultures were spotted on YPD or on YPD supplemented with 0.1 mM or 0.05 mM PQ and incubated at 30°. f) Spot assay to determine the effect of rev1Δ, rev3Δ, or rad30Δ mutations on PQ sensitivity of the sod2Δ mutant. Ten-fold-dilutions of exponentially growing cell cultures were spotted on YPD or YPD supplemented with 0.03 mM PQ and incubated at 30°. g) Rates of accumulating inactivating mutations in CAN1 in cells harboring sgs1Δ and/or sod2Δ mutations in the presence or absence of PQ. Rates of accumulating canavanine-resistant (canr) clones were determined from at least 15 cell cultures (gray dots) for each yeast strain in the presence or absence of 0.03 mM PQ. The statistical significance of differences was determined by a Mann–Whitney test and reported as **** P ≤ 0.0001; ns, not significant. Numbers above the columns in the graph indicate the median rate of accumulating mutations conferring resistance to canavanine (per cell/generation, canr×10−8). For a complete list of all canr rates with 95% confidence intervals see also Supplementary Table 5. h) Rates of accumulating inactivating mutations in the CAN1 gene (canr) of sod2Δ mutants harboring deletions of TLS genes (rev1Δ, rev3Δ, rad30Δ) or a homologous recombination gene (rad51Δ) in the presence or absence of PQ. At least 15 cell cultures (gray dots) from 3 isolates for each yeast strain were analyzed. The median rate with 95% confidence intervals is shown. Numbers above the columns in the graph indicate the median rate of accumulating mutations conferring resistance to canavanine (per cell/generation, canr×10−8). For a complete list of all canr rates with 95% confidence intervals see Supplementary Table 5. Statistical significance of differences was determined by a Mann–Whitney U-test and reported as ***P ≤ 0.001; ****P ≤ 0.0001.

