

Abstract
Characterizing trends in mortality rates with consideration of trends in incidence rates at the population level could help identify unmet needs in public health and provide essential indicators of cancer control. In the late 20th century, the arrival of the first molecular targeted agent, rituximab, for non‐Hodgkin lymphoma (NHL) led to a paradigm shift in NHL treatment. However, the public health impact of this arrival has not been fully clarified. Here, we evaluated trends in the mortality and incidence rates of NHL in Japan and the United States. Age‐standardized rates of mortality reversed after the introduction of rituximab, around 2000, beginning to decline significantly with annual percent changes (95% confidence interval) of −2.6% (−3.6% to −1.6%) in Japan and − 3.9% (−4.2% to −3.5%) in the United States. Despite an increase in incidence, the mortality in all age groups weakened the upward trends or decreased in both countries. From a long‐term perspective, the trends in mortality rates differed between the countries. In the United States, the mortality rate has declined continuously since the introduction of rituximab, with a declining incidence rate. In contrast, in Japan, the mortality rate stopped declining and the incidence rate increased remarkably. The introduction of rituximab has had a substantial impact at the population level across a wide range of individuals. To reduce the disease burden in terms of mortality, elucidating risk factors that lead to a decreasing incidence rate is warranted for NHL, as well as further development of novel treatments.
Keywords: incidence rate, Japan, mortality rate, non‐Hodgkin lymphoma, SEER
The arrival of the first molecular targeted agent, rituximab, for non‐Hodgkin lymphoma (NHL) led to a paradigm shift in NHL treatment. Here, we evaluated mortality and incidence rates of NHL in Japan and the United States to understand the public health impact of novel treatments. Despite an increase in incidence, the mortality rates in all age groups weakened the upward trends or decreased in both countries after the introduction of rituximab.
Abbreviations
- AAPC
average annual percent changes
- APC
annual percent changes
- ASR
age‐standardized rates
- MCIJ
Monitoring of Cancer Incidence in Japan
- NHL
non‐Hodgkin lymphoma
- SEER
Surveillance Epidemiology and End Results
1. INTRODUCTION
Cancer is a major cause of death, with approximately 10 million deaths occurring worldwide per year. 1 However, the prognosis for patients has been improving with advances in various treatments. Although survival is undoubtedly an important parameter of cancer prognosis, the improvement in survival estimates may be overestimated by earlier diagnosis without postponing the time of death and increased detection of indolent cancers regardless of the actual clinical impact of treatment. 2 , 3 Characterizing the trend in mortality rates with consideration to that of incidence rates based on unbiased population‐based data could overcome these challenges and provide essential indicators of cancer control and treatment status. 4 After the introduction of a novel agent, evaluation of disease trends to understand its effectiveness may identify specific populations that benefit from the agent, as well as unmet needs. In the late 20th century, the arrival of molecular targeted agents led to a paradigm shift in cancer treatment following their initial application to hematological neoplasms. 5 In particular, these agents led to a decrease in the mortality of chronic myeloid leukemia and multiple myeloma 6 , 7 and provided particular benefit in certain populations that had not benefitted from conventional treatment. 6
Non‐Hodgkin lymphoma (NHL) is the most common hematological malignancy, with an estimated 544,000 new cases worldwide in 2020. 1 The first molecular targeted agent to be introduced was rituximab for the treatment of B‐cell NHL. 8 In Japan, rituximab was approved in August 2001, 9 following a first phase II study started in July 1997. 10 In the United States, rituximab was approved in November 1997, 11 following a first phase II study in August 1993. 12 Following its introduction, many clinical trials and hospital‐based studies showed improved survival rates in B‐cell NHL. 13 , 14 , 15 , 16 , 17 Nevertheless, the public health impact of this novel agent in NHL, the most common hematological malignancy, has not been fully evaluated.
Here, we evaluated the mortality rate of NHL in Japan and the United States in consideration of the incidence rate to identify unmet needs at the general population level and provide evidence for further disease control.
2. MATERIALS AND METHODS
2.1. Data sources
2.1.1. Mortality
Mortality analysis was conducted using national mortality data for Japan and the United States. We obtained the number of deaths from NHL in Japan from Vital Statistics Japan (Ministry of Health, Labour and Welfare) and extracted publicly available NHL mortality data in the United States collected by the National Center for Health Statistics from the National Cancer Institute Surveillance Epidemiology and End Results (SEER) database using SEER*Stat. 18 For both the Japanese and United States mortality data, deaths from NHL were defined according to SEER Cause of Death Recode (ICD‐9: 200, 202.0–202.2, 202.8–202.9; ICD‐10: C82‐C86, C96.3). 19 The period specified for mortality analysis was 1993–2015 in Japan and 1985–2015 in the United States, which included the period of introduction of rituximab. The observed period of mortality data in Japan corresponded to the observed period of available incidence data provided by the Monitoring of Cancer Incidence in Japan (MCIJ) project. 20
2.1.2. Incidence
Incidence analysis was performed using population‐based cancer registry data for Japan and the United States. We obtained Japanese incidence data from the MCIJ project in 2015. Among these, we selected 13 prefectural cancer registries (Miyagi, Yamagata, Chiba, Kanagawa, Niigata, Fukui, Aichi, Shiga, Osaka, Tottori, Yamaguchi, Nagasaki, and Kumamoto) that consistently registered NHL to the MCIJ project during the specified period. These data covered 35.8% of the total Japanese population in 2015, providing reasonably comprehensive coverage of both rural and urban areas in Japan. We also extracted the United States incidence data from the SEER 9 cancer database through SEER*stat, 21 which covers nine high‐quality registries (Atlanta, Connecticut, Detroit, Hawaii, Iowa, New Mexico, San Francisco‐Oakland, Seattle‐Puget Sound, and Utah) that accounted for 9.4% of the total United States population in 2015. The cancer incidence in these areas is largely comparable to those throughout the rest of the United States. 22 Patients with NHL in Japan and the United States were defined as those registered with 9590/3, 9591/3, 9596/3, 9597/3, 9599/3, 9670/3–9719/3, 9724/3–9729/3, 9735/3, 9737/3, 9737/3, 9738/3, 9755/3–9759/3, and 9970/3 (ICD‐O‐3), which correspond to the mortality codes for NHL. The period specified for incidence analysis was 1993–2015 in Japan and 1985–2015 in the United States, the same as the period of mortality analysis.
2.1.3. Population
We used population data to calculate the mortality and incidence rates of NHL collected by Vital Statistics Japan (Ministry of Health, Labour and Welfare) from the Cancer Information Service of the National Cancer Center, Japan, 23 namely, Japanese population data to determine mortality and total population data to determine incidence. Further, we extracted total United States population data from the SEER database using SEER*Stat. 24
2.2. Statistical analysis
We calculated annual age‐standardized rates (ASRs; standardized by the world standard population) 25 for mortality and incidence of NHL. We analyzed the trends in mortality and incidence rates and calculated annual percent changes (APCs) and average annual percent changes (AAPCs) 26 using a joinpoint regression model. This model has been described in detail elsewhere. 27 In brief, joinpoint regression is a statistical method that analyses trends of change in a consecutive segment, identifies the best model, and evaluates the significance of the increase or decrease within each segment. For analysis, uncorrelated error models were used. We set the minimum number of joinpoints in the model as zero and the maximum number as three. The standard error was estimated for each year. In describing the trends, we defined an increase or decrease as occurring when the APC or AAPC of the trends was statistically significant; otherwise, we defined the trend as stable. We also performed stratified analysis by age category, classified as age 0–49, 50–59, 60–69, 70–79, and 80 years or older. Two‐sided p‐values <0.05 were considered statistically significant. All analyses were performed using Stata, version 15.1 software (Stata, College Station, TX), except for the joinpoint regression analysis, for which we used the Joinpoint Regression Program, version 4.6.0.0 (US National Cancer Institute, Bethesda, MD).
3. RESULTS
Characteristics of the subjects are shown in Table 1. A total of 195,817 patients in Japan and 632,173 patients in the United States died of NHL during the period. The proportion of males was higher for mortality and incidence rates in both countries. The mortality and incidence rates in patients aged over 70 years were higher in Japan (mortality, 67.1%; incidence, 50.3%) than in the United States (mortality, 60.9%; incidence, 42.2%).
TABLE 1.
Subject characteristics.
| Japan | US | |||
|---|---|---|---|---|
| Mortality | Incidence a | Mortality | Incidence b | |
| N = 195,817 | N = 129,187 | N = 632,173 | N = 155,667 | |
| Age (%) | ||||
| 0–49 | 11,136 (5.7) | 14,522 (11.2) | 57,978 (9.2) | 31,295 (20.1) |
| 50–59 | 16,810 (8.6) | 18,188 (14.1) | 64,846 (10.3) | 24,969 (16.0) |
| 60–69 | 36,520 (18.7) | 31,530 (24.4) | 124,193 (19.6) | 33,635 (21.6) |
| 70–79 | 61,644 (31.5) | 37,862 (29.3) | 189,838 (30.0) | 37,772 (24.3) |
| 80+ | 69,707 (35.6) | 27,085 (21.0) | 195,318 (30.9) | 27,996 (18.0) |
| Sex (%) | ||||
| Male | 111,556 (57.0) | 71,068 (55.0) | 334,678 (52.9) | 85,273 (54.8) |
| Female | 84,261 (43.0) | 58,119 (45.0) | 297,495 (47.1) | 70,394 (45.2) |
Incidence data for Japan were obtained from 13 registries (Miyagi, Yamagata, Chiba, Kanagawa, Niigata, Fukui, Aichi, Shiga, Osaka, Tottori, Yamaguchi, Nagasaki, and Kumamoto).
Incidence data for the United States were obtained from nine registries (Atlanta, Connecticut, Detroit, Hawaii, Iowa, New Mexico, San Francisco‐Oakland, Seattle‐Puget Sound, and Utah).
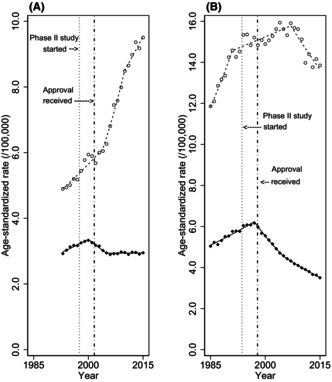
The trends in age‐standardized mortality and incidence rates estimated by the joinpoint regression analysis are shown in Table 2 and summarized in Figure 1, and trends for ASRs by sex are summarized in Table S1 and Figure S1. In Japan, the ASR of mortality began to decline in 2000 with an APC of −2.6% (95% confidence interval (CI), −3.6% to −1.6%), following an upward trend in mortality (APC, 1.7%; 95% CI, 1.3%–2.2%) (joinpoints and their 95% CIs are shown in Table S2). Similarly, in the United States, the ASR of mortality began to decline in 1997 with APC of −3.9% (95% CI, −4.2% to −3.5%), following an upward trend in mortality (APC, 1.7%; 95% CI, 1.5%–1.9%). In both countries, incidence rates were increasing at the point that mortality rates began to decline. As shown in Figure 1, the change in mortality trends in both countries appeared to coincide with the timing of the introduction of rituximab. The trend in ASR of mortality in the United States was a consistent decline after 1997, while the trend in ASR of mortality in Japan became stable in 2005. In Japan, the ASR of mortality became stable (APC, 0.0%; 95% CI, −0.2% to 0.3%) in 2005, along with a remarkable upward trend in incidence. In the United States, the ASR of mortality continues to decline (APC, −2.6%; 95% CI, −2.8% to −2.3%), with a weakened upward or downward trend in incidence.
TABLE 2.
Trends in age‐standardized mortality and incidence rate.
| AAPC (95% CI) | Trend 1 | Trend 2 | Trend 3 | ||||||||
|---|---|---|---|---|---|---|---|---|---|---|---|
| Year | APC (95% CI) | Year | APC (95% CI) | Year | APC (95% CI) | ||||||
| Japan | |||||||||||
| Mortality | −0.1 | (−0.3 to 0.2) | 1993–2000 | 1.7 | (1.3–2.2) | 2000–2005 | −2.6 | (−3.6 to − 1.6) | 2005–2015 | 0.0 | (−0.2 to 0.3) |
| Incidence | 3.1 | (2.5–3.6) | 1993–2004 | 2.0 | (1.4–2.6) | 2004–2010 | 5.7 | (4.0–7.4) | 2010–2015 | 2.3 | (0.9‐3.7) |
| United States | |||||||||||
| Mortality | −1.2 | (−1.4 to − 1.1) | 1985–1997 | 1.7 | (1.5–1.9) | 1997–2005 | −3.9 | (−4.2 to − 3.5) | 2005–2015 | −2.6 | (−2.8 to − 2.3) |
| Incidence | 0.5 | (0.1–0.8) | 1985–1991 | 3.5 | (2.2–4.9) | 1991–2007 | 0.5 | (0.2–0.8) | 2007–2015 | −1.8 | (−2.4 to − 1.2) |
Note: Significant differences from zero (two‐sided p < 0.05, calculated using a t‐test) are highlighted in bold. Japan: phase II study of rituximab was started in July 1997, and approval was received in August 2001. United States; phase II study of rituximab was started in Aug 1993, and approval was received in November 1997.
Abbreviations: AAPC, average annual percent change, APC, annual percent change; CI, confidence interval.
FIGURE 1.
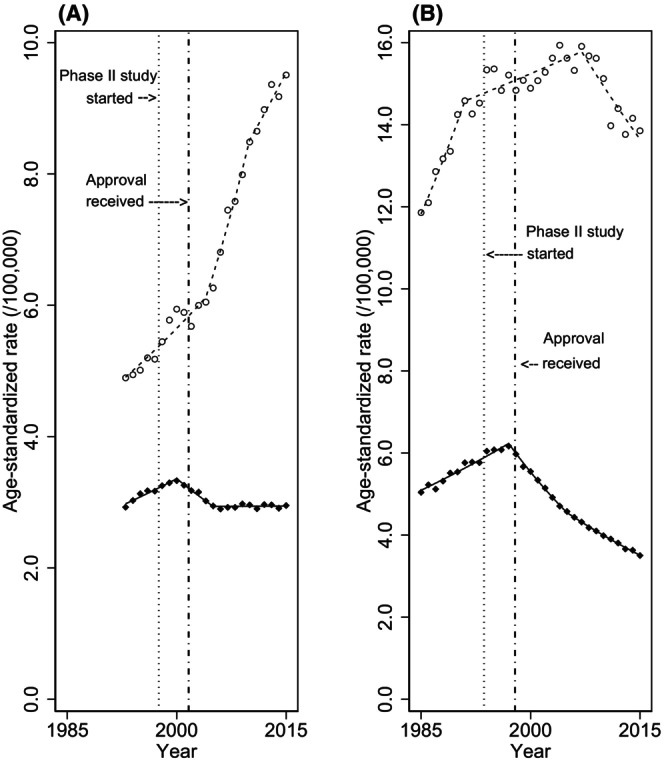
Overall trends in age‐standardized mortality and incidence rates of non‐Hodgkin lymphoma. Overall trends in age‐standardized mortality and incidence rates of non‐Hodgkin lymphoma in (A) Japan and (B) the United States. World standard population was applied. Black diamonds indicate the observed mortality rate, white circles indicate the observed incidence rate, and lines indicate modeled rates estimated by joinpoint regression analysis. Vertical lines on the left show the first phase II study of rituximab, and those on right show the approval of rituximab.
The trends in age‐specific mortality and incidence rate evaluated by joinpoint regression analysis are shown in Table 3 and Figure 2. In Japan, mortality rates began to decline around 2000 among patients aged under 70 years with an upward trend in incidence. The declining trends in mortality rates include an APC of −7.1% (95% CI, −12.5% to −1.4%) in patients aged 0–49 years, −1.9% (95% CI, −2.3% to −1.4%) in those aged 50–59 years, and − 3.1% (95% CI, −3.8% to −2.4%) in those aged 60–69 years. In contrast, mortality rates in patients within the two age categories of 70 years or older did not decline over the observation period. However, the upward trend in the mortality rate among patients aged 70–79 years became stable in 2005, and that for those aged 80 years or older continued but weakened the upward trend.
TABLE 3.
Trends in age‐specific mortality and incidence rate.
| AAPC (95% CI) | Trend 1 | Trend 2 | Trend 3 | Trend 4 | ||||||||||
|---|---|---|---|---|---|---|---|---|---|---|---|---|---|---|
| Year | APC (95% CI) | Year | APC (95% CI) | Year | APC (95% CI) | Year | APC (95% CI) | |||||||
| Japan | ||||||||||||||
| 0–49 | ||||||||||||||
| Mortality | −3.0 | (−4.2 to − 1.9) | 1993–2000 | −0.1 | (−1.5 to 1.3) | 2000–2004 | −7.1 | (−12.5 to − 1.4) | 2004–2015 | −3.3 | (−4.3 to − 2.3) | |||
| Incidence | 2.4 | (1.6–3.1) | 1993–2002 | 0.9 | (−0.6 to 2.4) | 2002–2015 | 3.4 | (2.6–4.2) | ||||||
| 50–59 | ||||||||||||||
| Mortality | −0.9 | (−1.5 to − 0.3) | 1993–1999 | 1.9 | (−0.1 to 4.0) | 1999–2015 | −1.9 | (−2.3 to − 1.4) | ||||||
| Incidence | 4.0 | (2.8–5.3) | 1993–2005 | 3.4 | (2.8–3.9) | 2005–2008 | 11.5 | (3.8–19.9) | 2008–2012 | 4.3 | (0.8–8.0) | 2012–2015 | −0.8 | (−4.1 to 2.6) |
| 60–69 | ||||||||||||||
| Mortality | −0.5 | (−0.9 to 0.0) | 1993–1999 | 1.8 | (0.6–3.0) | 1999–2008 | −3.1 | (−3.8 to − 2.4) | 2008–2015 | 1.1 | (0.2–2.0) | |||
| Incidence | 3.3 | (2.3–4.3) | 1993–2000 | 2.7 | (1.3–4.0) | 2000–2004 | −0.5 | (−4.8 to 3.9) | 2004–2012 | 6.3 | (5.3–7.3) | 2012–2015 | 2.2 | (−0.9 to 5.4) |
| 70–79 | ||||||||||||||
| Mortality | 0.4 | (−0.2 to 1.1) | 1993–2002 | 2.0 | (1.4 to 2.6) | 2002–2005 | −2.8 | (−7.6 to 2.3) | 2005–2015 | 0.0 | (−0.3 to 0.4) | |||
| Incidence | 3.7 | (3.4–4.0) | 1993–2015 | 3.7 | (3.4–4.0) | |||||||||
| 80+ | ||||||||||||||
| Mortality | 2.6 | (2.1–3.1) | 1993–1996 | 5.7 | (2.3–9.1) | 1996–2005 | 1.5 | (0.9–2.1) | 2005–2015 | 2.7 | (2.4–3.0) | |||
| Incidence | 3.7 | (3.4–4.0) | 1993–2015 | 3.7 | (3.4–4.0) | |||||||||
| United States | ||||||||||||||
| 0–49 | ||||||||||||||
| Mortality | −2.8 | (−3.7 to − 1.9) | 1985–1996 | 2.3 | (1.6–2.9) | 1996–1999 | −10.4 | (−18.1 to − 2.0) | 1999–2015 | −4.7 | (−5.2 to −4.3) | |||
| Incidence | 0.2 | (−0.9 to 1.2) | 1985–1994 | 5.9 | (4.5–7.4) | 1994–1998 | −6.4 | (−12.3 to −0.1) | 1998–2008 | 0.4 | (−0.9 to −2.6) | 2008–2015 | −3.4 | (−5.2 to −1.5) |
| 50–59 | ||||||||||||||
| Mortality | −2.3 | (−2.6 to −2.1) | 1985–1997 | 0.9 | (0.6–1.2) | 1997–2006 | −5.8 | (−6.3 to −5.3) | 2006–2015 | −3.1 | (−3.6 to −2.6) | |||
| Incidence | 0.1 | (−0.3 to 0.4) | 1985–2003 | 0.9 | (0.5–1.4) | 2003–2015 | −1.2 | (−1.9 to −0.6) | ||||||
| 60–69 | ||||||||||||||
| Mortality | −1.8 | (−2.0 to −1.5) | 1985–1997 | 1.6 | (1.3–1.9) | 1997–2007 | −4.6 | (−5.1 to −4.1) | 2007–2015 | −3.2 | (−3.7 to −2.6) | |||
| Incidence | 0.4 | (0.1–0.7) | 1985–2003 | 1.6 | (1.2–2.0) | 2003–2015 | −1.4 | (−1.9 to −0.8) | ||||||
| 70–79 | ||||||||||||||
| Mortality | −0.7 | (−0.8 to −0.7) | 1985–1997 | 2.4 | (2.2–2.6) | 1997–2015 | −2.8 | (−2.9 to −2.7) | ||||||
| Incidence | 0.9 | (0.5–1.0) | 1985–2005 | 1.9 | (1.7–2.2) | 2005–2015 | −1.5 | (−2.1 to −0.9) | ||||||
| 80+ | ||||||||||||||
| Mortality | 0.8 | (0.6–1.0) | 1985–1989 | 4.7 | (3.5–5.9) | 1989–1998 | 2.3 | (2.0–2.7) | 1998–2015 | −0.9 | (−1.0 to −0.8) | |||
| Incidence | 1.0 | (0.7–1.3) | 1985–2007 | 2.0 | (1.7–2.3) | 2007–2015 | −1.8 | (−2.7 to −0.9) | ||||||
Note: Significant differences from zero (two‐sided p < 0.05, calculated using a t‐test) are highlighted in bold. Japan: phase II study of rituximab was started in July 1997, and approval was received in August 2001. United States: phase II study of rituximab was started in Aug 1993, and approval was received in November 1997.
Abbreviations: AAPC, average annual percent change, APC, annual percent change; CI, confidence interval.
FIGURE 2.
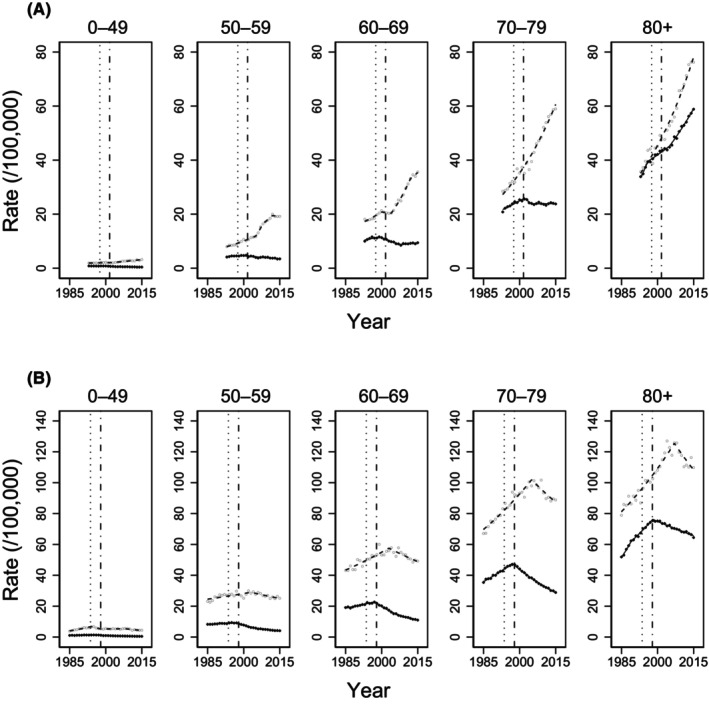
Age‐specific trends in mortality and incidence rate of non‐Hodgkin lymphoma. Age‐specific mortality and incidence rate of non‐Hodgkin lymphoma in (A) Japan and (B) the United States. Black diamonds indicate the observed mortality rate, white circles indicate the observed incidence rate, and lines indicate modeled rates estimated by joinpoint regression analysis. Vertical lines on the left show the first phase II study of rituximab, and those on the right reflect the approval of rituximab.
In the United States, the mortality rate began to decline in the late 1990s for all age categories, following an upward trend in mortality. The declining trend in mortality rate included an APC of −10.4% (95% CI, −18.1% to −2.0%) in patients aged 0–49 years, −5.8% (95% CI, −6.3% to −5.3%) in those aged 50–59 years, −4.6% (95% CI, −5.1% to −4.1%) in those aged 60–69 years, −2.8% (95% CI, −2.9% to −2.7%) in those aged 70–79 years, and − 0.9% (95% CI, −1.0% to −0.8%) in those aged 80 years or older. Mortality rates have consistently declined since the late 1990s in all age categories. Incidence rates began to decline in patients aged 0–49 years in 1994 and in all age categories in the mid‐2000s.
4. DISCUSSION
The ASR of mortality in Japan and United States reversed to a significant decline in 2000 and 1997, respectively, following preceding upward trends. The changes in mortality trends in both countries coincided with the introduction of rituximab. Despite the increase in all age‐specific incidences, the mortality across all age groups weakened the upward trends or decreased in both countries. These findings show that the burden of disease in terms of the mortality rate of NHL has been reduced at the general population level across a wide range of individuals following the introduction of rituximab. To our knowledge, this is the first study to evaluate the trend in mortality of NHL in Japan and the United States in the rituximab era.
Regarding Japan, the ASR of overall mortality became stable in 2005, following decreasing trends. This may be because, in the years following the introduction of rituximab, the dramatic decrease in deaths attributable to the avoidance of deaths by rituximab outweighed the increase in deaths associated with the increase in incidence, whereas after 2005, the incidence and mortality balanced out. The incidence of T/NK‐cell NHL, which does not respond to rituximab, is higher in Japan than in the United States. 28 However, the proportion of T/NK‐cell NHL in this study was consistent at around 12% in Japan over the observation period (Figure S2). Therefore, it is unlikely that the mortality rate leveled off due to the increasing incidence of T/NK‐cell NHL. Given that the mortality rate has leveled off despite a notable increase in incidence rate, the introduction of rituximab appears to have profoundly impacted disease control in lymphoma.
In a situation with a stable trend in the mortality rate but an increasing incidence rate, it is necessary to consider the possibility that the actual occurrence has not changed and the incidence rate has only been increasing due to overdiagnosis. 4 This possibility is not applicable to the present trends in Japan for two reasons. First, it is unlikely that the apparent increase in incidence is due to improved registration quality. Although registration quality has indeed improved, and the number of registrations has increased since 2005 in Japan, 20 we observed the same increasing trends in incidence with the same evaluation in very high‐quality registries after 2007 (APC, 3.4% [95% CI, 2.3%–4.4%]). Second, actual occurrence has clearly been increasing because the mortality rate, which has considerably high accuracy in Japan, is increasing in parallel with the increase in the number of patients aged 80 years or older. Accordingly, the observed incidence rate in Japan should be interpreted as the incidence of clinically meaningful occurrence. 4
In the United States, the mortality rate has declined since the introduction of rituximab, as in Japan. However, there is one difference in the trend in the mortality rate: the decline has remained continuous throughout the period since the introduction of rituximab. It is clear from the well‐known example of lung cancer and smoking that reduced exposure to risk factors reduces the mortality rate by decreasing the incidence rate. 29 The continuously declining trend in the mortality rate in the United States may be due to the decreasing trend in the incidence rate since 2007, following an increasing trend. It is expected that the mortality rate in Japan will also further improve when the incidence rate declines in the future. We have speculated that the decreasing trend of incidence in the United States is partially due to the introduction of highly active antiretroviral therapy for HIV infection and that the increasing trend of incidence in Japan is partially due to the Westernization of lifestyles, such as increased meat and fat intake. 28 Evaluation of these associations is inconclusive, however, and further epidemiological studies that lead to a reduction in incidence rate, including the impact of environmental and lifestyle factors, are required.
The major strength of this study is that the use of highly comprehensive population‐based data has allowed us to suggest the remarkable effectiveness of rituximab at the general population level, which unbiasedly included all NHL patients regardless of their characteristics. Our study provides novel evidence of the introduction of novel agents impacting vital statistics.
Some limitations of our study should also be mentioned. First, we could not directly evaluate the association of rituximab with mortality rates because a treatment history with rituximab was unavailable in these population‐based data. The population‐based data used in this study have coarse granularity, which is generally expected to prevent high comprehensiveness. The significance of this study is that we were able to demonstrate the public health benefits of rituximab even without detailed individual treatment histories.
Second, we did not examine each NHL subtype because the diagnostic name on the death certificate during earlier part of the studied period remains vague, such as “non‐Hodgkin lymphoma, unspecified type,” and the death certificate name has not kept pace with the major changes in the NHL classification over the studied period, although the specificity and accuracy of the diagnostic name have improved in the recent period. However, given that the ratio of NHL with known B‐cell and T/NK‐cell in the incidence data was constant and B‐cell NHL accounted for the majority of NHL (Figure S2), most of the results of analyses of NHL overall were likely to be attributed to B‐cell NHL, which is the target of rituximab treatment, and the impact is underestimated. Therefore, the conclusions of this study are likely to remain unchanged.
Third, other factors might have led to bias in the interpretation of our results, such as changes in supportive therapies for NHL. New supportive therapies for NHL treatment might have contributed to the decreasing mortality rate, although this appears unlikely because no new supportive therapies potentially able to explain the observed change in mortality trends have appeared.
In conclusion, we observed a change in the mortality rate of NHL after the introduction of rituximab, the first molecular targeted drug, along with a significant change in incidence rates among all age groups in both countries. This indicates that the introduction of rituximab has had a remarkable impact on vital statistics at the population level across a wide range of individuals. To further reduce the disease burden in terms of mortality in Japan, elucidating risk factors that lead to a reduction in incidence rate is required, in addition to developing further novel treatments.
AUTHOR CONTRIBUTIONS
Yoshiaki Usui: conceptualization, data curation, formal analysis, investigation, methodology, software, visualization, and writing (original draft and reviewing/editing). Hidemi Ito: conceptualization, data curation, funding acquisition, investigation, methodology, project administration, resources, software, validation, supervision, validation, and writing (original draft and reviewing/editing). Kota Katanoda: resources and writing (review and editing). Tomohiro Matsuda: resources and writing (review and editing). Yoshinobu Maeda: supervision and writing (review and editing). Keitaro Matsuo: conceptualization, supervision, and writing (review and editing).
FUNDING INFORMATION
Our study was supported by a Grant‐in‐Aid for Research for Promotion of Cancer Control Programmes from the Ministry of Health, Labour and Welfare, Japan (H29‐political‐general‐015 and H29‐political‐general‐016).
CONFLICT OF INTEREST STATEMENT
Keitaro Matsuo is an Editorial Board Member of Cancer Science. Yoshinobu Maeda has received honoraria and research funding from Kyowa Kirin. The remaining authors declare no potential competing interests.
ETHICS STATEMENT
Approval of the research protocol was attained from the institutional review board of the Aichi Cancer Center, Japan (Approval Number: 2022–0‐009).
Informed Consent: N/A.
Registry and the Registration No. of the study/trial: N/A.
Animal Studies: N/A.
Supporting information
Figure S1.
Figure S2.
Table S1.
Table S2.
ACKNOWLEDGMENTS
The authors would like to thank the MCIJ project, 13 cancer registries (Miyagi, Yamagata, Chiba, Kanagawa, Niigata, Fukui, Aichi, Shiga, Osaka, Tottori, Yamaguchi, Nagasaki, and Kumamoto) in Japan providing data, and the SEER project for the provision of data for the United States. The authors also thank Guy Harris DO of DMC (www.dmed.co.jp/) for language editing.
Usui Y, Ito H, Katanoda K, Matsuda T, Maeda Y, Matsuo K. Trends in non‐Hodgkin lymphoma mortality rate in Japan and the United States: A population‐based study. Cancer Sci. 2023;114:4073‐4080. doi: 10.1111/cas.15926
REFERENCES
- 1. Sung H, Ferlay J, Siegel RL, et al. Global cancer statistics 2020: GLOBOCAN estimates of incidence and mortality worldwide for 36 cancers in 185 countries. CA Cancer J Clin. 2021;71:209‐249. [DOI] [PubMed] [Google Scholar]
- 2. Ellis L, Woods LM, Estève J, Eloranta S, Coleman MP, Rachet B. Cancer incidence, survival and mortality: explaining the concepts. Int J Cancer. 2014;135:1774‐1782. [DOI] [PubMed] [Google Scholar]
- 3. Welch HG, Schwartz LM, Woloshin S. Are increasing 5‐year survival rates evidence of success against cancer? Jama. 2000;283:2975‐2978. [DOI] [PubMed] [Google Scholar]
- 4. Welch HG, Kramer BS, Black WC. Epidemiologic signatures in cancer. N Engl J Med. 2019;381:1378‐1386. [DOI] [PubMed] [Google Scholar]
- 5. DeVita VT, Chu E. A history of cancer chemotherapy. Cancer Res. 2008;68:8643‐8653. [DOI] [PubMed] [Google Scholar]
- 6. Usui Y, Ito H, Koyanagi Y, et al. Changing trend in mortality rate of multiple myeloma after introduction of novel agents: a population‐based study. Int J Cancer. 2020;147:3102‐3109. [DOI] [PubMed] [Google Scholar]
- 7. Chihara D, Ito H, Matsuda T, et al. Decreasing trend in mortality of chronic myelogenous leukemia patients after introduction of imatinib in Japan and the U.S. Oncologist. 2012;17:1547‐1550. [DOI] [PMC free article] [PubMed] [Google Scholar]
- 8. Cheson BD, Leonard JP. Monoclonal antibody therapy for B‐cell non‐Hodgkin's lymphoma. N Engl J Med. 2008;359:613‐626. [DOI] [PubMed] [Google Scholar]
- 9. List of approved drug products . Pharmaceuticals and Medical Devices Agency. Accessed December 13, 2019. https://www.pmda.go.jp/review‐services/drug‐reviews/review‐information/p‐drugs/0010.html
- 10. Igarashi T, Kobayashi Y, Ogura M, et al. Factors affecting toxicity, response and progression‐free survival in relapsed patients with indolent B‐cell lymphoma and mantle cell lymphoma treated with rituximab: a Japanese phase II study. Ann Oncol. 2002;13:928‐943. [DOI] [PubMed] [Google Scholar]
- 11. Drugs@FDA: FDA Approved Drug Products . U.S. Food & Drug Administration. Accessed December 13, 2019. https://www.accessdata.fda.gov/scripts/cder/daf/
- 12. Maloney DG, Grillo‐López AJ, White CA, et al. IDEC‐C2B8 (Rituximab) anti‐CD20 monoclonal antibody therapy in patients with relapsed low‐grade non‐Hodgkin's lymphoma. Blood. 1997;90:2188‐2195. [PubMed] [Google Scholar]
- 13. Coiffier B, Lepage E, Briere J, et al. CHOP chemotherapy plus rituximab compared with CHOP alone in elderly patients with diffuse large‐B‐cell lymphoma. N Engl J Med. 2002;346:235‐242. [DOI] [PubMed] [Google Scholar]
- 14. Pfreundschuh M, Kuhnt E, Trümper L, et al. CHOP‐like chemotherapy with or without rituximab in young patients with good‐prognosis diffuse large‐B‐cell lymphoma: 6‐year results of an open‐label randomised study of the MabThera International Trial (MInT) Group. Lancet Oncol. 2011;12:1013‐1022. [DOI] [PubMed] [Google Scholar]
- 15. Lee L, Crump M, Khor S, et al. Impact of rituximab on treatment outcomes of patients with diffuse large b‐cell lymphoma: a population‐based analysis. Br J Haematol. 2012;158:481‐488. [DOI] [PubMed] [Google Scholar]
- 16. Shah BK, Bista A, Shafii B. Survival in advanced diffuse large B‐cell lymphoma in pre‐ and post‐rituximab Eras in the United States. Anticancer Res. 2014;34:5117‐5120. [PubMed] [Google Scholar]
- 17. Junlen HR, Peterson S, Kimby E, et al. Follicular lymphoma in Sweden: nationwide improved survival in the rituximab era, particularly in elderly women: a Swedish lymphoma registry study. Leukemia. 2015;29:668‐676. [DOI] [PubMed] [Google Scholar]
- 18. National Cancer Institute. Surveillance E, and End Results . U.S. Mortality‐All COD, Aggregated Total U.S. (1969–2015) <Katrina/Rita Adjustment>. Accessed December 13, 2019. Available at SEER*Stat Software.
- 19. National Cancer Institute. Surveillance E, and End Results . SEER Cause of Death Recode 1969+ (03/01/2018). Accessed December 13, 2019. https://seer.cancer.gov/
- 20. Hori M, Matsuda T, Shibata A, et al. Cancer incidence and incidence rates in Japan in 2009: a study of 32 population‐based cancer registries for the Monitoring of Cancer Incidence in Japan (MCIJ) project. Jpn J Clin Oncol. 2015;45:884‐891. [DOI] [PubMed] [Google Scholar]
- 21. National Cancer Institute. Surveillance E, and End Results . U.S.Incidence‐SEER18 Regs Research Data + Hurricane Katrina Impacted Louisiana Cases, Nov 2017 Sub [1973–2015 varying]. Accessed December 13, 2019. Available at SEER*Stat Software.
- 22. Kuo TM, Mobley LR. How generalizable are the SEER registries to the cancer populations of the USA? Cancer Causes Control. 2016;27:1117‐1126. [DOI] [PMC free article] [PubMed] [Google Scholar]
- 23. Cancer Registry and Statistics . Cancer Information Service, National Cancer Center, Japan (Ministry of Health, Labour and Welfare, National Cancer Registry). Accessed December 13, 2019. https://ganjoho.jp/reg_stat/statistics/data/dl/en.html
- 24. National Cancer Institute. Surveillance E, and End Results . U.S. Population‐Total U.S. (1969–2015) <Katrina/Rita Adjustment>. Accessed December 13, 2019. Available at SEER*Stat Software.
- 25. National Cancer Institute . Surveillance E, and End Result. Standard Population Data World (WHO 2000–2025) Standard. Accessed December 13, 2019. https://seer.cancer.gov/
- 26. Clegg LX, Hankey BF, Tiwari R, Feuer EJ, Edwards BK. Estimating average annual per cent change in trend analysis. Stat Med. 2009;28:3670‐3682. [DOI] [PMC free article] [PubMed] [Google Scholar]
- 27. Kim HJ, Fay MP, Feuer EJ, Midthune DN. Permutation tests for joinpoint regression with applications to cancer rates. Stat Med. 2000;19:335‐351. [DOI] [PubMed] [Google Scholar]
- 28. Chihara D, Ito H, Matsuda T, et al. Differences in incidence and trends of haematological malignancies in Japan and the United States. Br J Haematol. 2014;164:536‐545. [DOI] [PMC free article] [PubMed] [Google Scholar]
- 29. Peto R, Darby S, Deo H, Silcocks P, Whitley E, Doll R. Smoking, smoking cessation, and lung cancer in the UK since 1950: combination of national statistics with two case‐control studies. BMJ. 2000;321:323‐329. [DOI] [PMC free article] [PubMed] [Google Scholar]
Associated Data
This section collects any data citations, data availability statements, or supplementary materials included in this article.
Supplementary Materials
Figure S1.
Figure S2.
Table S1.
Table S2.