

Key Points
Question
What are the implications of using postdischarge quality metrics combined into a single composite score instead of in-hospital mortality alone to assess care quality of older adult trauma patients?
Findings
This national quality assessment study of 573 554 older adults from 1234 hospitals showed marked differences in postdischarge quality metric associations with hospital-level factors when trauma quality was evaluated using composite scores vs in-hospital mortality.
Meaning
These results challenge historical notions about the adequacy of in-hospital mortality as a single measure of older adult trauma care quality and suggest that decisions about how quality is evaluated in older adults can profoundly alter understandings of what constitutes best practices for care.
This cohort study compares postdischarge quality metrics as a composite score with in-hospital mortality as a single measure of hospital-level care quality of older trauma patients.
Abstract
Importance
Lack of knowledge about longer-term outcomes remains a critical blind spot for trauma systems. Recent efforts have expanded trauma quality evaluation to include a broader array of postdischarge quality metrics. It remains unknown how such quality metrics should be used.
Objective
To examine the utility of implementing recommended postdischarge quality metrics as a composite score and ascertain how composite score performance compares with that of in-hospital mortality for evaluating associations with hospital-level factors.
Design, Setting, and Participants
This national hospital-level quality assessment evaluated hospital-level care quality using 100% Medicare fee-for-service claims of older adults (aged ≥65 years) hospitalized with primary diagnoses of trauma, hip fracture, and severe traumatic brain injury (TBI) between January 1, 2014, and December 31, 2015. Hospitals with annual volumes encompassing 10 or more of each diagnosis were included. The data analysis was performed between January 1, 2021, and December 31, 2022.
Exposures
Reliability-adjusted quality metrics used to calculate composite scores included hospital-specific performance on mortality, readmission, and patients’ average number of healthy days at home (HDAH) within 30, 90, and 365 days among older adults hospitalized with all forms of trauma, hip fracture, and severe TBI.
Main Outcomes and Measures
Associations with hospital-level factors were compared using volume-weighted multivariable logistic regression.
Results
A total of 573 554 older adults (mean [SD] age, 83.1 [8.3] years; 64.8% female; 35.2% male) from 1234 hospitals were included. All 27 reliability-adjusted postdischarge quality metrics significantly contributed to the composite score. The most important drivers were 30- and 90-day readmission, patients’ average number of HDAH within 365 days, and 365-day mortality among all trauma patients. Associations with hospital-level factors revealed predominantly anticipated trends when older adult trauma quality was evaluated using composite scores (eg, worst performance was associated with decreased older adult trauma volume [odds ratio, 0.89; 95% CI, 0.88-0.90]). Results for in-hospital mortality showed inverted associations for each considered hospital-level factor and suggested that compared with nontrauma centers, level 1 trauma centers had a 17 times higher risk-adjusted odds of worst (highest quantile) vs best (lowest quintile) performance (odds ratio, 17.08; 95% CI, 16.17-18.05).
Conclusions and Relevance
The study results challenge historical notions about the adequacy of in-hospital mortality as the single measure of older adult trauma quality and suggest that, when it comes to older adults, decisions about how quality is evaluated can profoundly alter understandings of what constitutes best practices for care. Composite scores appear to offer a promising means by which postdischarge quality metrics could be used.
Introduction
Despite advances in inpatient survival after traumatic injury, longer-term outcomes remain a “critical blind spot” for trauma systems,1 a reality that is particularly true for the increasing number of older adults aged 65 years or older living in the US. Current trauma systems, which were designed in the 1980s and 1990s, were intended to reduce in-hospital deaths among younger patients with severe injuries.2,3,4 They have successfully helped to optimize outcomes around this aim, resulting in marked decreases in in-hospital mortality for younger adults treated at larger level 1 or 2 trauma centers.4 However, emerging research has suggested that in so doing, the current structure of US trauma systems might have inadvertently led to worse outcomes for older trauma patients.3 Known to present with different mechanisms of injury (eg, hip fracture and severe traumatic brain injury [TBI] following falls), higher rates of mortality and complications, and prolonged recovery periods compared with younger patients,5,6 older adults with traumatic injuries represent a distinct population with unique health needs. Historical failure to differentiate those needs has led to increasing concern that existing trauma structures might provide an incomplete picture of older adult trauma care,2,3,4 one associated with widespread undertriage7,8,9 and reported increases in mortality among older adults presenting to trauma centers.3
Recognizing the challenges that this situation poses, in 2016, the National Academies of Sciences, Engineering, and Medicine called for efforts to expand external benchmarking (ie, quality evaluation) in trauma care from its historical focus on in-hospital mortality to include a more diverse set of additional postdischarge quality metrics.2,10 Suggested quality metrics for older adults included assessment of patients’ extent of functional recovery and preference for increased time at home (hospitals’ average number of healthy days at home [HDAH]), the importance of care coordination and successful care transfers (all-cause readmission), and patients’ risk of death after discharge (all-cause mortality).2,10 Initial assessment of the use of recommended postdischarge quality metrics conducted as a part of the ED.TRAUMA study2 (Evaluating the Discordance of Trauma Readmission and Unanticipated Mortality in the Assessment of Hospital Quality) showed that within a large national cohort of Medicare patients, assessment of older adult trauma quality using such quality metrics is possible. The recommended set of postdischarge quality metrics provided a more complete picture of older adult trauma care,2 raising important questions about how they should be used.
One approach advocated in prior efforts to expand external benchmarking in trauma11 is to develop a composite score capable of distilling information from multiple quality metrics into a single scalar (numerical) value. Building on the initial work,2 in this portion of the ED.TRAUMA study, we examined the utility of implementing the suggested set of 27 additional postdischarge quality metrics representing 30-, 90-, and 365-day outcomes for reliability-adjusted HDAH, readmissions, and mortality among all trauma patients, older adults with hip fracture, and older adults with severe TBI as a combined composite score and assessed for meaningful associations with hospital-level factors. As a point of comparison with the current benchmarking standard, in-hospital mortality, differences between composite scores and reliability-adjusted in-hospital mortality were also compared.
Methods
Data Source and Study Population
In this national quality assessment, records of index trauma admissions for adults aged 65 years or older were abstracted using January 1, 2014, through December 31, 2015, Centers for Medicare & Medicaid Services (CMS) 100% fee-for-service Medicare inpatient claims. Inpatient, outpatient, and health services utilization data from 12 months prior (January 1, 2013, through December 31, 2015) were used to establish previous health services utilization and existing comorbidities. Data through 12 months after (January 1, 2014, through December 31, 2016) were used to determine subsequent health services utilization and time at home. Death certificate–linked fatalities were tracked through December 31, 2018.
To be included, older adults needed to present with a principal diagnosis of trauma. Following the definition of trauma developed by the American College of Surgeons National Trauma Data Standard,12 patients with late effects of injury or poisoning, superficial injuries, foreign bodies, and burns were excluded. Patients without an underlying mechanism of injury reported as blunt or penetrating were also excluded. Presence of severe TBI was defined in accordance with the Centers for Disease Control and Prevention definition.13 Traumatic hip fractures were defined in accordance with the CMS definition.14 Index admissions were defined as those without a prior trauma hospitalization in the preceding 30 days. Included patients were limited to their first recorded index admission. To ensure estimate stability, included hospitals were restricted to those with annual older adult trauma patient volumes that included 10 or more trauma, hip fracture, and severe TBI cases.
The study was approved by the institutional review boards of Brigham and Women’s Hospital and Yale University; informed consent was not required for the secondary analysis of Medicare billing claims. Data were reported in accordance with the Strengthening the Reporting of Observational Studies in Epidemiology (STROBE) reporting guideline.
Potential Confounders
Potential confounders included in the calculation of reliability-adjusted quality metrics and overall composite scores included age in years on index admission, gender (self-identified as male vs female), presence of severe head injury (maximum head Abbreviated Injury Scale score <3 vs ≥3, with a higher score indicating more severity), overall Injury Severity Score (minor injury ≤8, severe injury 9-15, major injury ≥16), extent of multimorbidity (number of preexisting conditions based on the Elixhauser Comorbidity Index), Hospital Frailty Risk Score (low risk ≤4, intermediate risk 5-15, high risk ≥16), and 31 individual binary comorbidity indicators contained within the Elixhauser Comorbidity Index reported on index admission or up to 12 months prior. The Abbreviated Injury Scale, Injury Severity Score, Hospital Frailty Risk Score, and multimorbidity and comorbidities were calculated using International Classification of Diseases, Ninth Revision and 10th Revision, Clinical Modification primary and secondary diagnosis and external cause of injury codes.
Reliability-Adjusted Quality Metrics
Reliability-adjusted quality metrics were defined in accordance with previous research.2 In brief, each quality metric was calculated using a multivariable hierarchical regression model with hospital-level random intercepts to account for variability between hospitals and patient clustering within hospitals and patient-level fixed effects to risk adjust for potential confounding.2 Risk-adjusted results were then further reliability adjusted using bayesian shrinkage estimators to correct for hospitals with unstable estimates due to small sample size.2
Calculation of Composite Scores
A hierarchical bayesian latent variable model (LVM) was used to combine the 27 reliability-adjusted quality metrics into a single composite score. Latent variable modeling is an approach that has been widely used for the development of similar composite scores.15,16,17 It is generally thought to be preferable to other methods when dealing with complex data.18,19,20
Prior to incorporation in the LVM, reliability-adjusted quality metrics were standardized (set to have a mean of 0 and variance of 1), enabling them to be interpreted on the same scale. Standardized values greater than 0 indicate performance that is higher or worse than average, while standardized values less than 0 indicate performance that is less or better than average. To improve interpretation, standardized values for HDAH were multiplied by −1. Doing so ensured that higher values indicated worse quality for each quality metric (ie, higher mortality, higher readmission, fewer HDAH). Associations between composite scores and each reliability-adjusted quality metric were assessed using volume-weighted Pearson correlation coefficients. Estimates of linear correlations were volume weighted to account for the amount of weight that should be given to each hospital based on the number of older patients that it treated. Quality metric contributions to the composite score were derived from the LVM fit.
Associations With Hospital-Level Factors
To assess for potentially informative associations with hospital-level factors, differences in hospital-level factors were compared between hospitals performing the worst (highest quintile) vs best (lowest quintile) on (1) the overall composite score and (2) reliability-adjusted in-hospital mortality. Volume-weighted multivariable logistic regression models, risk adjusting for the influence of the other included hospital-level factors, were used to identify independent factors associated with worst quality.
Considered hospital-level factors included American College of Surgeons trauma center level (1, 2, ≤3, and nontrauma centers [NTCs]), travel time by road from the index hospital to the nearest level 1 or 2 trauma center (top 25%: >23.7 minutes vs the rest of the population), geographic rurality (metropolitan vs micropolitan or rural), annual older adult trauma volume (top 25%: >597 index hospitalizations vs the rest of the population), mean national Area Deprivation Index (ADI) of included patients’ residential census tract21 (validated composite measure of neighborhood vulnerability ranging from 1 [least disadvantaged] to 100 [most disadvantaged]22,23; top 25%: >79 vs the rest of the population), percentage of racial and ethnic minority older adult trauma patients (defined to include non-Hispanic Black or Latino older adults; top 25%: >1 in 100 index hospitalizations vs the rest of the population), and percentage of CMS dual-eligible older adult trauma patients (individuals who because of low income are also eligible for Medicaid; top 25%: >8 in 100 index hospitalizations vs the rest of the population).
Statistical Analysis
The data analysis was performed between January 1, 2021, and December 31, 2022. Initial data analysis and cleaning were conducted using SAS, version 9.4 software (SAS Institute Inc). Statistical analyses were conducted using Stata, version 17.0 (StataCorp LLC). Graphs were plotted using R, version 4.0.3 software (R Foundation for Statistical Computing). Missing data were minimal (<1.0% across all considered confounders) and, when present, were addressed using multiple imputation. A 2-sided P < .05 was considered significant.
Results
Population Characteristics
A total of 573 554 older adults with index trauma admissions (222 941 hip fractures, 78 922 severe TBI) from 1234 hospitals were included. The mean (SD) age of the sample was 83.1 (8.3) years; 64.8% were female and 35.2% were male; and 0.4% were American Indian or Alaska Native, 4.4% Asian or Native Hawaiian or Pacific Islander, 10.0% non-Hispanic Black, 9.4% Hispanic, 73.0% non-Hispanic White, and 2.8 multiple races. Differences in patient-level characteristics are presented in the eTable in Supplement 1. Consistent with expectations, older adults with adverse outcomes (patients who died, required readmission, or fell within the lowest quintile of HDAH) were more likely than older adults without adverse outcomes (patients who survived, were not readmitted, or fell within the remainder of the population for HDAH) to be older (eg, 30-day mortality among all trauma patients: mean [SD] age, 85.5 [8.1] vs 81.8 [8.5] years), have more preexisting comorbidities (eg, 30-day mortality among all trauma patients: mean [SD] number of Elixhauser comorbidities, 3.2 [0.3] vs 2.6 [0.2]), and present with more severe injuries (eg, 30-day mortality among all trauma patients: patients with major injuries, 67.5% vs 52.1%). Similar patterns were observed across differences in time points (30, 90, and 365 days), outcomes (mortality, readmission, and HDAH), and indications (all trauma, hip fracture, and severe TBI).
Composite Score Performance
Variability in hospitals’ performance on the composite score is presented in Figure 1. As a result of how the composite score was calculated using standardized quality metrics, hospital performance on the composite score followed a standardized normal distribution (mean, 0; variance, 1). Higher values indicate worse quality. Thirty-six hospitals (2.9%) were more than 2 SDs above the mean, indicating clear outliers with poor performance. Thirty-nine hospitals (3.2%) were more than 2 SDs below the mean, indicating clear outliers with good performance.
Figure 1. Distribution of Standardized Composite Scores.

Scores are set to have a mean of 0 and a variance of 1. The solid line indicates the mean and the dashed lines indicate 2 SDs above and below the mean.
Quality Metrics Driving the Results of the Composite Score
All 27 quality metrics significantly contributed to the composite score (Figure 2). The most important, each accounting for 4.7% (P < .001) of the total variance explained, included 30- and 90-day readmission among all trauma patients, all trauma patients’ average number of HDAH within 365 days, and 365-day mortality among all trauma patients. The least important were 30-day mortality among all trauma patients (0.7%; P < .001), 30-day mortality among patients with severe TBI (1.2%; P < .001), and 30-day mortality among patients with hip fracture (2.4%; P < .001).
Figure 2. Contributions of Reliability-Adjusted Quality Metrics to the Overall Composite Score.

TBI indicates traumatic brain injury.
Corresponding volume-weighted linear correlations between the composite score and each standardized reliability-adjusted quality metric are presented in Figure 3. Consistent with the results for which quality metrics primarily drove development of the composite score (Figure 2), volume-weighted linear correlations between the composite score and reliability-adjusted quality metrics for readmission (correlation coefficient [r] ≥ 0.670), patients’ average number of HDAH (r ≥ 0.666), and longer-term mortality (365-day r = 0.753; 95% CI, 0.748-758) among all trauma patients were generally strong (Figure 3). Meaningful associations with 30-day mortality were less clear (r = 0.086; 95% CI, 0.079-0.093). Compared with results for all trauma patients, quality metrics for older adults with hip fracture tended to yield stronger volume-weighted linear correlations (eFigure 1 in Supplement 1). Correlations for quality metrics among older adults with severe TBI remained significant (r ≥ 0.387 for readmission, HDAH, and 365-day mortality; 2-sided P < .001 for each) but showed a greater extent of quality metric variation not accounted for by the composite score (eFigure 2 in Supplement 1).
Figure 3. Scatterplots of the Volume-Weighted Linear Correlations Between the Overall Composite Score and Each Standardized, Reliability-Adjusted Quality Metric Among Older Adults With All Trauma.
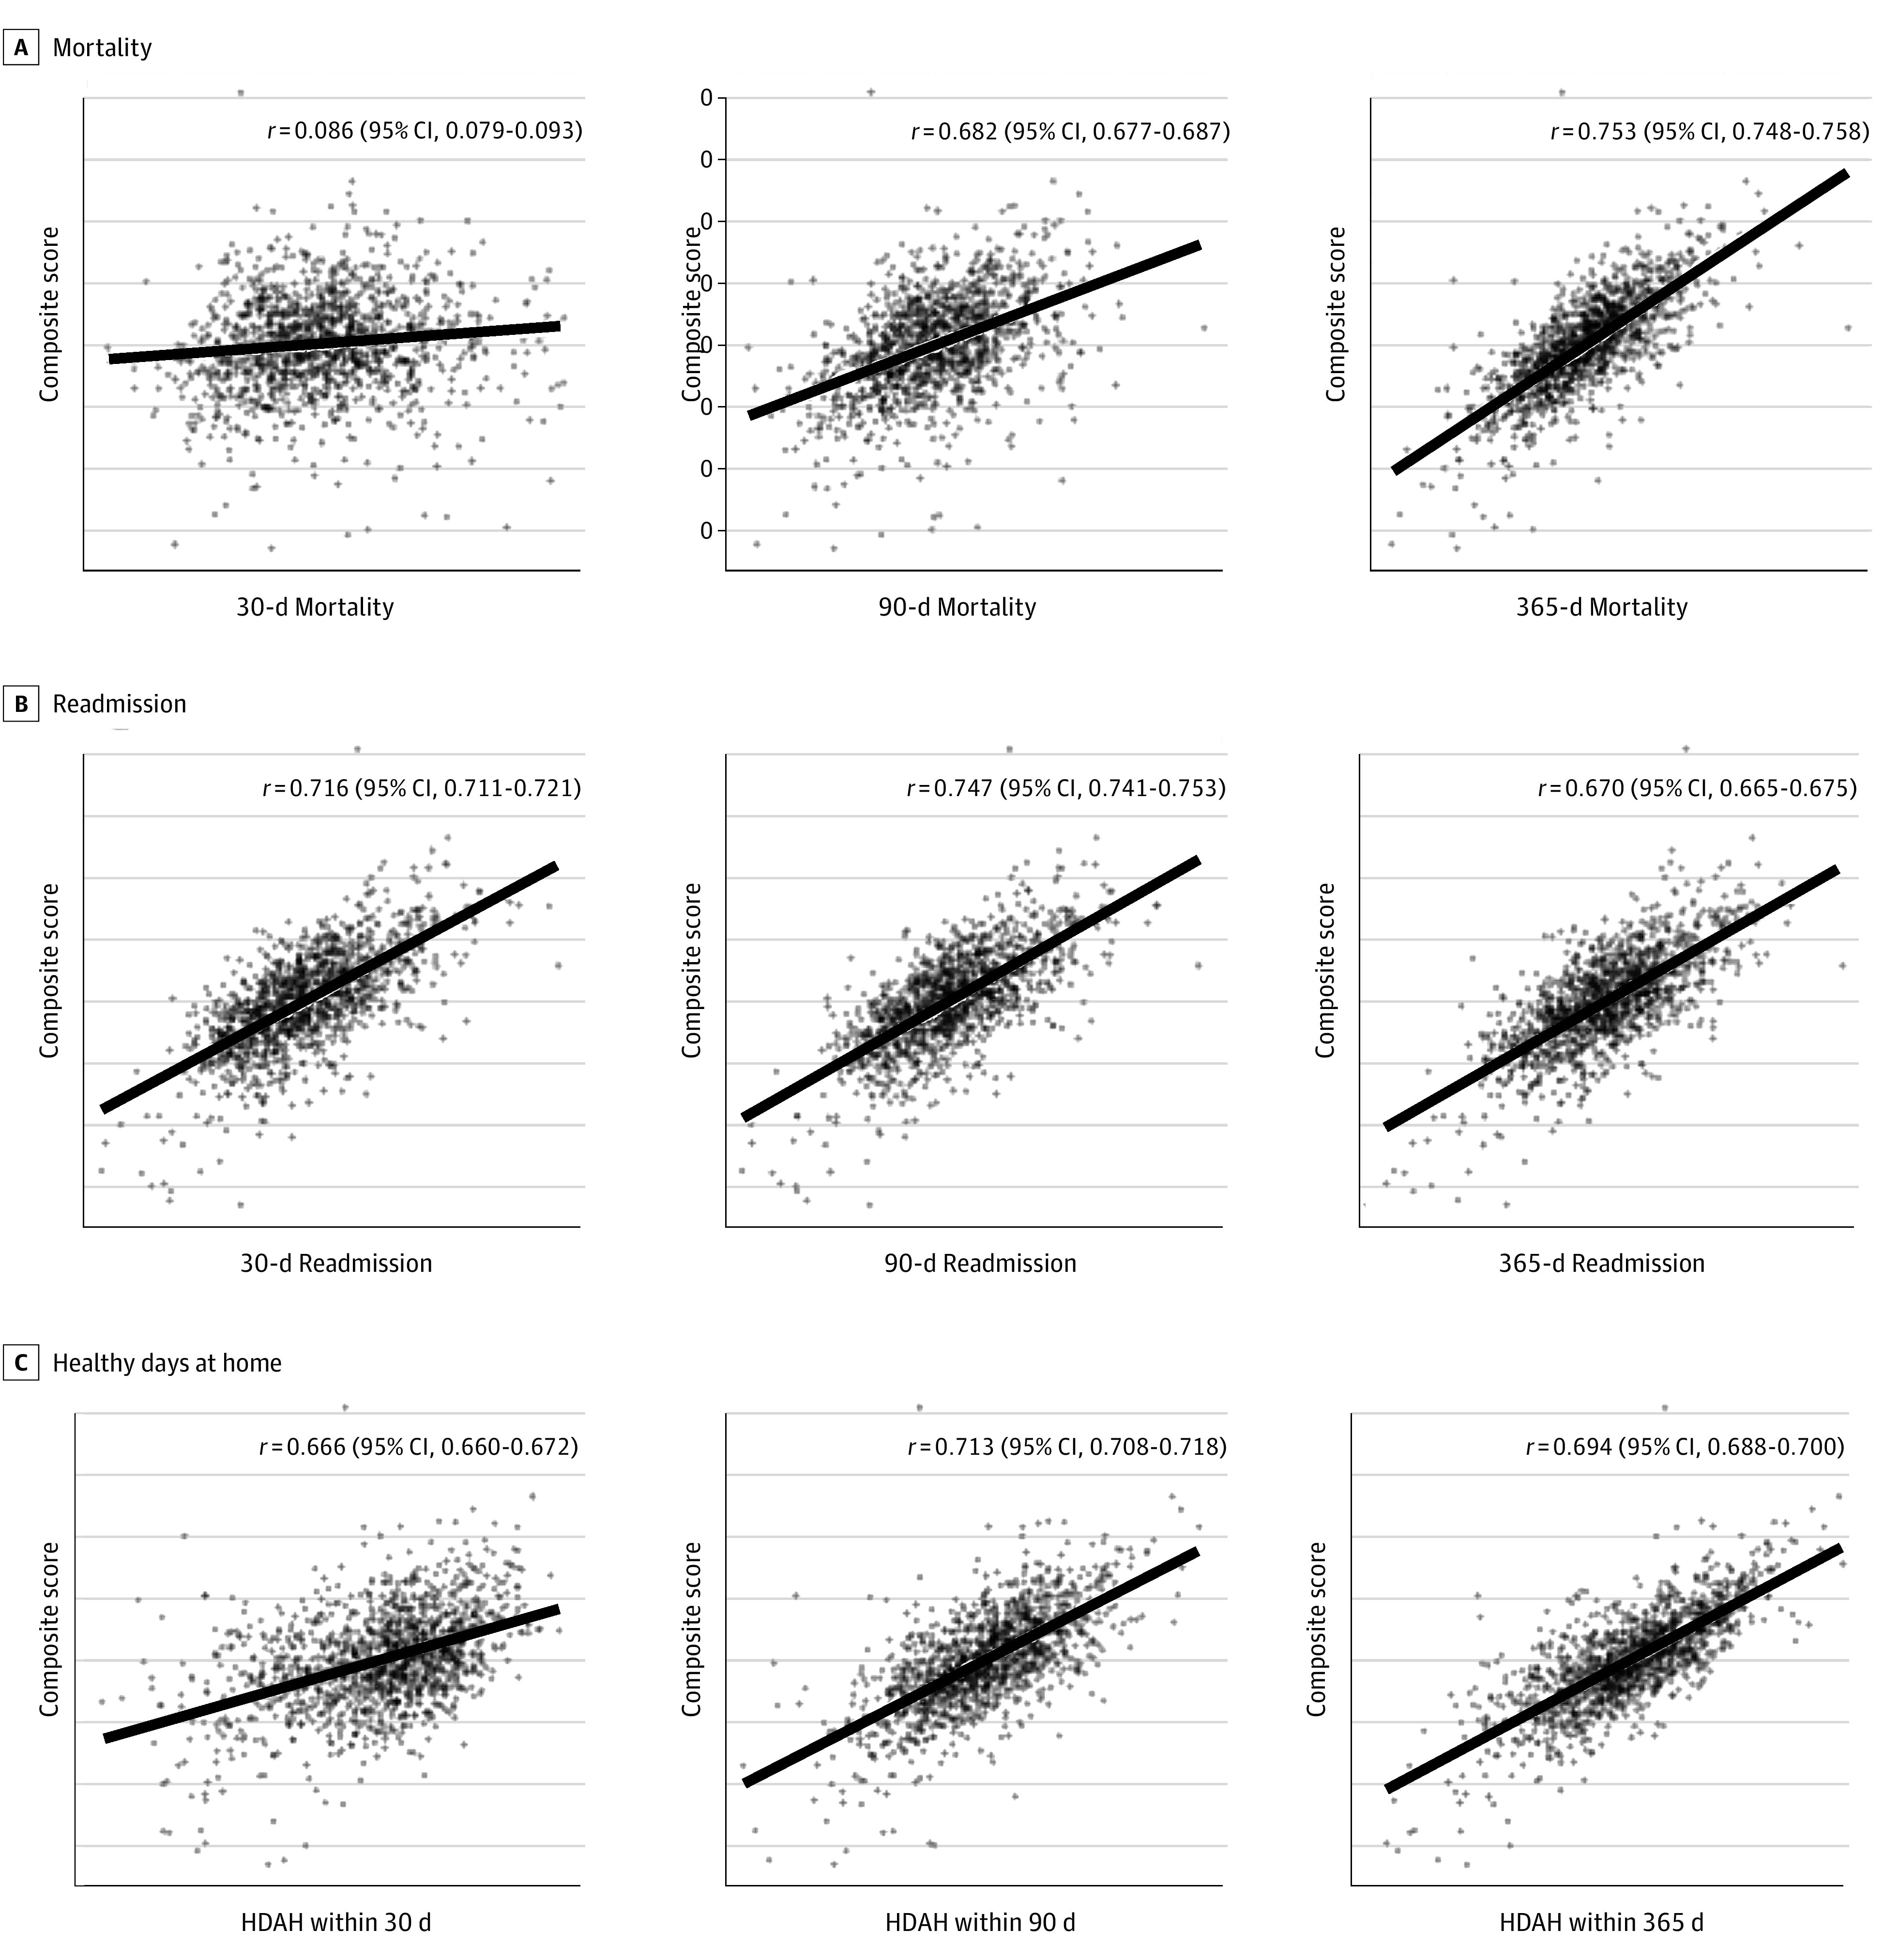
The solid line indicates the linear regression. HDAH indicates healthy days at home.
Hospital-Level Factors Associated With Worst vs Best Performance
Independent factors associated with worst vs best performance when defining older adult trauma quality based on (1) longer-term, postdischarge outcomes vs (2) in-hospital mortality are presented in Table 1. When looking at longer-term outcomes, the worst-performing hospitals tended to be larger level 1 trauma centers (odds ratio [OR], 1.51; 95% CI, 1.48-1.54) or level 2 trauma centers (OR, 1.63; 95% CI, 1.61-1.66) (reference, NTCs). Worst performance was also associated with a longer travel time by road from the index hospital to the nearest level 1 or 2 trauma center (top 25% vs the rest of the population: OR, 1.14; 95% CI, 1.13-1.62), increased rurality (micropolitan or rural vs metropolitan: OR, 1.56; 95% CI, 1.51-1.62), decreased older adult trauma volume (top 25% vs the rest of the population: OR, 0.89; 95% CI, 0.88-0.90), decreased extent of older adult racial and ethnic minority trauma patients (top 25% vs the rest of the population: OR, 0.49; 95% CI, 0.48-0.49), increased extent of CMS dual-eligible older adult trauma patients (top 25% vs the rest of the population: OR, 1.17; 95% CI, 1.15-1.19), and increased extent of patients living in areas with a greater ADI (top 25% vs the rest of the population: OR, 1.21; 95% CI, 1.19-1.22).
Table 1. Risk-Adjusted Associations Between Hospital-Level Factors and Older Adult Trauma Quality When Evaluated Based on Composite Scores vs Reliability-Adjusted In-Hospital Mortality.
| Independent factors associated with worst vs best performance, OR (95% CI) | ||||
|---|---|---|---|---|
| Composite score | In-hospital mortality | |||
| Worst (highest quintile) | Best (lowest quintile) | Worst (highest quintile) | Best (lowest quintile) | |
| No. of index admissions | 108 217 | 122 205 | 132 290 | 106 131 |
| No. of hospitals | 247 | 247 | 247 | 247 |
| ACS trauma center level | ||||
| 1 | 1.51 (1.48-1.54) | 17.08 (16.17-18.05) | ||
| 2 | 1.63 (1.61-1.66) | 4.90 (4.77-5.03) | ||
| ≤3 | 0.87 (0.86-0.90) | 1.59 (1.55-1.63) | ||
| Nontrauma center | 1 [Reference] | 1 [Reference] | ||
| Time to the nearest trauma center | ||||
| Rest of the population | 1 [Reference] | 1 [Reference] | ||
| Top 25%: >23.7 min | 1.14 (1.13-1.16) | 0.78 (0.76-0.79) | ||
| Rurality | ||||
| Metropolitan | 1 [Reference] | 1 [Reference] | ||
| Micropolitan or rural | 1.56 (1.51-1.62) | 0.92 (0.87-0.96) | ||
| Older adult trauma volume | ||||
| Rest of the population | 1 [Reference] | 1 [Reference] | ||
| Top 25%: >597 index hospitalizations | 0.89 (0.88-0.90) | 1.65 (1.61-1.69) | ||
| Mean ADIa | ||||
| Rest of the population | 1 [Reference] | 1 [Reference] | ||
| Top 25%: >79 | 1.21 (1.19-1.22) | 0.86 (0.84-0.88) | ||
| Percentage of minority race and ethnicity (non-Hispanic Black, Latino) | ||||
| Rest of the population | 1 [Reference] | 1 [Reference] | ||
| Top 25%: >1 in 100 hospitalizations | 0.49 (0.48-0.49) | 1.28 (1.24-1.32) | ||
| Percentage of CMS dual-eligible for Medicare and Medicaid | ||||
| Rest of the population | 1 [Reference] | 1 [Reference] | ||
| Top 25%: >8 in 100 hospitalization | 1.17 (1.15-1.19) | 0.87 (0.85-0.90) | ||
Abbreviations: ACS, American College of Surgeons; ADI, Area Deprivation Index; CMS, Centers for Medicare & Medicaid Services; OR, odds ratio.
Scale from 1 (least deprived) to 100 (most deprived).
Factors associated with worst quality based on reliability-adjusted in-hospital mortality showed that compared with NTCs, level 1 trauma centers (OR, 17.08; 95% CI, 16.17-18.05) and level 2 trauma centers (OR, 4.90; 95% CI, 4.77-5.03) did worse (Table 1). Inverted associations were seen for each other hospital-level factor such that worst performance based on in-hospital mortality was associated with shorter travel time by road from the index hospital to the nearest level 1 or 2 trauma center (top 25% vs the rest of the population: OR, 0.78; 95% CI, 0.76-0.79), decreased rurality (micropolitan or rural vs metropolitan: OR, 0.92; 95% CI, 0.87-0.96), increased older adult trauma volume (top 25% vs the rest of the population: OR, 1.65; 95% CI, 1.61-1.69), increased extent of older adult racial and ethnic minority trauma patients (top 25% vs the rest of the population: OR, 1.28; 95% CI, 1.24-1.32), decreased extent of CMS dual-eligible older adult trauma patients (top 25% vs the rest of the population: OR, 0.87; 95% CI, 0.85-0.90), and decreased extent of patients living in areas with a greater ADI (top 25% vs the rest of the population: OR, 0.86; 95% CI, 0.84-0.88).
Accounting for Worse Outcomes at Level 1 Trauma Centers
In an effort to understand what was happening at larger trauma centers, we further explored the results of individual quality metrics. Table 2 presents mean outcomes for each reliability-adjusted quality metric (plus in-hospital mortality) among all trauma patients. Mean unadjusted outcomes are also reported. For both sets of quality metrics (reliability-adjusted and unadjusted outcomes), absolute differences in mean values between level 1 trauma centers and NTCs suggest that compared with NTCs, level 1 trauma centers had higher short-term mortality (absolute difference: 0.6 [95% CI, 0.5-0.7] percentage points vs 0.5 [95% CI, 0.5-0.6] percentage points). The difference decreased over follow-up time, inverting among 365-day reliability-adjusted mortality to suggest that at 1 year after injury, level 1 trauma centers did better than NTCs (absolute difference: −0.4 percentage points; 95% CI, −0.4 to −0.4 percentage points). Level 1 trauma centers outperformed NTCs in terms of all-cause readmission and patients’ average number of HDAH within 30, 90, and 365 days.
Table 2. Differences in Mean Outcomes Between Level 1 Trauma Centers and Nontrauma Centers (NTCs).
| Mean (SD) | Absolute difference (95% CI) | ||
|---|---|---|---|
| Level 1 | NTC | Level 1 vs NTC | |
| Reliability-adjusted quality metrics | |||
| Mortality, % | |||
| In-hospitala | 2.9 (0.4) | 2.3 (0.5) | 0.6 (0.5 to 0.7) |
| 30-da | 7.7 (0.7) | 7.2 (0.7) | 0.5 (0.5 to 0.6) |
| 90-da | 15.4 (1.0) | 15.1 (1.1) | 0.3 (0.3 to 0.3) |
| 365-d | 25.3 (1.9) | 25.8 (2.0) | −0.4 (−0.4 to −0.4) |
| Readmission, % | |||
| 30-d | 11.7 (1.0) | 11.7 (1.1) | 0.0 (0.0 to 0.0) |
| 90-d | 21.0 (1.8) | 21.2 (1.9) | −0.2 (−0.2 to −0.2) |
| 365-d | 32.5 (2.2) | 33.2 (2.3) | −0.7 (−0.6 to −0.8) |
| HDAH, No. | |||
| Within 30 d | 20.0 (0.3) | 19.4 (0.5) | 0.5 (0.5 to 0.6) |
| Within 90 d | 71.0 (1.4) | 70.4 (1.6) | 0.6 (0.5 to 0.7) |
| Within 365 d | 330.9 (6.2) | 329.2 (8.1) | 1.7 (1.5 to 1.9) |
| Unadjusted outcomes | |||
| Mortality, % | |||
| In-hospitala | 3.4 (0.6) | 2.0 (0.8) | 1.4 (1.3 to 1.5) |
| 30-da | 8.2 (0.8) | 7.4 (1.0) | 0.8 (0.7 to 0.9) |
| 90-da | 13.5 (1.2) | 13.1 (1.4) | 0.5 (0.5 to 0.6) |
| 365-da | 24.6 (2.1) | 24.1 (2.3) | 0.5 (0.5 to 0.6) |
| Readmission, % | |||
| 30-d | 11.7 (1.2) | 11.9 (1.4) | −0.3 (−0.3 to −0.3) |
| 90-d | 20.2 (2.0) | 21.0 (2.2) | −0.8 (−0.7 to −0.9) |
| 365-d | 35.8 (2.4) | 38.2 (2.6) | −2.4 (−2.2 to −2.6) |
| HDAH, No. | |||
| Within 30 d | 20.2 (0.5) | 19.6 (0.7) | 0.7 (0.6 to 0.8) |
| Within 90 d | 71.9 (1.6) | 70.8 (1.8) | 1.1 (1.0 to 1.2) |
| Within 365 d | 331.9 (6.4) | 328.2 (8.3) | 3.7 (3.3 to 4.1) |
Abbreviation: HDAH, healthy days at home.
Worse outcomes for level 1 trauma centers.
Discussion
Building on previous research, which characterized the distributions of recommended postdischarge trauma quality metrics for older adults,2 this national assessment of Medicare patients examined the utility of implementing the suggested set of 27 reliability-adjusted quality metrics as a single composite score. Using an LVM approach, our study found that each recommended postdischarge trauma quality metric significantly contributed to the composite score. The most important drivers were 30- and 90-day readmission, patients’ average number of HDAH within 365 days, and 365-day mortality among all trauma patients. The least important quality metric was 30-day mortality. Associations with hospital-level factors assessed based on the composite score revealed differences in how older adult trauma quality is conceptualized when evaluated using differences in postdischarge outcomes vs in-hospital mortality alone.
When evaluated based on differences in composite-scores, independent factors associated with the worst older adult trauma quality included longer travel times by road from an index hospital to the nearest level 1 or 2 trauma center, increased rurality, decreased older adult trauma volume, increased neighborhood ADI, decreased percentages of older adult racial and ethnic minority trauma patients, and increased percentages of CMS dual-eligible older adult trauma patients. Worse trauma quality in rural areas located farther from larger, more resourced trauma centers,24,25,26 particularly those treating a greater extent of older adults who come from more socioeconomically disadvantaged backgrounds (eg, dual-eligible Medicare and Medicaid status) and neighborhoods (eg, greater ADI)27,28,29,30,31 is in keeping with expectations. While it unquestionably speaks to the need to reduce disparities among older trauma patients and highlights potential associations between hospital-level factors and emerging quality metrics that must be carefully monitored so as not to place unintentional burdens on hospitals caring for underserved populations,32 the associations make sense. Within a universally insured population like Medicare, racial and ethnic disparities for acute care surgery are lessened,33,34 a finding that among older adults has been reported to result in better outcomes for Black vs White trauma patients.35
Factors associated with worst quality based on in-hospital mortality told a different story, yielding inverted associations for each considered hospital-level factor and markedly worse outcomes among older adults treated at larger level 1 or 2 trauma centers. Such findings are in keeping with previous research reporting equivocal 30- and 365-day mortality differences in matched case fatality ratios and select worse outcomes among older adults treated at level 1, 2, and 3 trauma centers vs NTCs.3 The results of our comparison between level 1 trauma centers and NTCs somewhat agree, suggesting higher unadjusted mortality and theoretically greater, albeit similar, reliability-adjusted mean differences in mortality among older adult trauma patients in hospital (2.9% vs 2.3%) and within 30 (7.7% vs 7.2%) and 90 (15.4% vs 15.1%) days. By 365 days, the average reliability-adjusted difference reversed. Better mean outcomes were seen for each of the other quality metrics.
What these findings mean for the future of US trauma systems is unclear. While larger trauma centers performed worse in terms of short-term mortality, better performance on longer-term mortality and postdischarge quality metrics designed to reflect successful care coordination (ie, readmission) and improved patient functional recovery (ie, HDAH) speak to the utility of larger trauma centers. Future research aimed at better understanding the unique care trajectories of older trauma patients, the extent to which they differ across varying levels of trauma center care, and the specific interplay between short-term mortality and longer-term outcomes (eg, what defines a preventable in-hospital death) is needed to further elucidate these factors. Such findings will be important in helping to guide ongoing efforts to define excellent geriatric trauma centers in addition to conventional definitions of what constitutes excellent trauma center36 care and emerging understandings of what constitutes excellent geriatric surgical center37 care.
Potential explanations for worse or similar short-term mortality at larger trauma centers could include (1) residual confounding that fails to completely account for existing triage guidelines’ preference to send injured older adults with more complicated injuries (eg, more advanced anatomical injury characteristics, specific mechanisms of injury) who are more likely to die to larger trauma centers; (2) higher mortality among older adults triaged to trauma centers historically optimized to reduced mortality among younger patients and, thereby, less well equipped to optimize care for geriatric syndromes frequently encountered among older injured patients; and (3) increased use of interdisciplinary services that “increase mortality” by helping patients to access care that best serves their individual care goals and needs (eg, palliative care–supported death during index admission vs discharge to a skilled nursing facility and traumatic death on readmission). What the results for short-term mortality do, however, make clear is the glaring failure of in-hospital mortality alone to account for these factors. Regardless of how one defines older adult trauma quality, a complete inversion of associations and risk-adjusted ORs that suggest a 17 times greater odds of worst vs best performance between level 1 trauma centers and NTCs unequivocally reveals that something needs to change. In answering calls to expand external benchmarking10 and assess the merits of the recommended set of additional postdischarge quality metrics,2,10 the results of our study echo increasing awareness within the field that there are limits to what in-hospital mortality is able to assess. Among older adults, care for trauma does not end at discharge. Patients frequently face months of rehabilitation and time spent away from home in inpatient or skilled nursing facilities, all while coping with reduced physical abilities and loss of independence. Many experience extended periods of recovery during which they remain at heightened risk for secondary injury and other injury-related complications and sequalae. Successful navigation of this time requires a carefully coordinated effort from a large interdisciplinary team involving initial management by trauma surgeons, orthopedic surgeons, and neurosurgeons; subsequent follow-up with inpatient and outpatient primary care; and often, interrelated consultations with specialists in fields ranging from physical therapy and occupational therapy to geriatrics and palliative care. Given the complexity of management during this time, it is perhaps not surprising that by accounting for longer-term quality metrics, one is able to capture a more complete2 and, as the results of this study suggest, a more meaningfully informative picture of older adult trauma care. Composite scores appear to offer a promising means by which such quality metrics could be used.
Limitations
The study has limitations. The most important limitation reflects the study’s reliance on administrative claims, including the potential for absent or misreporting of events and limited access to clinical detail. Use of Medicare data allowed for a large national assessment of older trauma patients, including the majority of older adults presenting to hospitals across the US. However, in relying on 100% Medicare fee-for-service claims, we were not able to capture the outcomes of older adults with other forms of insurance or those enrolled in managed care. Calculation of reliability-adjusted quality metrics followed an established methodology for the calculation of risk-standardized rates.2
Conclusions
The results of this study address an important gap in postdischarge outcomes for up to 1 year after injury among older adults, revealing in a national assessment of Medicare patients that use of composite scores based on an emerging set of recommended postdischarge quality metrics could offer a promising means of expanding external benchmarking while simultaneously addressing a critical blind spot of US trauma systems. The results challenge historical notions about the adequacy of in-hospital mortality as the single measure of older adult trauma quality and suggest that, when it comes to older adults, decisions about how quality is evaluated can profoundly alter understandings of what constitutes best practices for care.
eTable. Abbreviated Difference in Patient-Level Characteristics
eFigure 1. Scatterplots of the Volume-Weighted Linear Correlations Between the Overall Composite Score and Each Standardized, Reliability-Adjusted Quality Metric Among Older Adults With Hip Fracture
eFigure 2. Scatterplots of the Volume-Weighted Linear Correlations Between the Overall Composite Score and Each Standardized, Reliability-Adjusted Quality Metric Among Older Adults With Traumatic Brain Injury (TBI)
Data Sharing Statement
References
- 1.Scott JW. Financial health is a critical component of optimal recovery for trauma survivors. Ann Surg. 2022;276(6):967-968. doi: 10.1097/SLA.0000000000005540 [DOI] [PubMed] [Google Scholar]
- 2.Zogg CK, Cooper Z, Peduzzi P, Falvey JR, Tinetti ME, Lichtman JH. Beyond in-hospital mortality: use of post-discharge quality-metrics provides a more complete picture of older adult trauma care. Ann Surg. 2023;278(2):e314-e330. doi: 10.1097/SLA.0000000000005707 [DOI] [PMC free article] [PubMed] [Google Scholar]
- 3.Jarman MP, Jin G, Weissman JS, et al. Association of trauma center designation with postdischarge survival among older adults with injuries. JAMA Netw Open. 2022;5(3):e222448. doi: 10.1001/jamanetworkopen.2022.2448 [DOI] [PMC free article] [PubMed] [Google Scholar]
- 4.MacKenzie EJ, Rivara FP, Jurkovich GJ, et al. A national evaluation of the effect of trauma-center care on mortality. N Engl J Med. 2006;354(4):366-378. doi: 10.1056/NEJMsa052049 [DOI] [PubMed] [Google Scholar]
- 5.Lau L, Ajzenberg H, Haas B, Wong CL. Trauma in the aging population: geriatric trauma pearls. Emerg Med Clin North Am. 2023;41(1):183-203. doi: 10.1016/j.emc.2022.09.006 [DOI] [PubMed] [Google Scholar]
- 6.Lucke JA, Mooijaart SP, Heeren P, et al. Providing care for older adults in the Emergency Department: expert clinical recommendations from the European Task Force on Geriatric Emergency Medicine. Eur Geriatr Med. 2022;13(2):309-317. doi: 10.1007/s41999-021-00578-1 [DOI] [PMC free article] [PubMed] [Google Scholar]
- 7.Uribe-Leitz T, Jarman MP, Sturgeon DJ, et al. National study of triage and access to trauma centers for older adults. Ann Emerg Med. 2020;75(2):125-135. doi: 10.1016/j.annemergmed.2019.06.018 [DOI] [PMC free article] [PubMed] [Google Scholar]
- 8.Kodadek LM, Selvarajah S, Velopulos CG, Haut ER, Haider AH. Undertriage of older trauma patients: is this a national phenomenon? J Surg Res. 2015;199(1):220-229. doi: 10.1016/j.jss.2015.05.017 [DOI] [PubMed] [Google Scholar]
- 9.Alshibani A, Alharbi M, Conroy S. Under-triage of older trauma patients in prehospital care: a systematic review. Eur Geriatr Med. 2021;12(5):903-919. doi: 10.1007/s41999-021-00512-5 [DOI] [PMC free article] [PubMed] [Google Scholar]
- 10.Berwick D, Downey A, Cornett E, eds. A National Trauma Care System: Integrating Military and Civilian Trauma Systems to Achieve Zero Preventable Deaths After Injury. National Academies of Sciences, Engineering, and Medicine; 2016. doi: 10.17226/23511 [DOI] [PubMed] [Google Scholar]
- 11.Hashmi ZG, Schneider EB, Castillo R, et al. Benchmarking trauma centers on mortality alone does not reflect quality of care: implications for pay-for-performance. J Trauma Acute Care Surg. 2014;76(5):1184-1191. doi: 10.1097/TA.0000000000000215 [DOI] [PubMed] [Google Scholar]
- 12.National Trauma Data Standard (NTDS). American College of Surgeons. 2023. Accessed April 27, 2023. https://www.facs.org/quality-programs/trauma/quality/national-trauma-data-bank/national-trauma-data-standard/
- 13.Traumatic brain injury & concussion. Centers for Disease Control & Prevention. 2023. Accessed April 27, 2023. https://www.cdc.gov/traumaticbraininjury/index.html
- 14.Comprehensive Care for Joint Replacement Model. Centers for Medicare & Medicaid Services. 2023. Accessed April 27, 2023. https://innovation.cms.gov/innovation-models/cjr
- 15.Overall Hospital Quality Star Rating on Care Compare Methodology Report (v4.0). Yale New Haven Health Services Corporation–Center for Outcomes Research and Evaluation; 2021. [Google Scholar]
- 16.Shwartz M, Ren J, Peköz EA, Wang X, Cohen AB, Restuccia JD. Estimating a composite measure of hospital quality from the Hospital Compare database: differences when using a bayesian hierarchical latent variable model versus denominator-based weights. Med Care. 2008;46(8):778-785. doi: 10.1097/MLR.0b013e31817893dc [DOI] [PubMed] [Google Scholar]
- 17.Staiger DO, Dimick JB, Baser O, Fan Z, Birkmeyer JD. Empirically derived composite measures of surgical performance. Med Care. 2009;47(2):226-233. doi: 10.1097/MLR.0b013e3181847574 [DOI] [PubMed] [Google Scholar]
- 18.Rose N, Wagner W, Mayer A, Nagengast B. Model-based manifest and latent composite-scores in structural equation models. Collabra Psychol. 2019;5(1):9. doi: 10.1525/collabra.143 [DOI] [Google Scholar]
- 19.Proust-Lima C, Philipps V, Dartigues JF, et al. Are latent variable models preferable to composite score approaches when assessing risk factors of change? evaluation of type-I error and statistical power in longitudinal cognitive studies. Stat Methods Med Res. 2019;28(7):1942-1957. doi: 10.1177/0962280217739658 [DOI] [PubMed] [Google Scholar]
- 20.Yoo C. The bayesian method for causal discovery of latent-variable odels from a mixture of experimental and observational data. Comput Stat Data Anal. 2012;56(7):2183-2205. doi: 10.1016/j.csda.2012.01.010 [DOI] [PMC free article] [PubMed] [Google Scholar]
- 21.Kind AJH, Jencks S, Brock J, et al. Neighborhood socioeconomic disadvantage and 30-day rehospitalization: a retrospective cohort study. Ann Intern Med. 2014;161(11):765-774. doi: 10.7326/M13-2946 [DOI] [PMC free article] [PubMed] [Google Scholar]
- 22.About the Neighborhood Atlas. University of Wisconsin School of Medicine and Public Health. 2023. Accessed April 27, 2023. https://www.neighborhoodatlas.medicine.wisc.edu
- 23.Kind AJH, Buckingham WR. Making neighborhood-disadvantage metrics accessible—the Neighborhood Atlas. N Engl J Med. 2018;378(26):2456-2458. doi: 10.1056/NEJMp1802313 [DOI] [PMC free article] [PubMed] [Google Scholar]
- 24.Zogg CK, Becher RD, Dalton MK, et al. Defining referral regions for inpatient trauma care: the utility of a novel geographic definition. J Surg Res. 2022;275:115-128. doi: 10.1016/j.jss.2021.12.050 [DOI] [PMC free article] [PubMed] [Google Scholar]
- 25.Doumouras AG, Haas B, Gomez D, et al. The impact of distance on triage to trauma center care in an urban trauma system. Prehosp Emerg Care. 2012;16(4):456-462. doi: 10.3109/10903127.2012.695431 [DOI] [PubMed] [Google Scholar]
- 26.Scheetz LJ, Orazem JP. The influence of sociodemographic factors on trauma center transport for severely injured older adults. Health Serv Res. 2020;55(3):411-418. doi: 10.1111/1475-6773.13270 [DOI] [PMC free article] [PubMed] [Google Scholar]
- 27.Zhang Y, Kunnath N, Dimick JB, Scott JW, Ibrahim AM. Social vulnerability and emergency general surgery among Medicare beneficiaries. J Am Coll Surg. 2023;236(1):208-217. doi: 10.1097/XCS.0000000000000429 [DOI] [PMC free article] [PubMed] [Google Scholar]
- 28.Herrera-Escobar JP, Uribe-Leitz T, Wang J, et al. The Social Vulnerability Index and long-term outcomes after traumatic injury. Ann Surg. 2022;276(1):22-29. doi: 10.1097/SLA.0000000000005471 [DOI] [PubMed] [Google Scholar]
- 29.Neiman PU, Flaherty MM, Salim A, et al. Evaluating the complex association between Social Vulnerability Index and trauma mortality. J Trauma Acute Care Surg. 2022;92(5):821-830. doi: 10.1097/TA.0000000000003514 [DOI] [PubMed] [Google Scholar]
- 30.Diaz A, Lindau ST, Obeng-Gyasi S, Dimick JB, Scott JW, Ibrahim AM. Association of hospital quality and neighborhood deprivation with mortality after inpatient surgery among Medicare beneficiaries. JAMA Netw Open. 2023;6(1):e2253620. doi: 10.1001/jamanetworkopen.2022.53620 [DOI] [PMC free article] [PubMed] [Google Scholar]
- 31.Diaz A, Valbuena VSM, Dimick JB, Ibrahim AM. Association of neighborhood deprivation, race, and postoperative outcomes: improvement in neighborhood deprivation is associated with worsening surgical disparities. Ann Surg. Published online July 7, 2022. doi: 10.1097/SLA.0000000000005475 [DOI] [PubMed] [Google Scholar]
- 32.Zogg CK, Thumma JR, Ryan AM, Dimick JB. Medicare’s Hospital Acquired Condition Reduction Program disproportionately affects minority-serving hospitals: variation by race, socioeconomic status, and disproportionate share hospital payment receipt. Ann Surg. 2020;271(6):985-993. doi: 10.1097/SLA.0000000000003564 [DOI] [PMC free article] [PubMed] [Google Scholar]
- 33.Zogg CK, Jiang W, Chaudhary MA, et al. Racial disparities in emergency general surgery: do differences in outcomes persist among universally insured military patients? J Trauma Acute Care Surg. 2016;80(5):764-775. doi: 10.1097/TA.0000000000001004 [DOI] [PubMed] [Google Scholar]
- 34.Zogg CK, Jiang W, Ottesen TD, et al. Racial/ethnic disparities in longer-term outcomes among emergency general surgery patients: the unique experience of universally insured older adults. Ann Surg. 2018;268(6):968-979. doi: 10.1097/SLA.0000000000002449 [DOI] [PMC free article] [PubMed] [Google Scholar]
- 35.Hicks CW, Hashmi ZG, Velopulos C, et al. Association between race and age in survival after trauma. JAMA Surg. 2014;149(7):642-647. doi: 10.1001/jamasurg.2014.166 [DOI] [PMC free article] [PubMed] [Google Scholar]
- 36.Trauma programs: verification, review, and consultation program for excellence in trauma centers. American College of Surgeons. 2023. Accessed April 27, 2023. https://www.facs.org/quality-programs/trauma/quality/verification-review-and-consultation-program/
- 37.Accreditation & verification: geriatric surgery verification, advancing care for older adult patients. American College of Surgeons. 2023. Accessed April 27, 2023. https://www.facs.org/quality-programs/accreditation-and-verification/geriatric-surgery-verification/
Associated Data
This section collects any data citations, data availability statements, or supplementary materials included in this article.
Supplementary Materials
eTable. Abbreviated Difference in Patient-Level Characteristics
eFigure 1. Scatterplots of the Volume-Weighted Linear Correlations Between the Overall Composite Score and Each Standardized, Reliability-Adjusted Quality Metric Among Older Adults With Hip Fracture
eFigure 2. Scatterplots of the Volume-Weighted Linear Correlations Between the Overall Composite Score and Each Standardized, Reliability-Adjusted Quality Metric Among Older Adults With Traumatic Brain Injury (TBI)
Data Sharing Statement