

Abstract
Background:
There is growing consensus that non-genetic determinants of dementia can be linked to various risk- and resiliency-enhancing factors accumulating throughout the lifespan, including socioeconomic conditions, early life experiences, educational attainment, lifestyle behaviors, and physical/mental health. Yet, the causal impact of these diverse factors on dementia risk remain poorly understood due to few longitudinal studies prospectively characterizing these influences across the lifespan.
Objective:
The Initial Lifespan’s Impact on Alzheimer’s Disease and Related Dementia (ILIAD) study aims to characterize dementia prevalence in the Wisconsin Longitudinal Study (WLS), a 60-year longitudinal study documenting life course trajectories of educational, family, occupational, psychological, cognitive, and health measures.
Methods:
Participants are surveyed using the modified Telephone Interview for Cognitive Status (TICS-m) to identify dementia risk. Those scoring below cutoff undergo home-based neuropsychological, physical/neurological, and functional assessments. Dementia diagnosis is determined by consensus panel and merged with existing WLS data for combined analysis.
Results:
Preliminary findings demonstrate the initial success of the ILIAD protocol in detecting dementia prevalence in the WLS. Increasing age, hearing issues, lower IQ, male sex, APOE4 positivity, and a steeper annualized rate of memory decline assessed in the prior two study waves, all increased likelihood of falling below the TICS-m cutoff for dementia risk. TICS-m scores significantly correlated with standard neuropsychological performance and functional outcomes.
Conclusion:
We provide an overview of the WLS study, describe existing key lifespan variables relevant to studies of dementia and cognitive aging, detail the current WLS-ILIAD study protocol, and provide a first glimpse of preliminary study findings.
Keywords: Alzheimer’s disease, dementia, epidemiologic determinants, health risk behaviors, prevalence
INTRODUCTION
The increasing prevalence of all-cause dementia in industrial societies, and in particular dementia due to Alzheimer’s disease (AD), marks an alarming public health crisis given the high rates of disability, morbidity, and cost of care for those affected [1]. Epidemiological studies have identified several factors influencing dementia risk that can be traced back to early life including socioeconomic status (SES), genetic predisposition, premorbid intelligence, educational attainment, geographical setting, and modifiable health factors [2–4]. Yet there are very few longitudinal studies prospectively tracking these diverse factors across the lifespan to establish causal links between early life variables and late life dementia onset. The Wisconsin Longitudinal Study (WLS)1 is a population-based 63-year longitudinal study following a randomly selected cohort of one third of all 1957 Wisconsin High School graduates born between 1938 and 1940 (n = 10,317), and a selected sibling that was empaneled prior to the 1993 data collection wave (n = 8,374) [5]. Originally launched as a survey tracking educational and occupational goals and achievement, the focus of data collection has expanded over the past six decades to provide a one-of-a-kind glimpse into nearly every facet of the participants lives. The WLS is considered one of the most comprehensive long-standing cohort studies currently in existence, capturing full life course trajectories of educational, family, occupational, psychological, cognitive, and health data [6]. Distinct highlights of the WLS include prospectively collected lifespan data, an administered measure of early life IQ obtained in high school, full life-time family and employment histories with detailed data on job characteristics, and available genetic and gut microbiome data.
As the study participants enter their eighth decade of life, the primary goal of data collection has shifted to capture end-of-life variables [5], including a newly funded data collection wave (the focus of the present manuscript) to characterize dementia prevalence in this cohort: The Initial Lifetime’s Impact on Alzheimer’s Disease and Related Dementias (ILIAD) study. In this ongoing data collection wave, we employ a phone-based dementia screening tool to rapidly identify individuals at risk for a clinical diagnosis of dementia, followed by a comprehensive home-based assessment capturing detailed neuropsychological functioning, medical history, and physical measures to characterize dementia prevalence. Although the WLS dataset has been available for public use for decades now, a formal diagnostic assessment of dementia is a novel addition to this cohort, and indeed, serves as the basis by which future work will be able to confidently explore the life course psychosocial determinants of dementia in WLS. The scope of the present manuscript is to introduce the WLS cohort to the dementia research community to pique interest in a publicly available dataset that is rich in life course psychosocial variables for future research interest. Our primary aim is to provide a general overview of the WLS study, describe key existing life course variables relevant to studies of dementia and cognitive aging, and to detail the current ILIAD study protocol used to establish dementia diagnosis in this cohort. The empirical data reported in this paper constitutes a secondary aim to provide focused analyses of relevant metrics and outcomes that support the validity of our diagnostic approach in identifying dementia.
Understanding lifespan factors that contribute to differences in the rate of age-related cognitive decline and individual vulnerability to neurodegenerative disease is crucial to promote healthy aging in our society. A recent report by the Lancet Commission on dementia prevention, intervention, and care suggests that up to 40% of all-cause dementia incidence can be attributed to 12 potentially modifiable risk- or reserve-enhancing factors across the lifespan [7]. These include: early life educational attainment; midlife hearing loss, traumatic brain injury, hypertension, alcohol consumption, and obesity; as well as late life smoking, depression, social isolation, physical inactivity, air pollution, and diabetes. However, this work was limited by no single database currently in existence that captures all 12 factors comprehensively, and by the fact that social isolation was only estimated by proxy (such as cohabitation rates). The WLS-ILIAD addresses these gaps by prospectively capturing the majority of these 12 factors often at multiple points throughout the lifespan, with measures of social relationships and engagement an area of intense focus of data collection. Another strength of the WLS-ILIAD study is its potential for investigating how early life experience impacts the rate and progression of late life incident dementia. Central to this aim is the notion of neurocognitive reserve, a construct capturing the degree to which “cumulative improvement in neural resources due to genetic and/or environmental factors is able to mitigate the effects of neural decline caused by aging or age-related diseases” [8]. Heterogeneity in reserve within the general population has been used to explain individual differences in susceptibility to age-related brain deterioration and differing clinical expression across individuals with similar levels of pathological burden [2, 9]. Thus, reserve functions as a moderator between age-related or pathological neurodegeneration and clinical or functional presentation. Although the construct of reserve and dementia incidence has been investigated in other cohort studies [10–13], none are comparable to the prospectively collected rich and complex social and environmental data that define the WLS. Thus, operating within the scope of currently available WLS data, all-cause dementia prevalence in an exceedingly large age-matched sample may serve as a useful surrogate endpoint in estimating the effects of reserve on late life brain health. In particular, because the effects of age-related brain change are held constant within this predominately same-aged cohort, observed variability in longitudinal cognitive decline or dementia incidence may be attributable to unhealthy brain aging that is likely a function of accumulating pathological processes or accelerated age-related neurodegeneration.
Although characterizing dementia prevalence is unique to the current WLS data collection wave (ILIAD study), prior investigations utilizing existing WLS data provide compelling evidence linking a variety of life course factors to late-life cognitive outcomes. For example, Clouston and colleagues demonstrated that educational attainment is significantly associated with measures of fluid cognition in adulthood, even after controlling for adolescent IQ and parental SES [14]. On the other hand, childhood SES was shown to significantly predict language and executive functioning abilities in late life [15], whereas a derived measure of adolescent grit (class rank controlling for IQ) has been shown to be associated with delayed memory performance [16]. In a recent study employing structural equation modeling, although childhood SES predicted a composite measure of late midlife cognition, this association was found to be mediated by adolescent IQ, educational attainment, as well as midlife economic and health status [17]. An additional study also employing structural equation modeling further demonstrated that both adolescent IQ and a combined measure of midlife SES (post-secondary education, income, and occupational status) fully mediated the association between childhood SES and late life cognitive functioning [18]. Other WLS-based studies have also shown beneficial effects of secondary school-level advantage (such as teacher ratios and teacher experience) [19], as well as subsequent college selectivity [20] on late life cognitive abilities.
Research into disease risk-enhancing factors has also shaped our understanding of the determinants of dementia. WLS provides a wealth of prospectively acquired data on variables with known and/or suspected causal links to dementia incidence. These include genetic factors such as Apolipoprotein E4 allele (APOE4) status, detailed medical history and conditions, life course SES indicators, documentation of stressful life events, early childhood disadvantage and environment, gut microbiome data, as well as complex social and caregiving relationship data. One study capitalizing on the sibling dyad structure of the WLS to evaluate gene by environment interactions revealed that higher educational attainment attenuates the effects of late-life cognitive decline associated with APOE4 risk, but only for those with education levels exceeding a high school diploma [21]. A similar investigation demonstrated that APOE4 status, and not childhood SES, independently predicted late life memory performance, although childhood SES, but not APOE4 status, independently predicted late life language and executive functioning [22]. WLS data has also shown greater levels of subjective cognitive decline among older mothers of adult children with disabilities who were also APOE4 carriers [23], no association between high school football participation and late life cognitive or depression outcomes [24], and that associations between moderate alcohol intake and midlife cognitive outcomes can largely be explained by differential drinking patterns associated with baseline intellectual ability [25].
Using existing WLS data prospectively tracking risk- and reserve-enhancing factors across the lifespan in combination with a new wave of data collection specifically aimed at capturing late life dementia prevalence, the ILIAD study offers unparalleled opportunities to investigate lifespan factors imparting both risk or resiliency to late life dementia onset. In particular, WLS is poised to address key questions persisting in the health and aging literature, namely: how early life factors impact adult health outcomes; the social stratification of healthy aging; and the use of sibling models to address the role of early life experience on late-life cognitive outcomes. The additional employment of sibling dyads combined with robust genetic data provide further tools to parse the effects of gene by environment interactions associated with late-life cognition and disease. Finally, this newest data collection wave (ILIAD study) offers a unique glimpse into undetected dementia prevalence within a large community-dwelling cohort. When linked to a wealth of existing data encompassing health literacy, health access, geographic setting, and detailed socioeconomic status, results could be instrumental in shaping public policies and initiatives to better identify dementia in our local communities and to support our most age-vulnerable populations.
MATERIALS AND METHODS
The WLS cohort
The Wisconsin Longitudinal Study is based on a randomly selected cohort of 1/3 of all 1957 high school graduates in the state of Wisconsin, born between 1938 and 1940 (n = 10,317). The WLS is one of the longest running studies of a single cohort of adults in the United States, and has been regarded as one of the most comprehensive, long-standing cohort studies currently in existence [26]. The graduate respondents completed the initial in-person questionnaire in 1957 at the age of 18, followed by a series of prospective data collection waves when respondents were around ages 25 (1964 – mail survey), 36 (1975 – telephone survey), 54 (1993 – telephone and mail surveys), 65 (2004 – telephone and mail surveys), 72 (2011 – in-person and mail surveys), and 81 (2020 – telephone and in-person surveys) [5, 6].
By the 1993 collection wave, a focal sibling of each graduate was randomly selected for inclusion in the study (n = 8,374), establishing a unique cohort of sibling dyads that has since been maintained throughout subsequent data waves with survey data largely matched to the original graduate pool. At the inception of the current phase of survey and data collection, we target roughly 6,000 participants drawn from both the graduate and sibling panel for inclusion in the WLS-ILIAD study. Retention for the WLS has been remarkably high (around 80% across all study waves for graduate respondents – see Fig. 1), and study members are tracked through to their deaths.
Fig. 1.
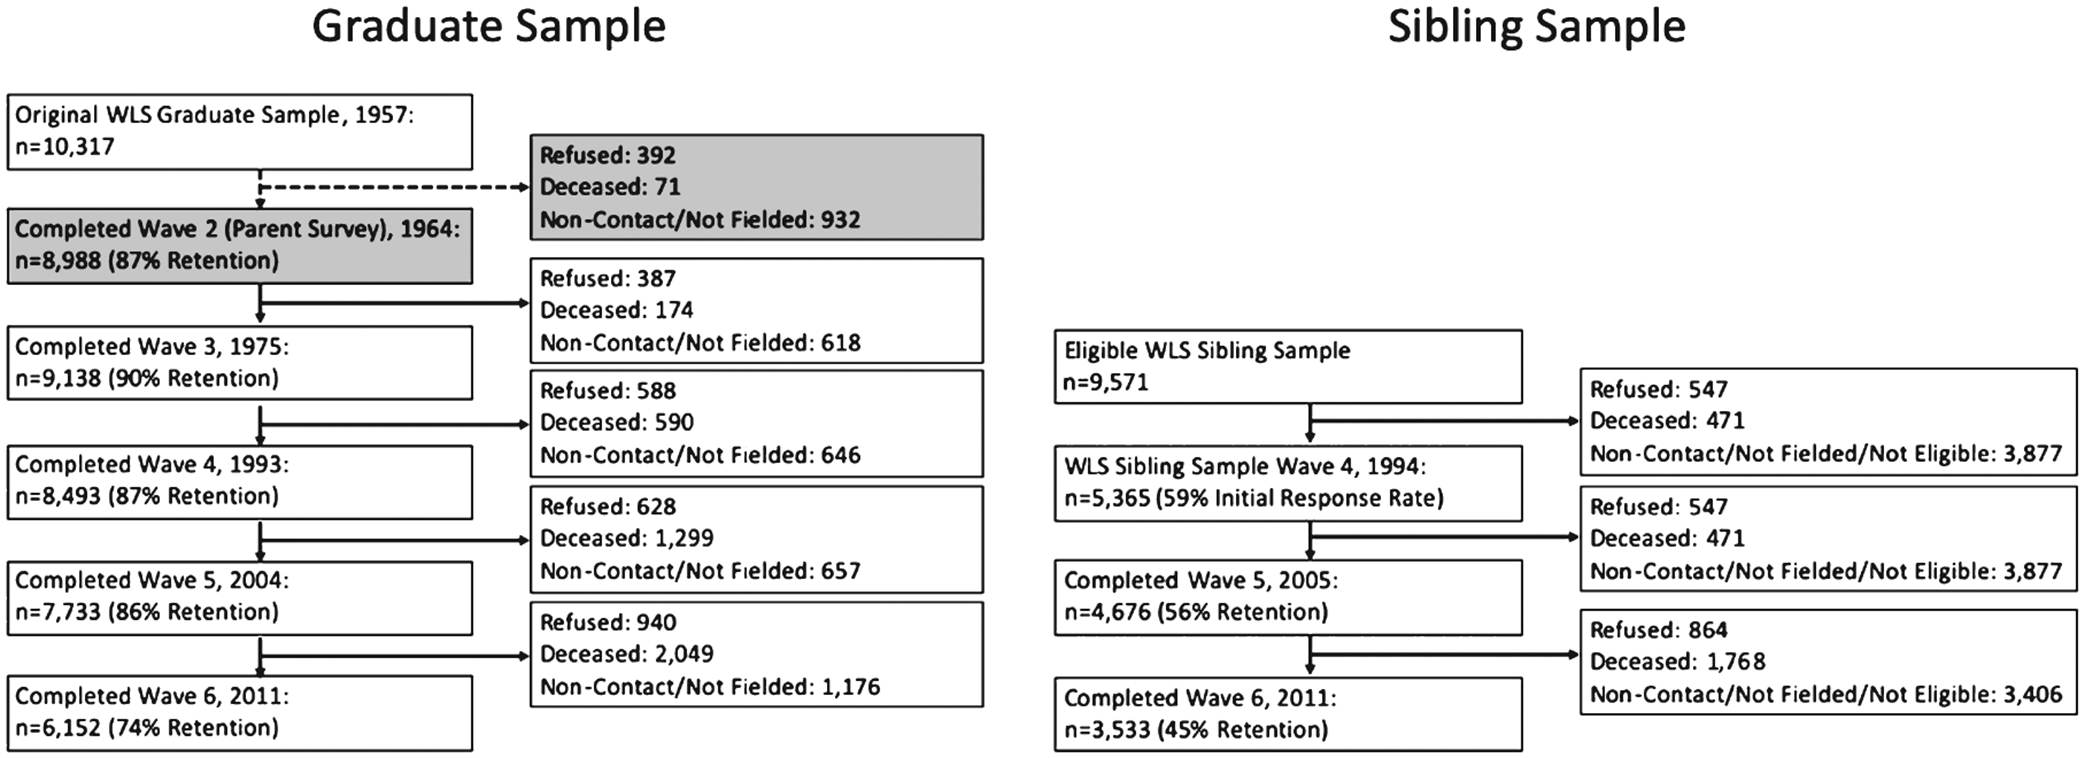
WLS graduate and sibling sample retention and attrition rates for each of the prior study waves. For graduates, the grayed boxes for Wave 2 reflect response metrics from a parent-administered survey, and do not capture actual graduate participation. Percent retention rates are calculated for all eligible participants for each study wave excluding known deceased participants. Overall retention rates for the graduate sample are quite high across study waves (74–90%), while sibling sample retention are a bit lower (45–59%). A full characterization of WLS retention data is publicly available at: https://www.ssc.wisc.edu/wlsresearch/documentation/retention/cor1004_retention.pdf.
The WLS sample is broadly representative of white, non-Hispanic individuals who completed at least a high school education. Around 19% of the sample is of farm origin (consistent with national estimates of those born in the late 1930s), and close to 2/3 of the cohort lived in Wisconsin at each study wave. Although this sample has limited racial/ethnic diversity reflecting the homogenous Caucasian population distribution in Wisconsin at the time of enrollment, the WLS sample does have strong socioeconomic diversity with more than 20% of the sample living below the poverty line at study enrollment in 1957, and nearly 30% of the study sample currently residing in rural locations. Further, sample homogeneity does provide some analytic strengths, particularly in regards to ruling out unobserved variable bias and in powering genetic studies.
Summary of existing WLS data
Although initial WLS surveys focused on key aspects of early life experiences including family structure and educational/occupational attainment, the focus of data collection priorities shifted towards mid- and late-life health factors as the cohort reached their early 50s. The project’s growing emphasis on health and aging is readily apparent, as cognitive, health history, and physical capacities encompass a strong focus of data collection efforts in surveys conducted in 2004, 2011, and in the present ILIAD study. A complete and detailed overview of existing WLS data up to the 2011 collection wave is described on the WLS website and linked manuals (http://www.ssc.wisc.edu/wlsresearch/), and in a previously published cohort profile [6]. Table 1 provides an overview of the data collection modules and key variables collected across each study wave. In light of the current data collection efforts focusing on dementia prevalence and risk, we highlight existing variables broadly relevant to these research aims below. Study retention and attrition data (broken down by graduate and sibling pools) for each of the completed study waves are summarized in Fig. 1.
Table 1.
Overview of WLS variables across study waves.
| WLS Data Collection Wave | |||||||
|---|---|---|---|---|---|---|---|
| 1957 | 1965 | 1975 | 1993 | 2004 | 2011 | 2020 | |
| Age of Graduate Respondents (years) | 18 | 25 | 36 | 54 | 65 | 72 | 81 |
| Mode of Survey | |||||||
| In-Person Interview | x | x | x | ||||
| Telephone Interview | x | x | x | x | |||
| Mail-in Survey | x | x | x | x | x | ||
| Social Participation | |||||||
| Religious orientation | x | x | x | x | x | ||
| Marital history and quality | x | x | x | x | x | ||
| Civic engagement (voting) | x | x | x | x | |||
| Community engagement | x | x | x | x | |||
| Caregiving | x | ||||||
| Social relationships, support and engagement | x | x | x | x | x | ||
| Density of social networks | |||||||
| Popularity | |||||||
| Voting data | |||||||
| Physical Health | |||||||
| Physical Functioning (gait speed, grip strength, peak flow, chair rise) | x | ||||||
| Anthropometric measures | x | x | x | x | |||
| Self-report of health and disease | x | x | x | x | x | ||
| Cause and date of death | |||||||
| Menopause/Hormone Replacement | x | x | x | ||||
| Signs of physical aging | |||||||
| Genetic Markers | x | ||||||
| Wisconsin State Tumor Registry | |||||||
| Medicare Records | |||||||
| Vision screener | x | ||||||
| Facial attractiveness | |||||||
| Mental Health | |||||||
| Psychological well-being | x | x | x | ||||
| Depression | x | x | x | x | |||
| Personality inventories | x | x | x | ||||
| Stressful life events | x | x | x | ||||
| Early Life Socioeconomic Conditions | |||||||
| Parental education and occupation | |||||||
| Income data form 1939 & 1957 | |||||||
| Parental encouragement for education | x | ||||||
| Occupation, income, and Wealth | |||||||
| Work trajectories | x | x | x | x | x | ||
| Cognitive and physical job demands | x | x | x | ||||
| Social Security lifetime earnings | |||||||
| Midlife assets data | x | x | x | ||||
| Parental Earnings (1957–1960) | |||||||
| 1940 Census data | |||||||
| Geographic Data | |||||||
| Geographic identifiers | x | x | x | x | x | x | |
| Farm status | |||||||
| Area resource files | |||||||
| Lifestyle Behaviors | |||||||
| Smoking history | x | x | x | x | |||
| Alcohol use history | x | x | x | x | |||
| Exercise and physical activity | x | x | x | x | |||
| Sexual activity | x | x | x | ||||
| End of life preparations | x | x | |||||
| Internet use | x | x | |||||
| Cognitive/Functional Measures | |||||||
| Henmon-Nelson IQ Scores (1954–7) | |||||||
| Letter/Category Fluency | x | x | x | ||||
| WAIS-III Similarities | x | x | x | ||||
| Word Recall | x | x | x | ||||
| Digit ordering | x | x | |||||
| Number series task | x | x | |||||
| Health literacy | x | ||||||
| Financial literacy | x | ||||||
| UDS3 Neuropsychological Battery | x | ||||||
| Daily Functioning (ADL/IADLs) | x | x | x | ||||
| Education | |||||||
| High school class rank | |||||||
| School district data | |||||||
| College/University characteristics | |||||||
| Participation in school activities | |||||||
| Educational attainment reports | x | x | x | x | x | x | |
Note: All italicized variables are Administratively Collected Data (not part of survey).
Cognition
Perhaps one of the more unique aspects of the WLS study is the availability of a standardized assessment of adolescent intellectual functioning (Henmon-Nelson IQ scores) for all participants that was administered in high school [27]. In addition, prospectively collected cognitive data was first ascertained in a limited capacity in the 1993 survey, comprised of a subset of 8 abstract reasoning items from the Wechsler Adult Intelligence Scale – Revised (WAIS-R) [28]. Efforts to better characterize cognition increased in subsequent data collection waves, with a short battery of cognitive assessments administered in 2004 and repeated in 2011, including: a 10-item word recall task, digit ordering task, phonemic and category fluency, as well as repeated and new items from the WAIS-R similarities task that was first administered in the 1993 survey. The current data collection phase greatly expands the scope of cognitive data through the administration of a phone-based cognitive screening measure, and a comprehensive in-person full neuropsychological assessment for individuals identified at risk for dementia tapping a range of cognitive domains (memory, language, attention, visuospatial abilities, and executive functioning). A linguistic functioning module was added to the 2011 survey instrument and administered to a randomly selected sub-sample of 16% of respondents – providing measures of accuracy and latency completing various language tasks (rapid naming, word identification, picture naming, number judgment, word recognition, and category verification). Further, all survey interviews were digitally recorded, allowing additional research aims exploring linguistic and acoustic variables of speech.
Genetic data
Genetic data was obtained from saliva samples collected by mail from 7,101 WLS participants (4,569 graduates and 2,532 siblings) in 2007–2008, with additional genetic samples collected in-person during the 2011 study wave home-based interviews. To accommodate the use of a mail-back protocol for sample collection, Oragene kits were selected due to not requiring immediate freezing, high average DNA yield, and successful implementation in prior studies [29]. DNA was extracted from saliva collected and genotyping was performed by Kbiosciences, LLS for 84 single nucleotide polymorphisms (SNPs). Additional genetic data processing was completed for 9,012 study participants genotyped at the Center for Inherited Disease Research (CIDR) at Johns Hopkins University on the Illumina HumanOmniExpress array. The array consists of a total of 713,014 SNPs, including APOE genotyping. In addition to SNP level genetic data, several polygenic risk scores have been calculated based on genome-wide association studies (GWAS) and are made freely available, including polygenic scores of educational attainment, self-reported math ability, cognitive performance, depression, subjective well-being, and neuroticism [30, 31]. Exciting advantages of the WLS cohort for genetic analysis include the large sample, matched sibling pairs, a relatively homogenous population, and the rich contextual data allowing for gene by environment interaction studies.
Gut microbiome
Recently (between 2014–2015), a feasibility study was completed using the WLS cohort to investigate how social conditions across the life course influence gut microbiome composition, and their links to health and mortality [32]. A total of 500 cases were randomly selected from a constrained subset of WLS participants based on completion of the 2011 survey, were representative of both rural and urban geographic settings, and were part of a sibling pair. Of the initial pool, 329 participants (graduates and siblings combined) provided stool sample specimens, with a total of 149 sibling pairs. Stool samples were also obtained from an additional 94 spouses of the WLS sample. Data collection was accompanied by an in-person survey assessing detailed recent dietary data, prescription/antibiotic use, living situation, and additional health information. Recent results suggest that spouses have more microbiota in common than siblings, and that married individuals with reported close relationships have the greatest microbiome diversity and richness than those living alone [33]. This data is available to researchers upon request.
Educational attainment
While most cohort studies capture educational attainment obtained primarily in early life during traditional “schooling periods”, the WLS documents a complete history of educational attainment across the lifespan, including educational pursuits in adulthood (1957–2011). In addition to traditional measures of total educational attainment and years of schooling, both the survey and administrative data provide a wealth of qualitative educational variables including high school coursework, perceptions of parents and teachers, school characteristics, educational aspirations, class rank, and school resources and characteristics.
Social variables
Given that the roots of the WLS are situated within a sociological research perspective, the depth and breadth of available social and environmental variables are astounding, offering a unique opportunity to link late-life cognitive functioning and disease prevalence with a lifespan’s worth of social determinants. Notable highlights from the social domain include 1957 yearbook-derived measures of facial attractiveness and participation in school activities, involvement with organizations, time spent with friends/family, relationship quality, religious affiliation and participation, caregiving, family structure (including spousal interviews in 2004 wave), non-normative parenting, marital history/quality, retirement, civic participation, and voting behavior. Additional variables of interest/relevance were introduced in 2011, including internet utilization, health literacy, and end of life preparations and attitudes.
Physical health and disease
Although the majority of health-related variables are based on self-reported health histories and behaviors, direct measures of physical health are available from the in-person 2011 interview data, and also represent a focus of the current phase of data collection within the ILIAD study. The 1993 data wave marked a shift toward an interest in physical health and disease, with this survey and subsequent waves capturing a detailed report of general health, chronic conditions (i.e., hypertension, diabetes, cancer, heart problems, strokes, joint pain, arthritis, etc.), calculation of the Health Utilities Index, menopause and hormone replacement use, access to health care and insurance, alcohol and tobacco use, obesity, along with retrospective data on childhood health captured in 2004. For all health conditions noted by the participant, follow-up questions documented the time of diagnosis, the extent to which the condition interferes with daily life and activities, and in some cases how the condition is being treated/managed. A direct assessment of physical functioning was unique to the 2011 collection wave, assessing quantitative anthropomorphic measures (height, weight, waist circumference, hip circumference, and 2 photographs), gait speed, grip strength, peak flow, and chair rise. The 2011 data collection wave also marked the addition of an in-person assessment of health literacy and past anesthesia history. Physical health data is supplemented with several administrative variables based on Medicare claims records, the Wisconsin State Tumor Registry, and mortality and cause of death data.
Mental health
A focus on mental health was largely materialized in the 1993 data collection wave and continued in the 2004 and 2011 collection waves, with survey items assessing measures of depression, personality, psychological well-being, psychological distress, and stressful life events. The depression module consists of a detailed characterization of recent depressive episodes and a comprehensive assessment of current depressive symptoms. Psychological well-being includes measures of autonomy, environmental mastery, personal growth, positive relation to others, purpose in life, and self-acceptance. Personality was assessed using the Five-Factor Model of Personality Structure: extraversion, openness, neuroticism, conscientiousness, and agreeableness. Detailed characterizations of both general and subject-specific stressful life events and coping reactions (i.e., experiencing death of loved one, natural disaster, incarceration, physical abuse, life-threatening illness, divorce, etc.) are also available.
Non-survey derived data
In addition to the over 10,000 available survey-derived variables, the WLS has also curated a range of administrative variables compiled from public records and other outside sources. These include access to participant’s Medicare claims records, Social Security lifetime earnings and benefits records, voting data, data from high school yearbooks (i.e., facial attractiveness, facial mass index (obesity), participation in school activities), high school class rank, Henmon-Nelson IQ scores (1954–1957) [27], geographical identifiers, mortality and cause of death data, and the Wisconsin state tumor registry.
Current study design: ILIAD study protocol
The general research strategy for the present study involves an initial phone-based interview of the active and living WLS cohort through partnership with the University of Wisconsin Survey Center to identify individuals at risk for dementia or cognitive impairment, and to obtain updated health and social measures collected in prior study waves. As illustrated in Fig. 2, individuals selected as at-risk for dementia based on telephone-based cognitive screening undergo an intensive follow-up in-home neuropsychological and medical assessment. Data gathered during the in-home comprehensive assessment is reviewed by a multidisciplinary panel (physician, clinical neuropsychologist, and nurse practitioner) to arrive at a consensus based clinical diagnosis of dementia. For cases in which the consensus panel is unable to clearly establish a diagnosis based on in-home assessment data and medical records, participants are invited for an on-site assessment at the University of Wisconsin (UW) Madison, Alzheimer’s Disease Research Center (ADRC) to obtain clinical dementia biomarker data (magnetic resonance imaging (MRI), blood draw) and/or additional neuropsychological assessment to support a more definitive diagnosis. This new wave of data collection quantifying current level of cognitive status is merged with existing lifespan data collected in prior study waves, providing researchers with a wealth of life course predictors of dementia prevalence in this unique cohort. All research was performed in accordance with the ethical standards of the Committee on Human Experimentation and the Helsinki Declaration of 1975, as determined by the Institutional Review Board (IRB) at the University of Wisconsin at Madison, School of Medicine and Public Health.
Fig. 2.

Overview of Wisconsin Longitudinal Study (WLS) – Initial Lifetime Impact on Alzheimer’s Disease and Related Dementia (ILIAD) study protocol. The general research strategy involves an initial phone-based interview of the active and living WLS cohort through partnership with the University of Wisconsin Survey Center to identify individuals at risk for dementia or cognitive impairment, and to obtain updated health and social measures collected in prior study waves. Those participants selected as at-risk for dementia based on telephone-based cognitive screening undergo an intensive follow-up in-home neuropsychological and medical assessment. Data gathered during the in-home comprehensive assessment is reviewed by a multidisciplinary panel (physician, clinical neuropsychologist, and nurse practitioner) to arrive at a consensus clinical diagnosis of dementia. For cases in which the consensus panel is unable to clearly establish a diagnosis based on in-home assessment data and medical records, participants are invited for an on-site assessment at the University of Wisconsin (UW) Madison, Alzheimer’s Disease Research Center (ADRC) to obtain clinical dementia biomarker data (MRI, blood draw) and/or additional neuropsychological assessment to support a more definitive diagnosis.
Phase 1: Phone-based cognitive screening
All living and active WLS participants are eligible to participate in the study and recruited into Phase 1 by phone and/or mail. The targeted recruitment sample (~6,000 graduates and siblings) is prioritized for data collection based on active graduate/sibling pairs, advanced age, and those previously selected for cognitive data collection in the last two study waves (administered to ~80% of the total WLS sample). Following recruitment and informed consent, enrolled participants complete a phone-based interview consisting of the Telephone Interview for Cognitive Status-modified (TICS-m) to screen for cognitive impairment, as well as answer additional survey questions to update existing health and social information (health self-rating and physical abilities, health conditions, and socializing modules). The TICS-m is a 10-min screening instrument with a maximum score of 50 points that broadly assess orientation, attention, working memory, conceptual reasoning, language skills, and episodic memory for words. Prior work has reported that using a cutoff of 28 points or below achieves 99% sensitivity and 86% specificity diagnosing dementia [34]. Final scores on this measure are adjusted for educational attainment using previously published adjustment formulas: 2 points are subtracted for those with 13 or more years of education, 2 points are added for those with 8–10 years of education, and 5 points added for those with less than 8 years of education [34, 35]. Prior to administration of the cognitive screening measure, efforts are made to minimize distractions and interruptions during the assessment, and a brief hearing screen is conducted. Any perceived hearing difficulties noted by the examiner are recorded and documented. Participants who score above cutoff on the TICS-m (> 28) undergo a rescreening Phase I interview between 22 and 24 months later to assess for change in cognitive status that confers eligibility into a second recruitment round of Phase 2.
Phase 2: Comprehensive home-based assessment
Study participants identified as at-risk for dementia based on falling at or below the 28-point cutoff on the TICS-m are eligible for Phase 2 of the study, which is a comprehensive in-home visit consisting of medical interviews and questionnaires, a physical and neurological examination, and formal neuropsychological evaluation. These 3 to 4 hour in-person visits are conducted by a trained nurse practitioner and a highly experienced survey interviewer, with modules completed by both the participant and a designated study partner to provide an informant report.
The in-home medical assessment is performed by a nurse practitioner and consists of an interview assessing comprehensive medical history and evolution of cognitive symptoms, limitations in daily functioning, assessment of current medications, presence and/or history of neuropsychiatric symptoms, and family history of memory problems. The physical assessment includes vital signs (blood pressure, pulse, height, weight, waist-to-hip ratio), and standardized physical and neurological exams. The nurse practitioners also proctor a standardized self-report inventory of depression symptoms (15-item version of the Geriatric Depression Scale) [36].
The comprehensive neuropsychological assessment is conducted by a trained field interviewer and overseen by a licensed clinical psychologist. The cognitive assessment is aligned with the National Alzheimer’s Coordinating Center (NACC) – Updated Data Set 3 (UDS3) neuropsychological battery and includes the following measures: Montreal Cognitive Assessment (MoCA), Craft Story 21 (immediate and delayed recall), Benson Figure (copy and delayed recall), number span test (forwards and backwards), category fluency (animals and vegetables), phonemic fluency (C,F,L), Trail Making Test parts A and B, and the Multilingual Naming Test (MINT) [37]. Participants also complete the subject portion of the Clinical Dementia Rating (CDR) scale, and the subject version of the Informant Questionnaire on Cognitive Decline in the Elderly (IQCODE) to assess awareness of cognitive deficits via self-perceived cognitive changes over a 10-year period.
Collateral report is obtained from a designated study partner and includes the following measures: the informant potion of the Clinical Dementia Rating (CDR) scale [38] to provide an estimate of dementia severity; the Neuropsychiatric Inventory Questionnaire (NPI-Q) [39] to assess the presence and severity of current psychiatric symptoms; the Functional Assessment Scale (FAS) to document functional impairments in completing instrumental activities of daily living; and Informant Questionnaire on Cognitive Decline in the Elderly (IQCODE) [40] to assess perceived cognitive changes over a 10-year period.
Clinical dementia diagnosis
A clinical diagnosis of dementia is determined during a diagnostic consensus meeting among a committee of at least 3 interdisciplinarity study team members representing the following domains of expertise: physician, neuropsychologist, and nurse practitioner. Diagnostic protocols closely adhere to standards followed by the National Alzheimer’s Coordinating Center and are based on all relevant data collected during the phone and in-home assessments, as well as available medical records when requested. The operationalization of dementia subtypes follow previously published research guidelines and criteria: mild cognitive impairment [41], Alzheimer’s disease [42], dementia with Lewy bodies [43], vascular dementia [44], and frontotemporal dementia [45].
Phase 3: Clinic-based biomarker collection
If the diagnostic consensus panel is unable to reach a diagnosis following completion of Phase 2, participants are invited to the UW Madison ADRC to complete a Phase 3 visit. Phase 3 visits focus on biomarker acquisition to confirm/deny the presence of neurodegenerative disease and/or to provide etiological clarification for cognitive impairment. At this visit, participants undergo an MRI exam, amyloid positron emission tomography (PET) scan, blood draw, and/or additional neuropsychological evaluation.
Non-response and proxy assessments
Because non-respondents are more likely to have health or cognitive impairments, for those who are unable to be reached by phone, we employ targeted non-response follow-up with an in-person visit. This technique has been employed in prior data collection waves, and we expect this effort to result in a ~5% increase in overall response rate. Proxy assessments (typically with a spouse or child) are completed for deceased participants in order to collect data for use in selection models and to correct bias associated with mortality. Proxy assessments are also conducted for respondents who are too ill or disabled to complete phone-based or in-person assessments. This confidential phone-based interview employs a validated instrument (Dementia Questionnaire) to classify the likelihood of whether the deceased participant had dementia prior to death. We attempt an in-person home assessment for participants who are alive, but unable to complete the Phase I phone interview due to health or cognitive impairment. Capacity for consent is assessed prior to enrollment and if concerns arise, assent from the participant and consent from an acceptable proxy is obtained prior to any study procedure.
Statistical analysis of preliminary data
Prior to statistical analysis all data was assessed for the presence of outliers and checked for normality. A series of independent samples T-tests and chi-square analyses were conducted to assess group-level differences on demographic variables between those selected/not-selected for Phase 2 assessment based on TICS-m score. Logistic regression was used to ascertain the combined effects of age, education, sex, APOE4 status, IQ, and documented hearing/disruption issues during TICS-m administration on the likelihood that participants were selected for Phase 2. Additional exploratory analyses were conducted to investigate whether Phase 2 selection cohorts (selected versus not-selected) differed in performance on delayed recall for a 10-item word list collected in the prior two study waves (2004 and 2011), as well as differences in the annualized rate of change in recall performance between these two time points. Annualized rate of change was calculated for each participant by dividing the difference in observed raw test scores between 2011 and 2004 by the time difference (in years) between assessments. Independent samples T-tests were used to determine between-group differences in both cross-sectional delayed recall performance at each time point, as well as in the calculated rate of annualized change in this measure over time.
Among those who completed Phase 2 (n = 52), a series of one-way analysis of variance and chi-squared analyses were performed to compare the three resultant diagnostic groups (normal cognition, MCI, and dementia) on basic demographic and relevant outcome variables. If the overall model was significant, Tukey post-hoc tests were used to assess pair-wise comparisons. Pearson bivariate correlations were also conducted to assess linear associations between the TICS-m final outcome score with demographic variables, as well as with performances on the in-person Phase 2 neuropsychological assessment measures. Linear regression was used to further evaluate these associations while controlling for additional confounding variables. Due to the preliminary nature of this sample, all analyses were based on available data for each variable and missing data was not imputed.
RESULTS
ILIAD study: Preliminary findings
Data collection for the current WLS study wave began in August of 2019. As of October 2020, the status of Phase 1 cases are as follows: 1,200 cases are yet to be contacted, 2,631 cases are currently being fielded, 146 cases have declined to participate, and 2,169 cases have completed Phase 1. Of the 2,169 cases having completed Phase 1, 484 cases have screened into Phase 2, and 52 cases have completed Phase 2 diagnostic consensus. To date, 3 participants have been selected for Phase 3 in-clinic biomarker assessment, although we estimate that 10% of the total Phase 2 participants will have undergone Phase 3 assessment by study completion. It is important to note that the results reported here are preliminary in nature and may not be representative of future findings based on the completed data set.
Phase 1 results
Basic demographics for the preliminary sample of 2,169 completed Phase 1 participants are presented in Table 2. Of these completed Phase 1 cases, those selected for Phase 2 in-person evaluation (based on a total cutoff score on the TICS-m of ≤28) tended to be older (t(787.02) = 10.47, p < 0.001), less educated (t(753.01) = 2.94, p = 0.003), and were of a greater proportion male (χ2(1) = 13.28, p < 0.001). Those cases selected for Phase 2 also had a greater number of documented hearing issues or disruptions during the TICS-m administration when compared to those not selected (χ2(1) = 41.41, p < 0.001). The two selection groups did not differ by race, with the overall sample being predominately white (> 99%). The proportion of graduates to siblings was not different between the two selection groups (p > 0.05). Of the 1,925 cases with available genetic data, individuals with at least 1 APOE4 allele were more likely to be screened into Phase 2 based on lower TICS-m performance (χ2(1) = 10.09, p = 0.001).
Table 2.
Demographic and outcome measures for preliminary sample of completed Phase 1 cases
| Phase 2 Selected TICS-M ≤ 28 (n = 484) | Phase 2 Not-Selected TICS-m > 28 (n = 1685) | p | |
|---|---|---|---|
| Age (y) | 80.97 (3.8) | 78.73 (4.5) | < 0.001 |
| Sex (% Female) | 47 | 57 | < 0.001 |
| Race (% white) | 99 | 99 | ns |
| Education (y) | 13.96 (2.4) | 14.35 (2.6) | 0.003 |
| Respondent type (% graduates) | 59 | 56 | ns |
| TICS-m Total Score | 24.71 (3.6) | 33.68 (3.3) | < 0.001 |
| TICS-m Hearing Issues / Disruptions (% yes) | 25 | <1 | 0.045 |
| ApoE-4 Allele Status (% positive) | 27 | 20 | 0.002 |
| High School IQ (Percentile) | 56.32 (26.47) | 69.12 (23.27) | < 0.001 |
| 2004 Delayed Recall Score | 3.70 (2.06) | 4.43 (1.93) | < 0.001 |
| 2011 Delayed Recall Score | 2.90 (1.59) | 4.01 (1.72) | < 0.001 |
| Delayed Recall Annualized Change (2011–2004) | −0.12 (0.36) | −0.07 (0.35) | 0.007 |
TICS-m, Telephone Interview of Cognitive Status – modified; High school intelligence quotient (IQ) based on administered measure of Henmon-Nelson Test of Mental Abilities; 2004 and 2011 delayed recall score based on 10-item word list.
A logistic regression was performed to ascertain the combined effects of age, education, sex, APOE4 status, IQ, and documented hearing/disruption issues during TICS-m administration on the likelihood that participants were selected for Phase 2. The logistic regression model was statistically significant (χ2(6) = 153.35, p < 0.0001). The model explained 13.3% (Nagelkerke R2) of the variance in Phase 2 selection and correctly classified 77.8% of cases. Cases in which there were noted hearing issues or disruptions during the TICS-m administration were 2.2 times more likely to be selected into Phase 2. Resultant odds ratios reveal that increasing age (1.06), male sex (1.52), positive APOE4 status (1.51), and lower adolescent IQ (1.02) were also associated with a statistically significant increased likelihood of Phase 2 selection, whereas education level was not a significant predictor in this model.
Additional exploratory analyses implemented a series of independent samples T-tests to investigate whether Phase 2 selection groups differed on delayed memory performance for a 10-item word list assessed at the prior 2 study waves (2004 and 2011), as well as for differences in the annualized rate of change in this measure between the two timepoints. As visualized in Fig. 3, results indicated that those selected for Phase 2 had significantly lower delayed recall performance cross-sectionally at each prior time point (2004 delayed recall: t(1740) = 6.46, p < 0.001; 2011 delayed recall: t(1874)=11.92, p < 0.001), as well as a steeper annualized rate of change in delayed recall performance between time points (t(1695) = 2.70, p = 0.007). A follow-up logistic regression was performed to test whether the annualized rate of change in delayed recall performance between 2004 and 2011 remained a significant predictor of Phase 2 selection after controlling for additional covariates of baseline age at timepoint 1, sex, and education. The logistic regression model was statistically significant (χ2(4) = 103.49, p < 0.0001). The model explained 9.1% (Nagelkerke R2) of the variance in Phase 2 selection and correctly classified 78.5% of cases. Resultant odds ratios reveal that increasing baseline age (1.15), male sex (1.69), lower education (0.92), and a steeper decline in annualized delayed recall performance (0.70) were associated with a statistically significant increased likelihood of Phase 2 selection.
Fig. 3.

A) Participants selected for Phase 2 (red line: TiCS-m ≤ 28) scored significantly lower than those not selected (blue line: TICS-m > 28) on delayed recall for a 10-item word list assessed at the prior two study waves (2004 and 2011). B) Those selected for Phase 2 (red) also showed a steeper annualized rate of change on delayed word recall between the two timepoints, compared to cases not selected (blue).
Phase 2 results
Basic demographic and outcome variables for the initial sample of 52 participants who have completed Phase 2 to date are reported in Table 3. The mean age of individuals who have currently completed Phase 2 is 80.26 years (SD = 3.35; range = 73–91 years), with a mean education of 14.19 years (SD = 2.11; range = 12–18 years). This preliminary sample is comprised of 44.2% females, 88.5% of participants are right handed, 65% of participants are graduate respondents (as opposed to siblings), and all participants listed their reported race as white (reflective of the overall WLS sample from which they were drawn). The mean raw TICS-m score falling below selection criteria (adjusted score ≤28) is 26.31 (SD = 3.56; range = 14–30), and the education adjusted TICS-m score for this sample is 25.13 (SD = 3.31; range = 14–28).
Table 3.
Demographic and cognitive/functional outcome measure for preliminary sample of completed Phase 2 cases
| NC (n = 20) | MCI (n = 23) | Dementia (n = 9) | p | |
|---|---|---|---|---|
| Demographic Measures | ||||
| Age | 76.65 (3.2) | 80.65 (3.1) | 80.67 (4.4) | ns |
| Sex (% Female) | 45 | 43 | 44 | ns |
| Education | 14.75 (2.3) | 13.78 (1.9) | 14.00 (2.3) | ns |
| TICS-m Hearing Issue (% yes) | 45% | 26% | 56% | ns |
| Neuropsychological Measures | ||||
| TICS-m | 26.25 (1.65)a | 25.57 (2.54)a | 21.56 (5.25)b | 0.001 |
| MoCA | 23.90 (2.92)a | 20.65 (2.82)b | 18.00 (3.32)c | < 0.001 |
| Craft Immediate – Verbatim | 20.25 (4.64)a | 14.04 (6.88)b | 11.67 (6.87)b | 0.001 |
| Craft Delay – Verbatim | 16.85 (5.17)a | 10.35 (6.24)b | 7.33 (6.86)b | < 0.001 |
| Benson Figure Copy | 15.25 (1.21) | 14.65 (2.37) | 13.89 (1.83) | ns |
| Benson Figure Delay Recall | 10.90 (2.65)a | 5.96 (4.13)b | 2.78 (2.95)c | < 0.001 |
| RAVLT A1-A5 Learning Trials (sum) | 31.25 (7.33)a | 23.65 (6.66)b | 23.56 (6.46)b | 0.001 |
| RAVLT A6 Immediate Recall | 5.65 (2.60)a | 2.48 (1.93)b | 0.67 (0.87)c | < 0.001 |
| RAVLT A7 Delay Recall | 4.85 (2.76)a | 1.43 (1.56)b | 0.67 (1.00)b | < 0.001 |
| Number Span Forward – Total Score | 7.20 (2.51) | 6.48 (2.23) | 5.56 (1.88) | ns |
| Number Span Backward – Total Score | 5.40 (1.90)a | 4.96 (1.80)a | 3.33 (1.32)b | 0.019 |
| Category Fluency (Animals+Vegetables) | 29.90 (6.15)a | 25.61 (7.48)a,b | 21.89 (10.14)b | 0.027 |
| Letter Fluency (F + C+L) | 32.60 (8.28) | 35.48 (14.28) | 24.11 (9.28) | ns |
| Digit Symbol (seconds) | 37.40 (7.65)a | 30.30 (9.85)b | 26.11 (9.44)b | 0.005 |
| Multilingual Naming Test | 29.15 (2.25) | 28.30 (2.82) | 28.00 (2.74) | ns |
| Trail Making Test – Part A (s) | 42.20 (13.52)a | 59.87 (28.42)b | 67.56 (23.25)c | 0.011 |
| Trail Making Test – Part B (s) | 117.06 (35.71)a | 220.09 (85.61)b | 222.50 (63.55)b | < 0.001 |
| Clinical and Self-Report Measures | ||||
| CDR-SoB | 0.30 (0.50) a | 0.89 (1.05) a | 3.28 (2.48) b | < 0.001 |
| FAS | 0.60 (1.50) a | 0.59 (1.14) a | 6.33 (4.39) b | < 0.001 |
| IQ-CODE (informant) | 3.17 (0.20) a | 3.16 (0.27) a | 3.54 (0.32) b | < 0.001 |
| IQ-CODE (self) | 3.20 (0.22) a | 3.02 (0.43) a | 3.54 (0.34) b | 0.001 |
| GDS-15 | 2.28 (0.54)a | 1.57 (1.63)a | 2.50 (2.62)a | ns |
Means within a row (i.e., diagnostic groups) without a common superscript letter differ from one another (p < 0.05), as analyzed by one-way ANOVA. Those with the same superscript letter do not significantly differ from one another. TICS-m, Telephone Interview of Cognitive Status – modified; MoCA, Montreal Cognitive Assessment; CDR-SoB, Clinical Dementia Rating Scale–Sum of Boxes; FAS, Functional Activities Scale; IQ-CODE, Informant Questionnaire of Cognitive Decline in the Elderly; GDS-15, Geriatrics Depression Scale – 15 item sub-scale; RAVLT, Rey Auditory Verbal Learning Test; ns, not significant.
Based on a consensus diagnostic approach, of the 52 completed Phase 2 cases: 9 met criteria for dementia, 23 met criteria for mild cognitive impairment (MCI), and 20 were determined to have normal cognition (NC). However, it should be noted that the “normal cognition” group as determined by diagnostic consensus may not reflect a true normal population given their poor performance on the TICS-m conferring initial eligibility for Phase 2. As reported in Table 3, the three resultant diagnostic groups did not significantly differ in regards to age, sex, or education (p > 0.05 for all). Regardless of diagnosis, participants who were perceived to have hearing issues during the TICS-m administration scored significantly lower (24.85, SD = 4.44) on this cognitive screening measure than those without noted hearing issues (27.22, SD = 2.56) (t(27.01) = −2.17, p = 0.039). However, the frequency of documented hearing issues did not significantly differ between the resultant three diagnostic groups. Raw TICS-m scores were positively associated with years of education (r = 0.277, p = 0.047), which was attenuated when using the education-adjusted TICS-m score that reduces the score by 2 points for those with education -≥13 years (r = 0.072, p = 0.211). Thus, the education adjusted TICS-m score was used for all subsequent analyses. A higher degree of self-reported depression symptoms on the GDS-15 was associated with lower TICS-m performance (r = −0.403, p = 0.005), although mean GDS scores did not significantly differ between the three diagnostic groups (F(2,44) = 0.828, p = 0.443). Age was not significantly associated with TICS-m scores, likely due to the restricted age range of this cohort (p > 0.05).
Adjusted TICS-m scores were significantly different between the three groups as determined by one-way ANOVA (F(2,49) = 8.56, p = 0.001). A Tukey post hoc test revealed that TICS-m scores were significantly lower in the AD group (21.56 ± 5.25) compared to the MCI group (25.57 ± 2.54, p = ±0.003) and NC group (26.25 ± 1.65, p = 0.001). However, the difference in TICS-m scores did not reach a level of statistical significance between the MCI and NC groups (p = 0.722). Although limited by a restricted range due to the selection cutoff criteria, phone-based TICS-m performance was significantly associated with performance on the in-person administered MoCA (r = 0.436, p = 0.001). Average MoCA scores differed across all three groups (F(2,49) = 13.94, p < 0.001), with Tukey post hoc tests indicating a stepwise decline: AD group being the most impaired (18.0 ± 3.3), followed by the MCI group (20.7 ± 2.5), with highest scores obtained by the NC group (23.9 ± 2.9).
Between-group differences in neuropsychological outcome measures were analyzed using one-way ANOVA, with Tukey post hoc tests used to assess follow-up pairwise comparisons. The three diagnostic groups differed in mean performance on the majority of neuropsychological outcome measures (summarized in Table 3), with the exception of Benson Figure Copy, Number Span Forward, Letter Fluency, and Multilingual Naming Test—all of which mean performances were comparable across groups. Of the neuropsychological tests that showed a between-group difference, only three measures showed a step-wise pattern of decline across increasingly impaired diagnostic groups: Benson Figure Delay Recall, RAVLT Immediate Recall, and Trail Making Test Part A. The majority of neuropsychological measures showed a pattern of better performances by the NC group compared to both the MCI and NC groups (where the latter two groups did not significantly differ in mean performance): Craft Story Immediate and Delayed Recall, RAVLT learning Trials 1–5, RAVLT Delayed Recall, Digit Symbol, and Trail Making Test Part B. Only 1 measure (Number Span Backwards) showed similar performances between NC and MCI groups – both of whom performed better than the AD group, Finally, on a semantic fluency measure (animals + vegetables), the NC group performed better than the AD group, although no statistically significant differences were found between NC and MCI, or between MCI and AD groups.
Within this initial Phase 2 sample, TICS-m performance was significantly correlated with performance on the majority of the neuropsychological outcome measures, as well as with measures of daily functioning, as summarized in Table 4. Although the overall TICS-m score was not significantly correlated with in-person measures of learning and memory, the delayed recall item on the TICS-m was significantly correlated with delayed recall score on the RAVLT (r = 0.408, p = 0.003). This positive correlation between TICS-m and RAVLT delay recall scores remained significant when entered into a linear regression model controlling for noted hearing issues during the phone-based assessment (F(2,49) = 6.185, p = 0.016). The three diagnostic groups also differed on measures of daily functioning and reported cognitive symptoms (both by self and informant): FAS (F(2,48) = 26.13, p < 0.001), CDR sum of boxes (F(2,49) = 26.47, p < 0.001), and the self and informant versions of the IQ-CODE (self: (F(2,49) = 7.51, p = 0.001), informant: (F(2,48) = 22.33, p < 0.001)). Tukey post hoc tests revealed that the AD group had the greatest level of impairment across all functional and self-report measures compared to both the MCI and NC groups. The finding of elevations on functional outcome scales (FAS) scale observed only in the AD group supports the consensus-based diagnosis given that impairments in instrumental activities of daily living is a defining characteristic differentiating MCI from dementia status.
Table 4.
Correlations between TICS-m score and clinical/neuropsychological measures in the preliminary Phase 2 sample
| r | p | n | |
|---|---|---|---|
| Neuropsychological Measures | |||
| MoCA | 0.436 | 0.001 | 52 |
| Craft Story Immediate Recall – Verbatim | 0.235 | 0.093 | 52 |
| Craft Story Delay Recall – Verbatim | 0.123 | 0.384 | 52 |
| Benson Figure Copy | 0.322 | 0.020 | 52 |
| Benson Figure Delay Recall | 0.291 | 0.037 | 52 |
| RAVLT A1-A5 Learning Trials (sum) | 0.292 | 0.036 | 52 |
| RAVLT A6 Immediate Recall | 0.329 | 0.017 | 52 |
| RAVLT A7 Delay Recall | 0.159 | 0.259 | 52 |
| Number Span Forward (Total Score) | 0.260 | 0.063 | 52 |
| Number Span Backward (Total Score) | 0.299 | 0.031 | 52 |
| Category Fluency (Animals + Vegetables) | 0.429 | 0.001 | 52 |
| Letter Fluency (F + C+L) | 0.436 | 0.001 | 52 |
| Digit Symbol | 0.386 | 0.005 | 52 |
| Multilingual Naming Test | 0.354 | 0.010 | 52 |
| Trail Making Test – Part A | −0.334 | 0.015 | 52 |
| Trail Making Test – Part B | −0.391 | 0.006 | 48 |
| Clinical and Self-Report Measures | |||
| Geriatric Depression Scale −15 item version | −0.403 | 0.005 | 47 |
| CDR – Global score | −0.453 | 0.001 | 52 |
| CDR – SoB | −0.612 | 0.001 | 52 |
| FAS | −0.403 | 0.003 | 51 |
| IQ-CODE Self | −0.102 | 0.471 | 52 |
| IQ-CODE Informant | −0.325 | 0.020 | 51 |
MoCA, Montreal Cognitive Assessment; RAVLT, Rey Auditory Verbal Learning Test; CDR-SoB, Clinical Dementia Rating scale – Sum of Boxes; FAS, Functional Activities Scale; IQ-CODE, Informant Questionnaire of Cognitive Decline in the Elderly.
DISCUSSION
Longitudinal studies prospectively tracking cognitive risk- and resilience-enhancing factors across the lifespan to establish causal links between early life variables and late life dementia onset are rare. The WLS-ILIAD study capitalizes on the rich and complex characterization of socioeconomic conditions, early life experiences, educational attainment, lifestyle behaviors, and physical/mental health variables captured by the WLS to identify the life course determinants of dementia in one of the longest running cohort studies currently in existence. In addition to over 60 years of comprehensive data collection, highlights of the WLS dataset include the availability of genetic and gut microbiome data, the empanelment of a select sibling of the original graduate pool resulting in sibling dyads, as well as an administered measure of adolescent IQ obtained in early life. Although prior studies leveraging WLS data have revealed intriguing associations between early life factors and late-life cognition [14–23], the underlying etiology of observed cognitive variance in late life is uncertain without the availability of well-characterized dementia diagnosis. As the WLS cohort enters their eighth decade of life, the WLS-ILIAD study addresses this limitation by implementing a multi-phase protocol to detect dementia prevalence in this large and unique cohort of community-dwelling older adults. Although data collection remains underway, our preliminary findings support the efficacy of a brief telephone-administered cognitive screening measure to detect dementia risk, followed by detailed neuropsychological, functional, and medical assessment, to arrive at a consensus diagnosis of dementia. This manuscript serves as a timely introduction of the WLS cohort to the dementia and Alzheimer’s disease research community, highlighting the anticipated value of this one-of-a-kind dataset in investigating the life course and social determinants of dementia risk and resiliency.
Although data collection is still underway, our preliminary results suggest that the TICS-m is an effective cognitive screening measure to detect dementia risk in this community-based population. Although hearing issues and noted disruptions during the phone-based administration of this measure increase risk for selection to Phase 2, we found that these issues did not subsequently differ between the three resultant diagnostic groups (dementia, mild cognitive impairment, normal cognition). In agreement with other studies evaluating the psychometric properties of the TICS-m [46–48], even with the restricted range of TICS-m scores due to selection cutoff criteria in this Phase 2 sample, we still found good convergent validity between this measure and performances across a wide range of in-person administered neuropsychological measures. In particular, the strongest correlations were observed between performance on the TICS-m and tasks of verbal fluency and executive functioning. On the other hand, overall TICS-m scores were not significantly correlated with measures of delayed memory, consistent with results from a prior study suggesting that the TICS-m is most adept at capturing “general cognitive ability” as opposed to memory functioning alone [47]. Supporting this notion, the in-person administered MoCA showed the strongest correlation with the TICS-m with an effect size in the medium to large range. Poorer TICS-m performance was also significantly associated with reduced functional-based outcomes, with moderate to strong correlations with the CDR sum of boxes and the FAS. Furthermore, we demonstrate that a variety of basic demographic indicators and previously known risk factors for cognitive decline are associated with poorer performance on the TICS-m. Increasing age, lower adolescent IQ, male sex, ApoE-4 allele carriers, and steeper annualized rate of change on a delayed recall measure assessed in the prior two study waves incurred a greater likelihood to be selected into Phase 2 as determined by TICS-m cutoff.
Although our preliminary analyses of Phase 2 data were limited by our modest sample size of currently completed cases (n = 52), we find that the three resultant diagnostic groups (NC, MCI, AD) significantly differed on key variables that support our consensus-based diagnostic approach. Namely, those who were diagnosed with AD showed a significantly higher degree of impairment on informant-based scales assessing daily functioning and instrumental activities of daily living (FAS, IQCODE), compared to both the NC and MCI group. Further, the AD group exhibited significantly poorer performance on the majority of neuropsychological outcomes measures, with the strongest between-group discrepancies noted on delayed recall memory tasks. Although current results suggest that the three resultant diagnostic groups did not significantly differ on key demographic variables (i.e., age, education), we expect this finding may change as the sample size of completed cases increases.
Of those selected into Phase 2, 9/52 individuals (17%) met criteria for AD based on a consensus panel diagnostic approach. Again, this should be interpreted with caution as this is just a small percentage of cases meeting criteria for Phase 2, and there are currently 484 additional cases (and growing) that have been screened into this in-person assessment phase and are awaiting diagnostic consensus. Prior epidemiological studies have suggested that the rate of undiagnosed dementia within the general community is quite high, with one estimating that over 58% of older adults with dementia are undiagnosed [49]. In that study, factors identified as increasing the risk of undiagnosed dementia included Hispanic ethnicity, having less than a high school education, attending medical appointments alone, and presenting with a fewer number of functional impairments [49]. Although the WLS sample has limited racial/ethnic diversity reflecting the homogenous Caucasian population distribution in Wisconsin at the time of enrollment, the cohort does have strong socioeconomic diversity with more than 20% of the sample living below the poverty line at study enrollment in 1957, and nearly 30% of the study sample currently residing in rural locations. As the ILIAD study reaches completion, we eagerly anticipate reporting on additional and unique factors available in the existing WLS dataset (such as rurality, health utilization behaviors, and social factors) that may also increase risk for undiagnosed dementia in community settings.
In conclusion, the WLS is a longitudinal cohort study that offers unique insight into life course determinants of dementia with the anticipated completion of the ILIAD study. Using a multi-phasic design, we are currently in the process of screening for dementia risk using a telephone-based approach in a targeted population of over 6000 active WLS participants. Those selected for Phase 2 based on established cutoff scores on the TICS-m subsequently undergo a home-based in-person visit collecting comprehensive medical and neuropsychological assessments to inform a consensus panel diagnostic approach for dementia or cognitive impairment. Although the determination of dementia prevalence in this cohort stands to advance our understanding of life course factor imparting risk or resilience to late life dementia onset in and of itself, we are also excited to report additional funding for a supplemental award (R01AG060737–02) to assess the feasibility of collecting additional Alzheimer’s disease biomarker data as well, including: MRI, amyloid and tau PET, blood, and cerebrospinal fluid data. If successful, we anticipate that this additional supplemental data would provide not only a strong measure of biomarker confirmed dementia prevalence, but also provide a necessary platform to fully evaluate the concept of neurocognitive reserve and resiliency across varying degrees of accumulating Alzheimer’s disease pathological burden. In all, we are pleased to report our initial success in carrying out the ILIAD protocol within the WLS cohort. Although far from complete, our preliminary evidence supports our current methodological approach and shows great promise in examining the broad and cumulative impact of life course determinants of dementia in this large community-dwelling population.
ACKNOWLEDGMENTS
The authors would like to thank the National Institute on Aging for funding the ILIAD study (RO1AG060737–01), the University of Wisconsin Survey Center for their integral role in developing and implementing all data collection survey instruments, as well as the National Alzheimer’s Coordinating Center (NACC) and the Wisconsin Alzheimer’s Disease Research Center (ADRC) for their support and resources in study design and instrumentation.
Footnotes
Authors’ disclosures available online (https://www.j-alz.com/manuscript-disclosures/20-1422r1).
The WLS data, along with accompanying documentation, are available to the public and can be accessed at http://www.ssc.wisc.edu/wlsresearch/. Requests for protected data or assistance should be directed to wls@ssc.wisc.edu.
REFERENCES
- [1].Brookmeyer R, Abdalla N, Kawas CH, Corrada MM (2018) Forecasting the prevalence of preclinical and clinical Alzheimer’s disease in the United States. Alzheimers Dement 14, 121–129. [DOI] [PMC free article] [PubMed] [Google Scholar]
- [2].Stern Y, Barulli D (2019) Cognitive reserve. Handb Clin Neurol 167, 181–190. [DOI] [PubMed] [Google Scholar]
- [3].Valenzuela MJ, Sachdev P (2006) Brain reserve and dementia: A systematic review. Psychol Med 36, 441–454. [DOI] [PubMed] [Google Scholar]
- [4].Wang X-J, Xu W, Li J-Q, Cao X-P, Tan L, Yu J-T (2019) Early-life risk factors for dementia and cognitive impairment in later life: A systematic review and meta-analysis. J Alzheimers Dis 67, 221–229. [DOI] [PubMed] [Google Scholar]
- [5].Sewell WH, Hauser RM, Springer KW, Hauser TS (2003) As we age: A review of the Wisconsin Longitudinal Study, 1957–2001. Res Soc Stratif Mobil 20, 3–111. [Google Scholar]
- [6].Herd P, Carr D, Roan C (2014) Cohort profile: Wisconsin longitudinal study (WLS). Int J Epidemiol 43, 34–41. [DOI] [PMC free article] [PubMed] [Google Scholar]
- [7].Livingston G, Huntley J, Sommerlad A, Ames D, Ballard C, Banerjee S, Brayne C, Burns A, Cohen-Mansfield J, Cooper C, Costafreda SG, Dias A, Fox N, Gitlin LN, Howard R, Kales HC, Kivimäki M, Larson EB, Ogunniyi A, Orgeta V, Ritchie K, Rockwood K, Sampson EL, Samus Q, Schneider LS, Selbæk G, Teri L, Mukadam N (2020) Dementia prevention, intervention, and care: 2020 report of the Lancet Commission. Lancet 396, 413–446. [DOI] [PMC free article] [PubMed] [Google Scholar]
- [8].Cabeza R, Albert M, Belleville S, Craik FIM, Duarte A, Grady CL, Lindenberger U, Nyberg L, Park DC, Reuter-Lorenz PA, Rugg MD, Steffener J, Rajah MN (2018) Maintenance, reserve and compensation: The cognitive neuroscience of healthy ageing. Nat Rev Neurosci 19, 701–710. [DOI] [PMC free article] [PubMed] [Google Scholar]
- [9].Satz P (1993) Brain reserve capacity on symptom onset after brain injury: A formulation and review of evidence for threshold theory. Neuropsychology 7, 273–295. [Google Scholar]
- [10].Dekhtyar S, Marseglia A, Xu W, Darin-Mattsson A, Wang H-X, Fratiglioni L (2019) Genetic risk of dementia mitigated by cognitive reserve: A cohort study. Ann Neurol 86, 68–78. [DOI] [PMC free article] [PubMed] [Google Scholar]
- [11].Richards M, Sacker A (2003) Lifetime antecedents of cognitive reserve. J Clin Exp Neuropsychol 25, 614–624. [DOI] [PubMed] [Google Scholar]
- [12].Rusmaully J, Dugravot A, Moatti J-P, Marmot MG, Elbaz A, Kivimaki M, Sabia S, Singh-Manoux A (2017) Contribution of cognitive performance and cognitive decline to associations between socioeconomic factors and dementia: A cohort study. PLoS Med 14, e1002334. [DOI] [PMC free article] [PubMed] [Google Scholar]
- [13].Wang H-X, MacDonald SWS, Dekhtyar S, Fratiglioni L (2017) Association of lifelong exposure to cognitive reserve-enhancing factors with dementia risk: A community-based cohort study. PLoS Med 14, e1002251. [DOI] [PMC free article] [PubMed] [Google Scholar]
- [14].Clouston SA, Kuh D, Herd P, Elliott J, Richards M, Hofer SM (2012) Benefits of educational attainment on adult fluid cognition: International evidence from three birth cohorts. Int J Epidemiol 41, 1729. [DOI] [PMC free article] [PubMed] [Google Scholar]
- [15].Greenfield EA, Moorman SM (2019) Childhood socioeconomic status and later life cognition: Evidence from the Wisconsin Longitudinal Study. J Aging Health 31, 1589–1615. [DOI] [PMC free article] [PubMed] [Google Scholar]
- [16].Rhodes E, Devlin KN, Steinberg L, Giovannetti T (2017) Grit in adolescence is protective of late-life cognition: Non-cognitive factors and cognitive reserve. Aging Neuropsychol Cogn 24, 321–332. [DOI] [PMC free article] [PubMed] [Google Scholar]
- [17].Zhang Z, Liu H, Choi S-W (2020) Early-life socioeconomic status, adolescent cognitive ability, and cognition in late midlife: Evidence from the Wisconsin Longitudinal Study. Soc Sci Med 244, 112575. [DOI] [PMC free article] [PubMed] [Google Scholar]
- [18].Greenfield EA, Moorman S, Rieger A (2020) Life course pathways from childhood socioeconomic status to later life cognition: Evidence from the Wisconsin Longitudinal Study. J Gerontol B Psychol Sci Soc Sci, doi: 10.1093/geronb/gbaa062 [DOI] [PMC free article] [PubMed] [Google Scholar]
- [19].Moorman SM, Greenfield EA, Garcia S (2019) School context in adolescence and cognitive functioning 50 years later. J Health Soc Behav 60, 493–508. [DOI] [PMC free article] [PubMed] [Google Scholar]
- [20].Garcia S, Moorman SM (2021) College selectivity and later-life memory function: Evidence from the Wisconsin Longitudinal Study. Res Aging 43, 14–24. [DOI] [PMC free article] [PubMed] [Google Scholar]
- [21].Cook CJ, Fletcher JM (2015) Can education rescue genetic liability for cognitive decline? Soc Sci Med 127, 159. [DOI] [PMC free article] [PubMed] [Google Scholar]
- [22].Moorman SM, Carr K, Greenfield EA (2018) Childhood socioeconomic status and genetic risk for poorer cognition in later life. Soc Sci Med 212, 219–226. [DOI] [PMC free article] [PubMed] [Google Scholar]
- [23].Song J, Mailick MR, Greenberg JS (2020) Apolipoprotein ε4 allele and subjective cognitive functioning in parents of adults with disabilities. J Gerontol Ser B 75, e189–e197. [DOI] [PMC free article] [PubMed] [Google Scholar]
- [24].Deshpande SK, Hasegawa RB, Rabinowitz AR, Whyte J, Roan CL, Tabatabaei A, Baiocchi M, Karlawish JH, Master CL, Small DS (2017) Association of playing high school football with cognition and mental health later in life. JAMA Neurol 74, 909–918. [DOI] [PMC free article] [PubMed] [Google Scholar]
- [25].Krahn D, Freese J, Hauser R, Barry K, Goodman B (2003) Alcohol use and cognition at mid-life: The importance of adjusting for baseline cognitive ability and educational attainment. Alcohol Clin Exp Res 27, 1162–1166. [DOI] [PubMed] [Google Scholar]
- [26].National Research Council (US) Committee on Future Directions for Behavioral and Social Sciences Research at the National Institutes of Health (2001) New Horizons in Health: An Integrative Approach, National Academies Press (US), Washington (DC). [Google Scholar]
- [27].Henmon VAC, Nelson MJ, Lamke TA (1931) The Henmon-Nelson tests of mental ability. Houston Miffin Company, Boston. [Google Scholar]
- [28].Wechsler D (1981) WAIS-R: Wechsler Adult Intelligence Scale-Revised. Psychological Corporation, New York, NY. [Google Scholar]
- [29].Rylander-Rudqvist T, Håkansson N, Tybring G, Wolk A (2006) Quality and quantity of saliva DNA obtained from the self-administrated Oragene method—a pilot study on the cohort of Swedish men. Cancer Epidemiol Prev Biomark 15, 1742–1745. [DOI] [PubMed] [Google Scholar]
- [30].Lee JJ, Wedow R, Okbay A, Kong E, Maghzian O, Zacher M, Nguyen-Viet TA, Bowers P, Sidorenko J, Karlsson Linnér R, Fontana MA, Kundu T, Lee C, Li H, Li R, Royer R, Timshel PN, Walters RK, Willoughby EA, Yengo L, Alver M, Bao Y, Clark DW, Day FR, Furlotte NA, Joshi PK, Kemper KE, Kleinman A, Langenberg C, Mägi R, Trampush JW, Verma SS, Wu Y, Lam M, Zhao JH, Zheng Z, Boardman JD, Campbell H, Freese J, Harris KM, Hayward C, Herd P, Kumari M, Lencz T, Luan J, Malhotra AK, Metspalu A, Milani L, Ong KK, Perry JRB, Porteous DJ, Ritchie MD, Smart MC, Smith BH, Tung JY, Wareham NJ, Wilson JF, Beauchamp JP, Conley DC, Esko T, Lehrer SF, Magnusson PKE, Oskarsson S, Pers TH, Robinson MR, Thom K, Watson C, Chabris CF, Meyer MN, Laibson DI, Yang J, Johannesson M, Koellinger PD, Turley P, Visscher PM, Benjamin DJ, Cesarini D (2018) Gene discovery and polygenic prediction from a genome-wide association study of educational attainment in 1.1 million individuals. Nat Genet 50, 1112–1121. [DOI] [PMC free article] [PubMed] [Google Scholar]
- [31].Turley P, Walters RK, Maghzian O, Okbay A, Lee JJ, Fontana MA, Nguyen-Viet TA, Wedow R, Zacher M, Fur-lotte NA, Magnusson P, Oskarsson S, Johannesson M, Visscher PM, Laibson D, Cesarini D, Neale BM, Benjamin DJ (2018) Multi-trait analysis of genome-wide association summary statistics using MTAG. Nat Genet 50, 229–237. [DOI] [PMC free article] [PubMed] [Google Scholar]
- [32].Herd P, Schaeffer NC, DiLoreto K, Jacques K, Stevenson J, Rey F, Roan C (2018) The influence of social conditions across the life course on the human gut microbiota: A pilot project with the Wisconsin Longitudinal Study. J Gerontol B Psychol Sci Soc Sci 73, 124–133. [DOI] [PMC free article] [PubMed] [Google Scholar]
- [33].Dill-McFarland KA, Tang Z-Z, Kemis JH, Kerby RL, Chen G, Palloni A, Sorenson T, Rey FE, Herd P (2019) Close social relationships correlate with human gut microbiota composition. Sci Rep 9, 703. [DOI] [PMC free article] [PubMed] [Google Scholar]
- [34].Knopman DS, Roberts RO, Geda YE, Pankratz VS, Christianson TJH, Petersen RC, Rocca WA (2010) Validation of the Telephone Interview for sognitive status-modified in subjects with normal cognition, mild cognitive impairment, or dementia. Neuroepidemiology 34, 34–42. [DOI] [PMC free article] [PubMed] [Google Scholar]
- [35].Gallo JJ, Breitner JCS (1995) Alzheimer’s disease in the NAS-NRC Registry of ageing twin veterans: IV. Performance characteristics of a two-stage telephone screening procedure for Alzheimer’s dementia. Psychol Med 25, 1211–1219. [DOI] [PubMed] [Google Scholar]
- [36].Sheikh JI, Yesavage JA (1986) Geriatric Depression Scale (GDS): Recent evidence and development of a shorter version. Clin Gerontol J Aging Ment Health 5, 165–173. [Google Scholar]
- [37].Weintraub S, Besser L, Dodge HH, Teylan M, Ferris S, Goldstein FC, Giordani B, Kramer J, Loewenstein D, Marson D, Mungas D, Salmon D, Welsh-Bohmer K, Zhou X-H, Shirk SD, Atri A, Kukull WA, Phelps C, Morris JC (2018) Version 3 of the Alzheimer Disease Centers’ Neuropsychological Test Battery in the Uniform Data Set (UDS). Alzheimer Dis Assoc Disord 32, 10–17. [DOI] [PMC free article] [PubMed] [Google Scholar]
- [38].Morris JC (1993) The Clinical Dementia Rating (CDR): Current version and scoring rules. Neurology 43, 2412–2414. [DOI] [PubMed] [Google Scholar]
- [39].Kaufer DI, Cummings JL, Ketchel P, Smith V, MacMillan A, Shelley T, Lopez OL, DeKosky ST (2000) Validation of the NPI-Q, a brief clinical form of the Neuropsychiatric Inventory. J Neuropsychiatry Clin Neurosci 12, 233–239. [DOI] [PubMed] [Google Scholar]
- [40].Jorm AF (1994) A short form of the Informant Questionnaire on Cognitive Decline in the Elderly (IQCODE): Development and cross-validation. Psychol Med 24, 145–153. [DOI] [PubMed] [Google Scholar]
- [41].Albert MS, DeKosky ST, Dickson D, Dubois B, Feldman HH, Fox NC, Gamst A, Holtzman DM, Jagust WJ, Petersen RC, Snyder PJ, Carrillo MC, Thies B, Phelps CH (2011) The diagnosis of mild cognitive impairment due to Alzheimer’s disease: Recommendations from the National Institute on Aging-Alzheimer’s Association workgroups on diagnostic guidelines for Alzheimer’s disease. Alzheimers Dement 7, 270–279. [DOI] [PMC free article] [PubMed] [Google Scholar]
- [42].McKhann GM, Knopman DS, Chertkow H, Hyman BT, Jack CR, Kawas CH, Klunk WE, Koroshetz WJ, Manly JJ, Mayeux R, Mohs RC, Morris JC, Rossor MN, Schel-tens P, Carrillo MC, Thies B, Weintraub S, Phelps CH (2011) The diagnosis of dementia due to Alzheimer’s disease: Recommendations from the National Institute on Aging-Alzheimer’s Association workgroups on diagnostic guidelines for Alzheimer’s disease. Alzheimers Dement 7, 263–269. [DOI] [PMC free article] [PubMed] [Google Scholar]
- [43].McKeith IG, Boeve BF, DIckson DW, Halliday G, Taylor JP, Weintraub D, Aarsland D, Galvin J, Attems J, Ballard CG, Bayston A, Beach TG, Blanc F, Bohnen N, Bonanni L, Bras J, Brundin P, Burn D, Chen-Plotkin A, Duda JE, El-Agnaf O, Feldman H, Ferman TJ, Ffytche D, Fujishiro H, Galasko D, Goldman JG, Gomperts SN, Graff-Radford NR, Honig LS, Iranzo A, Kantarci K, Kaufer D, Kukull W, Lee VMY, Leverenz JB, Lewis S, Lippa C, Lunde A, Masellis M, Masliah E, McLean P, Mollenhauer B, Montine TJ, Moreno E, Mori E, Murray M, O’Brien JT, Orimo S, Postuma RB, Ramaswamy S, Ross OA, Salmon DP, Singleton A, Taylor A, Thomas A, Tiraboschi P, Toledo JB, Trojanowski JQ, Tsuang D, Walker Z, Yamada M, Kosaka K (2017) Diagnosis and management of dementia with Lewy bodies. Neurology 89, 88–100. [DOI] [PMC free article] [PubMed] [Google Scholar]
- [44].Román GC, Tatemichi TK, Erkinjuntti T, Cummings JL, Masdeu JC, Garcia JH, Amaducci L, Orgogozo J-M, Brun A, Hofman A, Moody DM, O’Brien MD, Yamaguchi T, Grafman J, Drayer BP, Bennett DA, Fisher M, Ogata J, Kokmen E, Bermejo F, Wolf PA, Gorelick PB, Bick KL, Pajeau AK, Bell MA, DeCarli C, Culebras A, Korczyn AD, Bogousslavsky J, Hartmann A, Scheinberg P (1993) Vascular dementia. Neurology 43, 250. [DOI] [PubMed] [Google Scholar]
- [45].Neary D, Snowden JS, Gustafson L, Passant U, Stuss D, Black S, Freedman M, Kertesz A, Robert PH, Albert M, Boone K, Miller BL, Cummings J, Benson DF (1998) Frontotemporal lobar degeneration. Neurology 51, 1546. [DOI] [PubMed] [Google Scholar]
- [46].Cook SE, Marsiske M, McCoy KJM (2009) The Use of the Modified Telephone Interview for Cognitive Status (TICS-M) in the detection of amnestic mild cognitive impairment. J Geriatr Psychiatry Neurol 22, 103–109. [DOI] [PMC free article] [PubMed] [Google Scholar]
- [47].van den Berg E, Ruis C, Biessels GJ, Kappelle LJ, van Zandvoort MJE (2012) The Telephone Interview for Cognitive Status (Modified): Relation with a comprehensive neuropsychological assessment. J Clin Exp Neuropsychol 34, 598–605. [DOI] [PubMed] [Google Scholar]
- [48].de Jager CA, Budge MM, Clarke R (2003) Utility of TICS-M for the assessment of cognitive function in older adults. Int J Geriatr Psychiatry 18, 318–324. [DOI] [PubMed] [Google Scholar]
- [49].Amjad H, Roth DL, Sheehan OC, Lyketsos CG, Wolff JL, Samus QM (2018) Underdiagnosis of dementia: An observational study of patterns in diagnosis and awareness in US older adults. J Gen Intern Med 33, 1131–1138. [DOI] [PMC free article] [PubMed] [Google Scholar]